


Serviços Personalizados
Journal
Artigo
 Inglês (pdf)
 Artigo em XML
 Referências do artigo
 Enviar este artigo por email
Indicadores
-
 Citado por SciELO
 -
 Acessos
Links relacionados
-
 Citado por Google
 -
 Similares em
SciELO
Similares em
SciELO -
 Similares em Google
Compartilhar

 Permalink
Earth Sciences Research Journal
versão impressa ISSN 1794-6190
Earth Sci. Res. J. vol.18 no.1 Bogotá jan./jun. 2014
https://doi.org/10.15446/esrj.v18n1.36056
http://dx.doi.org/10.15446/esrj.v18n1.36056
SIGNAL PROCESSING
Enhancing time resolution by stabilized inverse filter and Q estimated on instantaneous spectra
Álvaro Corrales1, Francisco Cabrera2, Luis Montes3
1. Delta State University, Nigeria. Email: etunimogala@yahoo.com
2. Universidad de Pamplona, Departamento de Física, Pamplona, Norte de Santander-Colombia. Email: fcabrera61@yahoo.com.br
3. Universidad Nacional de Colombia, Departamento de Geociencias, of 326, Bogotá. Colombia. Email: lamontesv@unal.edu.co
Record
Manuscript received: 17/12/2012 Accepted for publication: 29/04/2014
ABSTRACT
Physical phenomena, such as attenuation of high frequency components and velocity dispersion, deteriorate seismic images. To enhance seismic resolution, Q filtering is usually applied, where the accurate estimation of Q is the core of this approach. The Matching Pursuit (MP) approach is an instantaneous spectral analysis method that overcomes windowing problems caused by decomposing a seismic trace, providing a frequency spectrum for each time sample of the trace. By changing variables, the spectra is transformed into a new domain where Q is accurately measured. This value is input to a stable inverse Q filter, which solely compensates for the amplitude without distorting the phase, and as a result, an improved time-resolution image is obtained. MP, windowed Fourier (WF), and Gabor transforms (GT) were tested on synthetic seismograms providing Q values that indicated the best performance of MP. Applied to a migrated offshore Colombian seismic line, the entire procedure coded in Matlab compensated for the energy losses and increased the S/N ratio. The trace-by-trace approach guarantees the reliability of the improvement in the continuity of seismic events and is applicable to pre-stack data as well.
Key words: Inverse filter, quality factor, spectral analysis, instantaneous spectrum, attenuation.
RESUMEN
Los fenómenos físicos de atenuación de los componentes de alta frecuencia y dispersión por velocidad de fase deterioran la imagen sísmica. Para incrementar la resolución sísmica usualmente se aplican filtros Q inversos, por lo que la estimación precisa del factor de calidad Q es el problema central de este método. El "Matching Pursuit" (MP) es un método de análisis espectral instantáneo que supera los problemas generados al usar ventanas para descomponer una traza, generando un espectro de frecuencia por cada muestra de la traza. Mediante un cambio de variables el espectro se transforma a un nuevo dominio donde se estima Q con precisión. Éste valor se alimenta a un filtro Q inverso estabilizado, el cual compensa solamente la amplitud sin distorsionar la fase obteniendo como resultado se logra una imagen con mejor resolución. Los métodos de MP, transformada de Fourier con ventanas y transformada de Gabor se ensayaron con datos sintéticos suministrando valores de Q que señalaban el mejor desempeño de MP. El proceso completo fue codificado en Matlab y aplicado a una sección marina Colombiana migrada, compensando la perdida de energía e incrementando la relación señal/ruido. El enfoque de traza por traza garantiza la confianza en el realce de la continuidad de los eventos sísmicos, siendo aplicable a datos pre-apilados.
Palabras clave: Filtro inverso, factor de calidad, análisis espectral, espectro instantáneo, atenuación.
Introduction
A seismic wave that propagates in inelastic media is transformed attenuating its amplitude due to frequency-dependent absorption and delaying its phase due to different phase velocities. Many approaches have been applied to increase time resolution using spectral inversion (Castaño et al., 2011) or by spectral blueing with relative success (Kazemeini at al., 2010). On the other hand, the quality factor Q quantifies the attenuation as the percentage of energy lost in a cycle at a certain frequency (Kjartansson, 1979), and methods to apply inverse Q filtering have been developed and applied to seismic data (Margrave, 1998; Wang, 2002), and their performances compared (Montana and Margrave, 2005). The spectral ratio method (SRM) is the most common approach used to calculate the interval attenuation factor. Initially, it was widely used to estimate attenuation in acoustic VSP data, and recently in shear VSP data (Chuandong & Stewart, 2006). In addition, new methodologies have been implemented to calculate P-wave and S-wave attenuation (Qp and Qs) from standard well log data, relating these to the presence of oil or natural gas (Walls et al., 2006). It is known that attenuation in seismic data is related to gas-bearing reservoirs, which can cause significant changes in seismic amplitude with offset providing erroneous AVO results in deep targets. In this case, attenuation is a valuable alternative tool as a direct indicator of hydrocarbons (Kumar et al, 2003). Seismic attenuation has been used to distinguish changes in spectra in order to detect the presence of fluids and fractures in rocks (Ramirez-Cruz et al., 2005).
Therefore, a stable inverse Q filter might compensate attenuation in seismic data if a reliable pseudo Q log was available, otherwise trying to recover amplitude spectra and correct phase spectra by Q filtering could lead to possible artifacts on seismic data. The stable inverse Q filter must achieve the previous goals without boosting ambient noise and increasing S/N ratio.
The accurate determination of Q may provide a more accurate Amplitude-offset analysis and reliable seismic inversion for reservoir characterization. Therefore, the accurate estimation of Q is a core challenge to overcome before applying inverse Q filtering, considering that Q does not depend linearly on frequency (Kolsky, 1956). The robustness of Q estimation through transforms that use fixed and variable time-frequency windows have been analyzed, pointing out that the precision and accuracy achieved depends on the transform used to supply the spectrum (Reine et al, 2009). The WFT cannot describe signal structures with varying size, because all wavelets have a constant scale that is proportional to the window size, whereas in MP, the signal structures are represented by wavelets that match their time frequency signature (Wang, 2007). In this case, the MPD uses a Morlet wavelet dictionary to decompose a seismic trace into a time-frequency spectrum with a higher resolution than those ones provided by GT and WFT. The matching algorithm is based in Morlet wavelets because they have shown high performance along with computational advantages (Liu & Castagna, 2005).
MP, windowed Fourier (WF) and Gabor transforms (GT) were coded in Matlab and tested on synthetic seismograms, which pointed out the best performance of MP to provide accurate Q logs. The t-ω spectrum supplied by MP is brought by a change of variable, in which Q is calculated using a linear regression. Finally, the estimated Q log is input to a Matlab program that implements the stable inverse Q filtering (Wang, 2006). Applied to a stacked offshore Colombian seismic line, the above two applications corrected the wavelet distortion, compensated the energy losses, and increased the S/N ratio. The trace-by-trace approach guarantees the reliability of the improvement in continuity of seismic events, being applicable to pre-stack data as well.
Attenuation
According to Kolsky´s model (1956) a plane wave travels in a viscoelastic medium with wave number k(ω) = ω ⁄ v(ω) - iα (ω) that includes an attenuation factor α(ω)=|ω| ⁄ ((2v(ω)Q(ω)) and phase velocity v(ω) that depend linearly with ω frequency.
When ω is much greater than ωr (an arbitrarily low reference frequency), the following expression becomes true

Notwithstanding, this model does not satisfy the minimum delay condition of dispersive medium, rigorously stated by the Kramers-Krönig relation. To correct phase distortions, and considering the narrow seismic broadband, equation 1 is rewritten as (Wang and Guo, 2004).
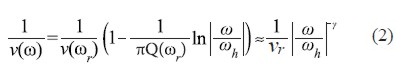
Here, ωh is the maximum frequency of the seismic broadband and γ = (1/π) Qr
Equation 2 leads to
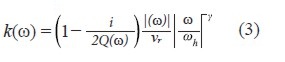
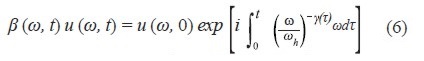
Hence, wave equation ( ∂u (ω, r) ⁄ ∂r −ik(ω)u(ω, r) = 0 admits as a solution
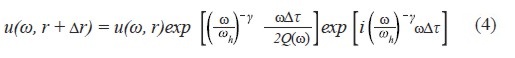
The first exponential compensates for the amplitude spectra, and the second one the k(ω) phase spectra, and downward after continuing from the surface t = 0 to t
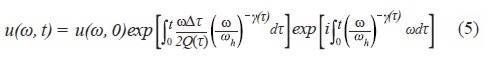
In consequence
where 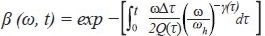
Equation 5 can be solved like an inversion problem with a stabilization factor o introduced through
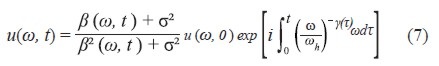
The final solution is obtained by integrating equation 13 along the broadband
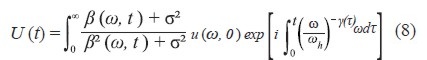
For a horizontal-layer model, the interval quality factor of the nth-layer and the average quality factor of n layers have a cumulative relation given by:

With the above equation, Qn is estimated where Tn and Tn-1 are the times where the average quality factors <Q>n and <Q>n-1 are measured.
Matching Pursuit decomposition
The MP algorithm (Mallat and Zhang, 1993) decomposes a signal into a linear superposition of wavelets selected from a redundant functions dictionary. The dictionary is built with previously calculated wavelets that are estimated and chosen because of their best fitting of the seismic trace. A time-frequency wavelet family is generated by scaling, translating, and modulating a continuous window function m(t) ∈ L2 (R) such that ‖m‖ = 1,m(0) ≠ 0, ∫ m(t)dt ≠ 0 defined by
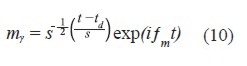
With scale factor s, modulating frequency ƒm and translation td. Due to m(t) being even mᵧ is centered at the td abscissa concentrating the energy in the vicinity of td. By Fourier transforming equation 10 becomes
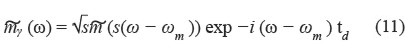
Where,  (ω) is the Fourier transform of m(t) with its energy concentrated around ƒm. Henceforth a trace x(t) might be expressed by a linear combination of wavelets mᵧ which belong to the redundant mᵧ -family dictionary.
The Morlet wavelet was selected due to its best fit of the seismic wavelets and may include quantitative attenuation and dispersion (Wang & Pann, 1996). In each step, the MP algorithm looks for the wavelet that provides most energy to the signal and removes this energy from the signal. The energy of the signal is iteratively reduced until reaching the threshold energy previously established the remainder energy is considered noise.
Methodology and results
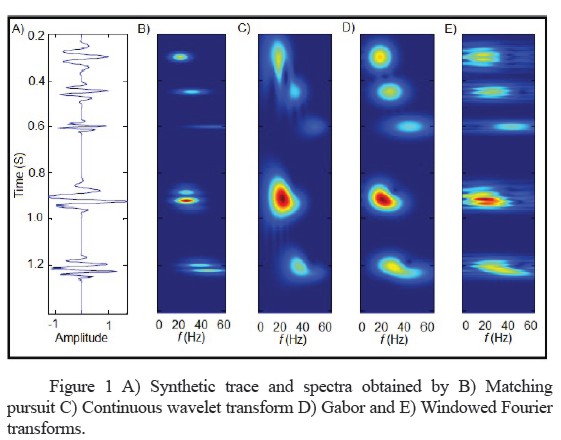
A synthetic seismogram was created by superposing three traces. The first trace by convolving a 0°- 20 Hz Morlet wavelet with 1 and -1 reflection coefficients at 0.3 and 0.9 S, the second by convolving a 45°- 30 Hz Morlet with 1, 1 and 1 reflection coefficients at 0.45, 0.93 and 1.2 S, and the third by convolving a 90°- 50 Hz Morlet with 1 and -1 reflection coefficients at 0.6 and 1.23 S. In figure 1A, three Morlet wavelets at 0.3, 0.45 and 0.6 S are clearly separated, and also two wavelets at approximately 0.9 and 1.2 S where it is hard to discern the two close events, at 0.9 and 0.93 S, and 1.2 and 1.23 S. To compare the performances of Matching Pursuit (MP), Continuous wavelet (CW), Gabor (G) and windowed Fourier (WF) transforms, the synthetic seismogram was spectrally decomposed by the four methods. The supplied MP, CW, WF and G spectra are shown in figures 1B, 1C, 1D and 1E. As a result, the 20, 30 and 50 Hz bandwidths are best defined in the MP spectrum, besides a better time resolution of the reflectors at 0.3, 0.45, 0.6, 0.9, 0.93, 1.2 and 1.23 S. On the other hand, the WF spectrum strongly depicts Gibbs phenomena as a consequence of the windowed effects, even at 0.3, 0.45 and 0.6 S.
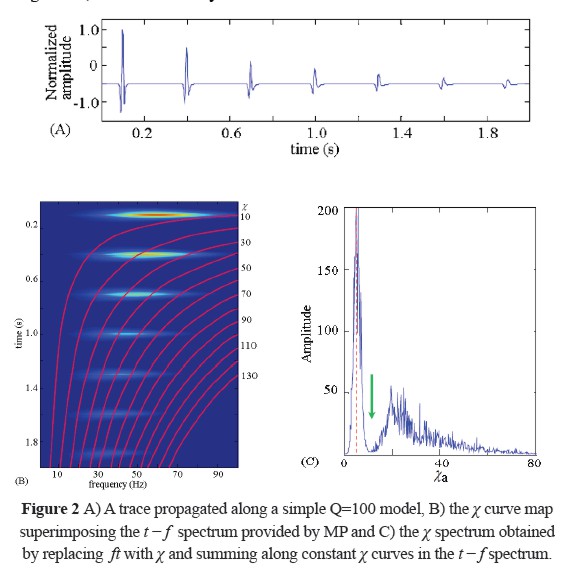
Next, a blocky model with Q = 100 constant in depth was made, along which a plane wave traveling generates the attenuated synthetic seismogram of Figure 2A. This seismogram was MP decomposed, providing the t-ω spectrum shown in Figure 2B.
Considering exclusively the attenuation phenomena, the wave amplitude decays as
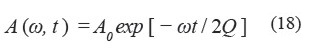
A0 is the highest amplitude. Equation 18 is equivalent to
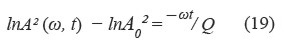
By replacing ωt by the new variable χ the equation 19 turns into
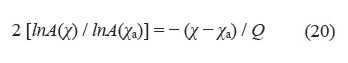
χₐ is associated with the highest energy value in the new χ −spectrum, on which amplitudes decrease along the χ axis with a slope equal to Q-1 . A map of isovalue χ-curves over the t-ω spectrum is shown in Figure 2B. The amplitudes along each χ curve are summed and associated to A (χ) in the χ spectrum, as shown in Figure 2C. As a clarification, the abscissa of Figure 2B represents frequency (Hz) and not angular frequency (ω) and χ represents ft instead of ωt, so the χ =10 curve cuts the abscissa at 2.0 S and 5 Hz and achieves 100 Hz at 0.1 S. So henceforth, the χ abscissa, as in the case of Figure 2C, must be scaled by a factor of 2π.
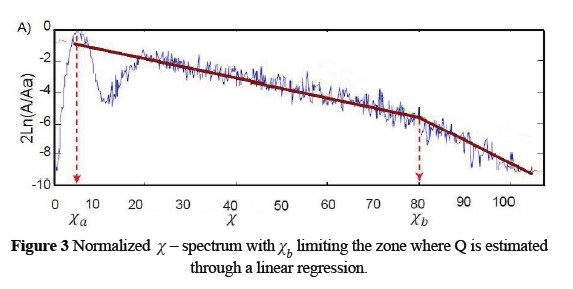
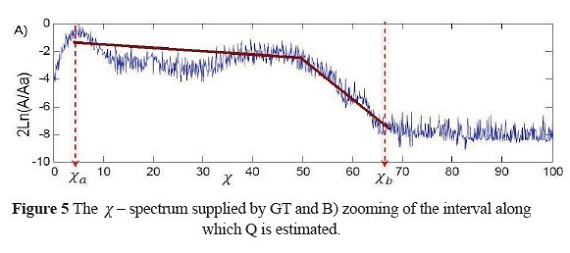
The maximum amplitude in the spectrum of Figure 2C is set to χ0 = 4. Ahead of the highest peak of the χ spectrum, a very low amplitude zone around χ =10 is observed, which agrees with the low energy content in the vicinity of the χ =10 curve as is shown by the t−ω spectrum of Figure 2B. The χ spectrum is normalized in a new one, see Figure 3, where all values are negative and with the highest value around χ =5. The slope is steepest after χb = 80, a value that defines the superior limit of the interval along which Q is estimated. Tiny values after χb = 80, are rejected because they are associated to numerical noise observed in Figure 2C. A linear regression provided a value of 16.1 for the inverse of the slope that scaled by 2π gives a Q value of 101.16, which is close to 100.
The same seismogram was decomposed by WFT and GT supplying the respective χ spectra, observed in Figures 4 and 5. WFT and GT χ spectra depict a similar pattern that differs from the MP χ spectrum. In both new spectra, the low amplitude zone around χ =10 is not observed, and instead is full of spurious amplitudes. In addition, the absence of a linear decreasing trend in both spectra increases the uncertainty to estimate Q. In an attempt to estimate Q, some χ values were excluded to achieve a linear trend. In the WFT case, a Q value of 193.9 was obtained, and in the GT case a value of 134, both considered very inaccurate.

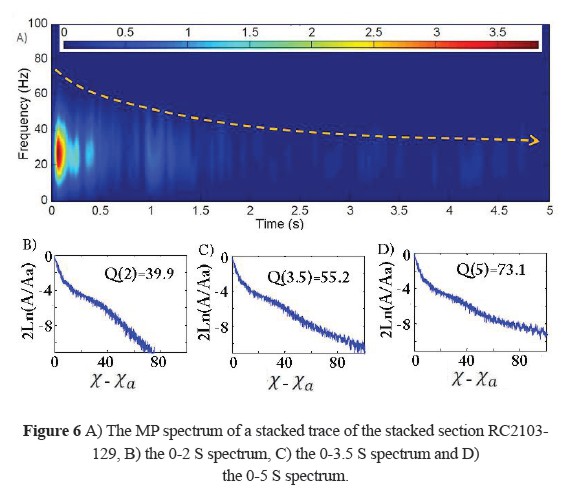
The preceding procedure was applied to the migrated offshore section RC2103-129 of the Caribbean Colombia basin, formed by a siliciclastic Neogene sequence that overlays a carbonate and siliciclastic Paleogene sequence. A trace of this section was decomposed by MP, and its spectrum shown in Figure 6A. The 0-2S, 0-3.5 S and 0-5 S intervals were considered to estimate their associated average quality factors. Their respective χ - spectra are shown in figures 6B, 6C and 6D, on which linear regressions provided ‹Q› values of 39.9, 55.2 and 73.1, respectively. Using equation 9, interval Q values of 39.9, 113.5 and 296.3 related to the 0-2S, 2-3.5 and 3.5-5S intervals were obtained, with these values being in agreement with Q measurements reported for this lithology.
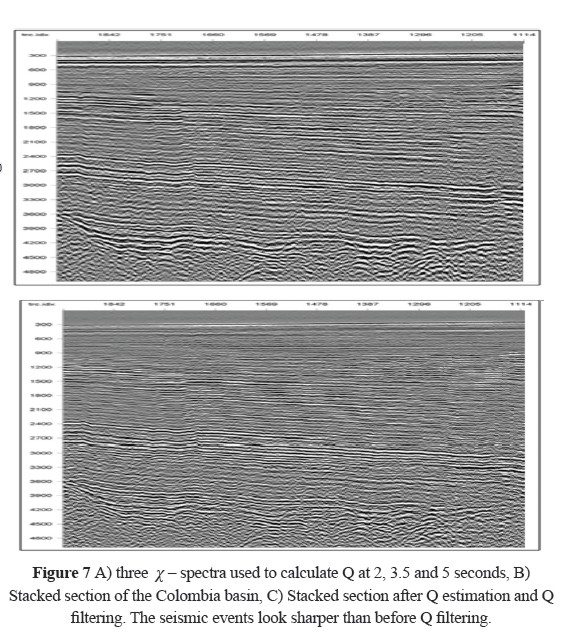
Next, Q values were estimated at 0.5, 1.5, 2.5, 3.0, 3.5, and 4.5 seconds in the migrated section, and in order to consider the Q lateral changes it was estimated in positions separated forty CDPs. The final Q model was achieved by smoothing laterally the obtained attenuation factors. An inverse Q-filter was developed and implemented in Matlab, which includes a stabilization factor σ compensating for the amplitudes according to equation 13. The filter was applied to the above section, and as a result, a higher resolution image was achieved, as observed in Figure 7B. The seismic events in the Q filtered image look sharper, with a better lateral continuity than those in the former section and are reliable due to the trace by trace approach of the applied inverse Q filter. An area, from 1000 to 1300 ms and between the CDPs 1870 and 1890, was selected to observe the Q-filtering performance.
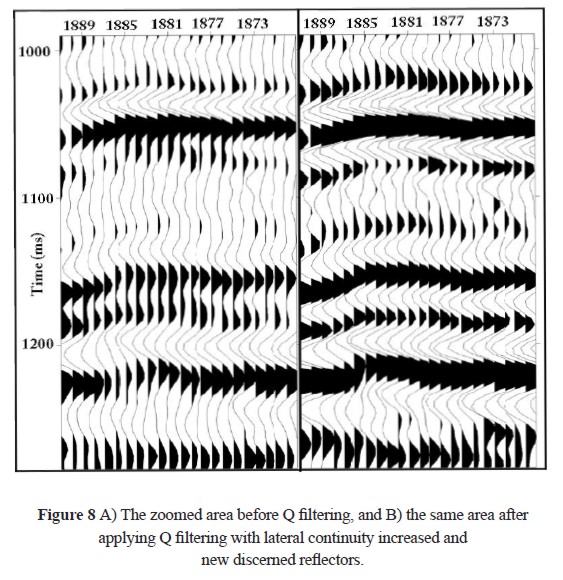
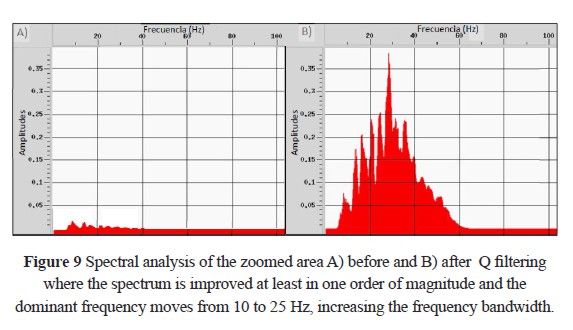
Figures 8A and 8B show the zoomed areas before and after applying the inverse filter. The seismic events between 1050-1100 ms and 1150-1200 ms look clearly separated after Q inversion, whereas the weak event between 1100-1150 ms becomes stronger with an observable lateral continuity not visible before. After Q filtering, the image depicts higher amplitudes and better lateral continuity than before Q filtering. A spectral analysis was performed in the limited area. Figures 9A and 9B show the amplitude's spectra before and after applying the Q filter. After Q filtering, the spectrum increased in one order of magnitude, and the dominant amplitude moved from 10 Hz in the stacked section, to 28 Hz. Moreover, frequency content above 30 Hz was recovered increasing the frequency bandwidth.
Conclusions
Q filters, which are widely used to recover seismic frequency bandwidth, may create artifacts in seismic images due to phase distortions, so to increase S/N ratio, an inverse Q filter that compensates for the amplitude spectrum without introducing phase distortion was implemented. Therefore, the strict use of the Q filter implies an accurate estimation of the quality factor. To accomplish this, Q must be estimated on the instantaneous spectra provided by different methods. The attenuation factors are estimated in a normalized spectrum making the achieved value reliable. Spectral decompositions supplied by Matching Pursuit, windowed Fourier, and Gabor transforms were compared, and the analysis of the estimated attenuation factors noted the high performance achieved by the Matching Pursuit method. Applied to a stacked offshore seismic line off the Colombia basin, the inverse Q filtering provided an enhanced image, where the reflectors depict sharp reflectors with better continuity than the stacked image. A zoomed zone of the inverted image showed separated events, not clearly seen in the stacked section. An analysis of the spectra before and after inversion indicated a one-order increase in the amplitude scale, and the increase of the frequency bandwidth. The trace-by-trace approach makes the method suitable to pre-stack inversion. All the decomposition methods and Q filter algorithms were specially implemented for this research.
Acknowledgements
The authors wish to thank the Institute of Geophysics - University of Houston for permission to use the Seismic Data of the project Southern Margin of the Caribbean, and also Universidad Nacional de Colombia for the support given.
Bibliography
Castaño, K., Ojeda, G., & Montes, L., 2011, Thin-layer detection using spectral inversion and a genetic algorithm. Earth Sci. Res. J., 15, 121-128. [ Links ]
Hargreaves, N., 1998, Theory of nonstationary linear filtering in the Fourier domain with applications to time-varyiant filtering: Geophysics, 63, 244-259. [ Links ]
Kjartansson E., 1979, Constant Q wave propagation and attenuation, J. Geophysics. Res., 84, 4737-4748. [ Links ]
Kazemeini S., Yang C., Juhlin C., & Formel S., 2010, Enhancing seismic data resolution using the prestack blueing technique: An example from the Ketzin CO2 injection site, Germany. Geophysics 75, 101-110. [ Links ]
Kolsky H, 1956, The propagation of stress pulses in viscoelastic solids: philosophical Magazine, 1, 693710. [ Links ]
Kumar, G. Batzle, M. & Hofmann, R., 2003, Effects of fluids on the attenuation of elastic waves. Expanded Abstracts, 73st. Annual International Meeting, Society of Exploration Geophysicists, pp. 1592-1595. [ Links ]
Liu J., and Marfurt K., 2005, Matching pursuit decomposition using Morlet wavelets: SEG/Houston 2005 Annual Meeting. 786-789. [ Links ]
Mallat S., and Zhang Z., 1993, Matching pursuit with time-frequency dictionaries: IEEE Transactions on Signal Processing, 41, 3397-3415. [ Links ]
Montana C., Margrave G., 2005, Comparing three methods for inverse Q filtering, CREWES NEWS, Volume 16, No. 4-5 Apr-May 2005. [ Links ]
Ramirez-Cruz L., Vale-Garcia R., Urrutia J., 2005, Enhanced oil production in a mature field assisted by spectral attenuation analysis, J. Geophys. Eng, 2, 48-53. [ Links ]
Reine, C., Van der Baan M., and Clark R., 2009, The robustness of seismic attenuation measurements using fixed- and variable-window time-frequency transforms: Geophysics, 74, 123-135. [ Links ]
Wang, Y., 2002, A stable and efficient approach of inverse Q-filtering: Geophysics, 67, 657-663. [ Links ]
Wang Y. 2006, Inverse Q-filter for seismic resolution enhancement: Geophysics, 71, V651-V660. [ Links ]
Wang Y., 2007, Seismic time-frequency spectral decomposition by matching pursuit: Geophysics: 72, V13-V20. [ Links ]
