


Services on Demand
Journal
Article
 English (pdf)
 Article in xml format
 Article references
 Send this article by e-mail
Indicators
-
 Cited by SciELO
 -
 Access statistics
Related links
-
 Cited by Google
 -
 Similars in
SciELO
Similars in
SciELO -
 Similars in Google
Share

 Permalink
Earth Sciences Research Journal
Print version ISSN 1794-6190
Earth Sci. Res. J. vol.18 no.2 Bogotá July/Dec. 2014
http://dx.doi.org/10.15446/esrj.v18n2.41083
Severity Classification of a Seismic Event based on the Magnitude-Distance Ratio Using Only One Seismological Station
Luis H. Ochoa, Luis F. Niño, Carlos A. Vargas
Record
Manuscript received: 06/12/2013 Accepted for publication: 05/09/2014
ABSTRACT
Seismic event characterization is often accomplished using algorithms based only on information received at seismological stations located closest to the particular event, while ignoring historical data received at those stations. These historical data are stored and unseen at this stage. This characterization process can delay the emergency response, costing valuable time in the mitigation of the adverse effects on the affected population. Seismological stations have recorded data during many events that have been characterized by classical methods, and these data can be used as previous "knowledge" to train such stations to recognize patterns. This knowledge can be used to make faster characterizations using only one three-component broadband station by applying bio-inspired algorithms or recently developed stochastic methods, such as kernel methods. We trained a Support Vector Machine (SVM) algorithm with seismograph data recorded by INGEOMINAS's National Seismological Network at a three-component station located near Bogota, Colombia. As input model descriptors, we used the following: (1) the integral of the Fourier transform/power spectrum for each component, divided into 7 windows of 2 seconds and beginning at the P onset time, and (2) the ratio between the calculated logarithm of magnitude (Mb) and epicentral distance. We used 986 events with magnitudes greater than 3 recorded from late 2003 to 2008.
The algorithm classifies events with magnitude-distance ratios (a measure of the severity of possible damage caused by an earthquake) greater than a background value. This value can be used to estimate the magnitude based on a known epicentral distance, which is calculated from the difference between P and S onset times. This rapid (< 20 seconds) magnitude estimate can be used for rapid response strategies.
The results obtained in this work confirm that many hypocentral parameters and a rapid location of a seismic event can be obtained using a few seconds of signal registered at a single station. A cascade scheme of SVMs or other appropriate algorithms can be used to completely classify an event in a very short time with acceptable accuracy using data from only one station.
Key words: Machine learning, seismology, single station, magnitude, distance.
RESUMEN
Los algoritmos de determinación de parámetros hipocentrales empleados en la actualidad, se basan específicamente en la información recibida en las estaciones de monitoreo mas cercanas al epicentro y no tienen en cuenta la valiosa información histórica registrada a lo largo del tiempo en dichas estaciones. Es por esto que los procesos de caracterización toman varios minutos, tiempo precioso que podría ser de gran utilidad en la generación de alertas tempranas que permitan una oportuna reacción ante el evento. El registro de información, a lo largo el tiempo, de sismos ocurridos en los alrededores de la estación, puede ser empleada para dotarla de algún grado de experiencia que le permita, mediante detección y clasificación de patrones, realizar una caracterización previa mucho mas rápida, mediante el empleo de técnicas modernas las cuales pueden ser algoritmos bio-inspirados o métodos estocásticos mas recientes conocidos como métodos Kernel. En el presente trabajo se emplea un método conocido como Maquinas de Soporte Vectorial (MSV), entrenando dicho algoritmo con información de la relación del área bajo la curva de la potencia de la transformada de Fourier de las componentes N-S, E-W y Vertical, calculada para 5 ventanas de 2 segundos, desde la onda p, de 123 sismos de magnitud superior a 3, desde 2004 hasta 2008, alrededor de la estación El Rosal, de la Red Sismológica Nacional de Ingeominas. El Algoritmo clasifica sismos que superen un umbral predeterminado de la relación entre el Logaritmo de la magnitud y la distancia, que refleja, de alguna manera, la intensidad del sismo. Con la obtención de este parámetroá posible conocer la magnitud del evento, debido a que la distancia puede ser calculada, con base en picado de la onda S, y de esta manera establecer una aproximación rápida de la magnitud en un tiempo aproximado de 20 segundos después del evento. Los resultados obtenidos permiten confirmar que con poco tiempo se señal en una sola estación sismológica es posible obtener información confiable para ser empleada en alertas tempranas.
Palabras clave: Aprendizaje de máquina, sismología, una estación, magnitud, distancia.
1 Introduction
Seismic activity is a natural phenomenon with enormous and uncontrollable power, and damage in populated areas can impede appropriate responses when earthquakes occur.
Recent developments have allowed efficient and alternative solutions inspired by natural and biological processes that have been converted to stochastic models and have been used in seismology with acceptable results.
When an earthquake is detected, seismologists determine its main features, such as magnitude, hypocenter coordinates, fault mechanisms, etc., to help authorities respond appropriately and allow scientists to study the Earth internal structures. Seismometers are distributed across an area of interest, many with three-component broadband sensors that detect, at the same point, movement in three mutual, orthogonal directions (North-South, East-West and up-down). These stations transmit information in near real time to seismological centers.
The traditional characterization of earthquakes takes a few minutes, depending on the degree of automatization, network density and the number of stations involved in the process. Earthquakes usually must be detected by at least five stations, and features such as compressive (P) and shear (S) wave arrival times are determined by expert analysis or an automatic algorithm. Subsequently, the hypocenter coordinates can be calculated. In Colombia, an institute called INGEOMINAS can obtain seismic event localization in approximately 8 minutes due largely to the low-density network. In some seismological centers with many stations, this time can be reduced by half because earthquake energy requires additional time to arrive at stations farther away from the hypocenter. However, we are mostly interested in earthquakes occurring near population centers, where seismic energy can arrive in tenths of a second, making warning impossible.
Long processing times are associated with conventional methods that are based on information related only to the particular event and that ignore valuable previously collected historical information.
Therefore, new alternatives must be explored to reduce the processing time and allow rapid generation of warnings. The main purpose of this study is to use historical information from only one station to detect patterns correlated with known event features available from very accurate, traditional processing.
2 Problem definition
Colombia has a central seismological network, managed by INGEOMINAS, and local networks located in certain cities, such as Armenia (Quindio) and Cali (Valle). It is important to develop a system based on these valuable resources to discover patterns that will allow more rapid seismic early warnings. Recent developments in Computational Intelligence (CI) techniques allow this goal to be achieved by solving certain seismological problems in near real time.
The automatic detection and discrimination of different events recorded with a seismometer, including seismic and non-seismic signals, using CI have been achieved using Artificial Neural Networks (ANNs) in many cases around the world. ANNs use a probe that is an excellent pattern recognition tool. ANNs were created to reproduce the mechanisms of human reasoning and allow discrimination of signals to simulate the brain processing of the operator. It is an efficient processing strategy for solving seismic signal discrimination problems, in which multiple hypotheses must be controlled in parallel, the number of input parameters is large and a well-defined solution is not always well known.
The onset time determination is usually the first step to locating the hypocenter of an event. The first arrival of a P wave can be compressive or tensile, which is key to determining the focal mechanism. Interactions between body waves and changes in the mechanical properties of rocks at strata interfaces generate diffraction and reflection phenomena, generating new body waves. These new onsets can provide clues to the distribution of strata in the subsurface, and these clues can then be used as seismic tomography data to determine the Earth's internal structure. The automatic detection of P waves can be accomplished using comparison algorithms, such as the one reported by Allen 1978, who developed an application to determine P wave onset by comparing discrete signal parameters. The P onset is present where the short-term average (STA) of the signal increases abruptly with respect to the long-term average (LTA). Later, Allen 1982 established that technological development will lead to more efficient S wave detection through the use of a signal-in-frequency domain. Baer and Kradolfer, 1987, developed an improved methodology based on signal processing. The complexity of the S wave onset requires alternative methods to achieve better solutions. Cichowicz, 1993, developed an algorithm that identifies the S wave onset using three-component seismometers in local networks.
Recently, a neural network approach has been proposed to solve this problem because many simultaneous parameters can be included and the approach is easy to implement and flexible. It is also not necessary to be proficient with the interactions of the analyzed variables. Wang and Teng, 1997, applied a Back Propagation Neural Network (BPNN). Dai and McBeth, 1997, implemented a BPNN to identify and detect P and S waves from three-component recordings of local earthquake data. Two years later, Zhao and Takano, 1999, used BPNNs for P wave detection by combining three BPNN detectors (long, mid and short term). Aldersons, 2004, developed a system (MannekenPix) that automatically detects the phase of a wave. This program is based on a weighting mechanism calibrated with reference detections and weights provided by the user; in other words, it is a learning process that uses examples and statistical techniques to separate groups by criteria similitude. This approach is a linear combination of predictors to maximize differences among groups, while minimizing differences within groups. Di Stefano et al. 2005 applied this algorithm to achieve precise phase detection using Pg, Pn and their polarities. These authors demonstrate that such data are suitable for high-precision earthquake location, focal mechanism determination and high-resolution seismic tomography.
Once signal spectral characterization is complete and arrival times for P and S signals are determined, it is possible to generate the subsurface structure. This issue has been resolved using Computational Intelligence techniques, such as Genetic Algorithms (GAs) and Simulated Annealing (SA). A good subsurface structural model is an important step for calculating the focal parameters of seismic events. The high model combination rates obtained with GA can perform a very wide exploration of the solution's space, and this computation alternative is preferred when solving this kind of problem.
Bhattacharyya et al. 1999, analyzed regional seismograms using a GA to determine crustal structure in a four-layered crustal model of the eastern Great Basin and western Colorado plateau, in which the optimizing variables were thickness and P-wave velocity. The resulting model agreed well with results reported in several geological publications.
Chang et al. 2004, implemented a GA and modeled crustal structure in southern Korea using teleseismic P-wave receiver function data and Rayleigh-wave phase velocity measurements. The genotype describes the distribution of wave velocities and is determined using 40 1-km-thick layers. Lawrence and Wiens, 2004, combined the inversion of body wave receiver functions and Rayleigh wave phase velocities using a Niching Genetic Algorithm (NGA). Using non-unique inversion models, it is possible to explore many solutions to problems associated with the determination of focal parameters. Pezeshk and Zarrabi, 2005, developed an inversion procedure for spectral analysis of surface waves (SASW) using a Genetic Algorithm.
Kim et al. 2006, proposed a method for determining hypocentral parameters for local earthquakes in 1-D using Genetic Algorithms and two-point ray tracing, which calculates seismic ray trajectories that cross a known velocity structure. In this case, the velocity structure is not known, but the arrival times at different stations are available. With GA, it is possible to explore many subsurface velocity distributions, and a comparison between the calculated and observed arrival times can be a useful fitness selection function. Assimaki and Steidl, 2007, used a hybrid algorithm that combined a genetic algorithm with a local least-squares fit operator for inversion of weak and strong motion among an array of data obtained during the Mw 7.0 Sanriku-Minami earthquake. This combination accelerates the convergence of the GA by improving the parental population with the local hill-climbing operator.
Many of the processes mentioned above can be described by Computational Intelligence tools, which must be designed, or trained, for particular geological, environmental and structural settings. Additionally, these techniques can be applied to function in near real time by processing information at the seismological center or directly in the sensor using electronic devices with embedded models. These devices are faster and can transmit processed information via parallel link, requiring fewer resources for transmission.
However, these processing tasks only use information transmitted from current seismic activity registered by the nearest stations. The processing takes approximately 5 to 10 minutes, which does not allow for early warnings and alerts. More stations can be used to determine seismic source magnitude and location, but more time is needed for processing; thus, less time is be available for reaction.
The generation of early warnings depends on extracting the most accurate and reliable magnitude and location values using the fastest signal time. New data-driven pattern analysis models (e.g., kernel methods) with solid statistical foundations have been applied to classification and regression issues. These pattern analysis models apply historical data available in seismological databases to determine signal features (descriptors) and relationships between signal features and previously processed results. The descriptors and their relationships with previously processed results can be used to "train" certain simple algorithms, which can be used to process new data more rapidly.
Here, we present the first results obtained from a single three-component seismic station with our rapid and accurate characterization of a seismic event using only a few seconds of signal following the P wave onset. This station is near the source, where energy does not saturate the data, and uses Support Vector Machine models to obtain a Magnitude-Distance ratio from 14 seconds of signal.
3 Data set description
The data set used in this research was obtained from INGEOMINAS's National Seismological Network. We have waveform files and calculated data from approximately 45,000 registered seismic events from 1993 to mid-2008. We selected 130 of the events registered at the "EL ROSAL" station that had magnitudes (Mb) greater than 2.1 and epicentral distances less than 120 kilometers. This station has digital, three-component broadband seismometers and is located near Bogota, which is vulnerable to medium- or high-magnitude events. This research is proposed as a first step to developing a reliable early warning system for the city. Only events registered after late 2003 were used because the three-component station data were not available prior to this time. The location of selected events is presented in Fig. 1, in which symbol size is proportional to event magnitude.
4 Methodology
One of the most important steps in Kernel Method Processing is to determine the best "descriptors" to be used as input variables for the model. These descriptors are the key to obtaining good correlations with desired output, and the selection of descriptors depends on the type of information available for processing. In this case, we have time signals, which have certain characteristic features that can be described by signal transformations, such as Fourier transform and others.
-
Fourier transform was applied to each of the three components of the signal, starting at the P wave onset.
-
This transform was divided into 2-second windows (80 samples).
-
The integral of the squared frequency spectrum was calculated for each window, which generated one value for a given two-second partition.
-
Finally, the ratios between the values of each component calculated in the step above are the input descriptors of the model and are calculated as follows:

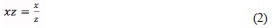
where x, y and z are the values of the squared Fourier Transform integral at each x, y, and z component registered at the seismological station.
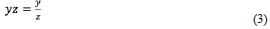
These descriptors are used in our classification model as input variables. An output value is needed to separate the two classes that represent, in some way, the severity of a given earthquake's effects at the station site. The effects of an earthquake at any place depend directly on magnitude and inversely on epicentral distance. A ratio between the logarithm of magnitude and epicentral distance is proposed here as a classifier based upon the following equation:
where M is body wave magnitude and D is epicentral distance, based on reports processed by INGEOMINAS for each seismic event. The physical context of this classifier variable is related to the energy that an earthquake has when it reaches the seismic station; very near events with low magnitudes are perceived to be similar to distant events with high magnitudes. Higher classifier values are obtained for high-magnitude earthquakes occurring close to the station. To achieve a balance between the number of events over and under a background limit, a value of 0.5 was determined to be the classification limit.
With calculated descriptors and the information available for the classification variable, an SVM was trained to find the optimal separator hyperplane that discriminates the events corresponding to classes A and B.
Appendix I includes the events used in the model and the calculated severity values from known magnitudes and distances, as well as the predicted SVM model.
5 Classifier evaluation
A machine learning classifier performance depends entirely on the data used for training, validation and testing. Therefore, the method's evaluation must consider answers to certain questions about the data, such as 'Do we have enough training data to represent the model?'; o we have balanced training data for each considered class?'; 'What is the effect of re-using data 'Din the training sets?'; etc.
To answer these questions, the algorithms and data used in this research were evaluated using 10-Fold Cross Validation techniques, and the results are summarized below.
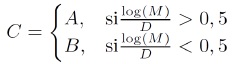
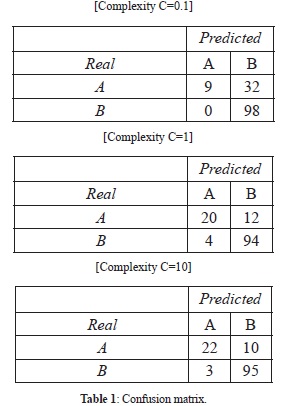
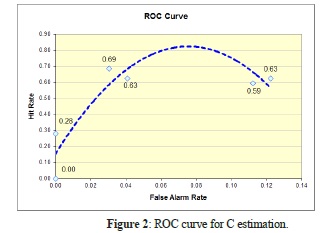
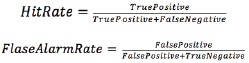
Table 1 shows the results from the determination algorithm of the meta parameters, which determine the curve ROC that was used to evaluate the value of C for which the classification model has the best results. Figure 2 shows the curve ROC for multiple values of C, achieving the best value as a compromise between hits and false alarms. Similar curves were generated to locate other parameters, such as the degree of polynomial function used for mapping vectors in the feature space. Using this approach, the quadratic kernel was selected as the best mapping function for this problem and dataset. Figure 2 shows the relationship between the numbers of hits and false alarms, which are determined using the following equations:
Wrongly classified events that exceeded the background limit of C, known as "false negatives", are cases where no alarm was generated but a moderate event was imminent. This unique situation indicates that there is a local condition that must be analyzed carefully to determine the area's unique pattern (Figure 3). To increase accuracy and obtain better results, it is necessary to explore other descriptors.
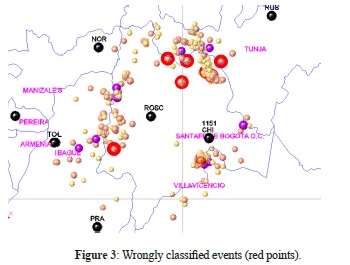
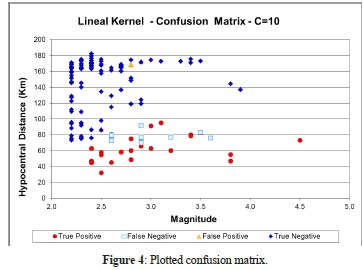
Figure 4 plots the values of the confusion matrix. There is a very good correlation for a severity threshold of 0.5. This result can be used as an initial early warning parameter.
6 Results
Results obtained in this study using the classification methods described above are presented in Tables 2 and 3. Class B events were classified with high accuracy, but Class A events were wrongly classified in 31% of the cases.
Future work will focus on the identification of new descriptors to better characterize the input signal using a priori knowledge. It is possible to implement new strategies using Bagging, which combines many algorithms.
The described algorithm proposes a new classification method for early warning purposes only.
7 Conclusions
-
The structure of the input data is important for classifier behavior and determining relationships within the model. One of main challenges in this work was selecting the best signal descriptors and determining the relationships between them.
-
With a small signal interval processing from only one seismological station, it will be possible to estimate parameters such as magnitude and distance, which will allow the rapid classification of a seismic event based only on the effects at this station.
-
Previous determinations of hypocentral parameters ignore historical data from previous seismic events and instead use only information recorded during current earthquakes. The proposed method uses historical data to calculate a relationship between magnitude and distance and allows rapid warning generation times.
-
The results suggest that it is possible to use the proposed method to calculate other hypocentral parameters, such as hypocenter location, azimuth, distance and others.
-
Improvements to the technique can be accomplished by including a priori information in descriptors calculated from signals and spectral characteristics. These techniques have been used previously as input in some artificial intelligence approaches and resulted in better accuracy and faster processing times.
-
The adjustment results obtained using this approach cannot be compared with conventional strategies because they do not use the same information. This approach is based on a single station, whereas others are based on multiple stations (no fewer than 5).
-
Early detection systems must consider combined strategies to optimize the identification of descriptors that can be used more efficiently in these types of approaches.
References
Allen, R. V. (1978). Automatic earthquake recognition and timing from single traces, Bulletin of the Seismological Society of America. 68, 1521-1532. [ Links ]
Allen, R. V. (1982). Automatic phase pickers: Their present use and future prospects, Bulletin of the Seismological Society of America. 72, S225-S242. [ Links ]
Assimaki, D. and Steidl, J. (2007). Inverse analysis of weak and strong motion downhole array data from the Mw7.0 Sanriku-Minami earthquake, Soil Dynamics and Earthquake engineering. 27, 73-92. [ Links ]
Baer, M. and Kradolfer, U. (1987). An automatic phase picker for local and teleseismic events, Bulletin of the Seismological Society of America. 77, 1437-1445. [ Links ]
Bhattacharyya, J., Sheehan, A. F., Tiampo, K. and Rundle, J. (1999). Using a Genetic algorithm to model broadband regional waveforms for crustal structure in the western United States, Bulletin of the Seismological Society of America. 89, 202-214. [ Links ]
Chang, S., Baag, C. and Langston, C. A. (2004). Joint Analysis of Teleseismic Receiver Functions and Surface Wave Dispersion using the Genetic Algorithm, Bulletin of the Seismological Society of America. 94, 691-704. [ Links ]
Cichowicz, A. (1993). An Automatic S-Phase Picker, Bulletin of the Seismological Society of America. 86, 180-189. [ Links ]
Dai, H. and MacBeth, C. (1997). Application of back-propagation neural networks to identification of seismic arrival types, Physics of the Earth and Planetary Interiors. 101, 177-188. [ Links ]
Del Pezzo, E., Espossito, A., Giudiceprieto, F., Marinaro, M., Martini, M. and Scarpetta, S. (2003). Discrimination of Earthquakes and Underwater Explosions Using Neural Networks, Bulletin of the Seismological Society of America. 93, 215-223. [ Links ]
Di Stefano, R., Aldersons, F., Kissling, E., Baccheshi, P. and Chiarabba, C. (2005). Automatic seismic phase picking and consistent observation error assessment: application to the Italian seismicity, Geophysical Journal International. 165, 121-134. [ Links ]
Dowla, F. U., Taylor, S. R. and Anderson, R. W. (1990). Seismic discrimination with artificial Neural Networks: Preliminary results with regional spectral data, Bulletin of the Seismological Society of America. 80, 1346-1373. [ Links ]
Dysart, P. S. and Pully, J. J. (1990). Regional seismic event classification at the NORESS array: Seismological measurements and the use of trained Neural Networks, Bulletin of the Seismological Society of America. 80, 1910-1933. [ Links ]
Fedorenko, Y. V., Husebye, E. S. and Ruud, B. O. (1999). Explosion site recognition; neural net discriminator using single three-component stations, Physics of the Earth and Planetary Interiors. 113, 131-142. [ Links ]
Kim, W., Hahm, I., Ahn, S. J. and Lim, D. H. (2006). Determining hypocentral parameters for local earthquakes in 1-D using a genetic algorithm, Geophysical Journal International. 166, 590-600. [ Links ]
Lan, J., Nahavandi, S., Lan, T. and Yin, Y. (2005). Recognition of moving ground targets by measuring and processing seismic signal, Measurement. 37. 189-199. [ Links ]
Lawrence, J. F. and Wiens, D. A. (2004). Combined Receiver-Function and Surface Wave Phase-Velocity Inversion Using a Niching Genetic Algorithm: Application to Patagonia, Bulletin of the Seismological Society of America. 94, 977-987. [ Links ]
Muller, S., Garda, P., Muller, J. D., an Cansi, Y. (1999). Seismic events discrimination by neuro-fuzzy merging of signal and catalogue features, Physics and Chemistry of The Earth. 24, 201-206. [ Links ]
Pezeshk, S. and Zarrabi, M. (2005). A New Inversion Procedure for Spectral Analysis of Surface Waves Using a Genetic Algorithm, Bulletin of the Seismological Society of America. 95, 1801-1808. [ Links ]
Romeo, G., Mele, F. and Morelli, A. (1995). Neural networks and discrimination of seismic signals, Computers & Geosciences. 21, 279-288. [ Links ]
Tiira, T. (1996). Discrimination of nuclear explosions and earthquakes from teleseismic distances with a local network of short period seismic stations using artificial neural networks, Physics of the Earth and Planetary Interiors. 97, 247-268. [ Links ]
Tiira, T. (1999). Detecting teleseismic events using artificial neural networks, Computers & Geosciences. 25, 929-938. [ Links ]
Wang, J. and Teng, T. (1995). Artificial Neural Network-based seismic detector, Bulletin of the Seismological Society of America. 85, 308-319. [ Links ]
Wang, J. and Teng, T. (1997). Identification and picking of S phase using an artificial Neural Network, Bulletin of the Seismological Society of America. 85, 1140-1149. [ Links ]
Yamanaka, H. and Ishida, H. (1996). Application of Genetic Algorithms to an inversion of surface-wave dispersion data, Bulletin of the Seismological Society of America. 86, 436-444. [ Links ]
Zadeh, M. A. and Nassery, P. (1999). Application of quadratic neural networks to seismic signal classification, Physics of the Earth and Planetary Interiors. 113, 103-110. [ Links ]
Zhao, Y. and Takano, K. (1999). An artificial Neural Network approach for broadband seismic phase picking. Bulletin of the Seismological Society of America. 89. 670-680. [ Links ]
Zhou, R., Tajima, F., and Stoffa, P. L. (1995). Application of Genetic Algorithms to constrain near-source velocity structure for the 1989 Sichuan earthquakes. Bulletin of the Seismological Society of America. 85. 590-605. [ Links ]
