


Serviços Personalizados
Journal
Artigo
 Inglês (pdf)
 Artigo em XML
 Referências do artigo
 Enviar este artigo por email
Indicadores
-
 Citado por SciELO
 -
 Acessos
Links relacionados
-
 Citado por Google
 -
 Similares em
SciELO
Similares em
SciELO -
 Similares em Google
Compartilhar

 Permalink
Earth Sciences Research Journal
versão impressa ISSN 1794-6190
Earth Sci. Res. J. vol.19 no.1 Bogotá jan./jun. 2015
https://doi.org/10.15446/esrj.v19n1.48357
http://dx.doi.org/10.15446/esrj.v19n1.48357.
APPLIED GEOPHYSICS
Using GIS And Geophysics In Selecting Suitable Basins With Freshwater Aquifers For An Efficient Exploration Strategy - A Case Study From Petra-Region, Jordan
Mohammad Al Farajat1, Bernhard Schaefers2, Hussein Al Hassanat3 Nedal Al Atteyat4, Nidal Al Jahed4, Jamal Khataibeh4
1 AlHussein bin Talal University, email: alfarajat@hotmail.com.
2 Beratende GeoIngenieure GbR (BGI)/Wuerzburg, Germany
3 Petra Development and Tourism Region Authority/Jordan
4 Natural Resources Authority/Jordan
Record
Manuscript received: 18/01/2015 Accepted for publication: 31/03/2015
ABSTRACT
In this study, an effective and time-saving strategy for groundwater exploration in alluvium basins in arid-semiarid lands was applied by integrating GIS and geophysics. Three steps were followed to locate productive local groundwater aquifers prone to annual recharge in the Region of Petra, which covers an area of 800 km². In the first step, geological, structural and geomorphological knowledge was applied to determine the parts of the sedimentary basin having potentials of being local groundwater aquifers. Some locality of the selected area with suitable hydrological conditions for recharge was chosen for an optimization process using GIS. In the second step, the selected locality of the basin was given emphasize on its detailed geology and hydrology to choose suitable locality for applying gravity visualization. Evaluation of this data leads to step number three. Now at localities with promising conditions vertical electrical soundings was applied to enable the authors to determine productive and renewable groundwater aquifers. As it is known that geophysical methods are considered as expensive and time-consuming work, therefore, in this strategy of groundwater surveying a special attention is given to budgets of time, efforts and funds constraints.
Key words:Petra, Baida basin, gravity method, vertical resistivity method, groundwater, survey strategy
RESUMEN
En este estudio se aplicó una estrategia efectiva y eficaz para la exploración de aguas subterráneas en cuencas con depósitos aluviales para terrenos áridos y semiáridos a través de la integración del Sistema de Información Geográfica (GIS, inglés) y herramientas geofísicas. Se siguieron tres pasos para localizar acuíferos locales de aguas subterráneas propensos a las recargas anuales en la región de Petra, que cubre un área de 800 km2. En el primer paso se aplicó el conocimiento teórico para determinar las partes de la cuenca sedimentaria con el potencial de ser un acuífero local de aguas subterráneas. Se escogió una de las localidades del área seleccionada con condiciones hidrológicas apropiadas de recarga para un proceso de optimización con el GIS. En el segundo paso se hizo énfasis en la geología e hidrología detallada de la localidad seleccionada de la cuenca para así escoger un lugar apropiado para la aplicación del método de visualización gravitacional. La evaluación de los datos condujo el estudio al tercer paso. Se realizaron sondeos eléctricos en los lugares con evidencias para permitirle a los autores determinar los depósitos de aguas subterráneas productivos y renovables. Si bien los métodos geofísicos son considerados costosos y demandantes de tiempo, con esta estrategia de exploración de aguas subterráneas se hizo un énfasis especial a los presupuestos de tiempo, esfuerzo y limitaciones de fondos.
Palabras clave:Petra, Cuenca Baida, método gravitacional, método de resistividad vertical, aguas subterráneas, estrategias de exploración.
Introduction:
Geophysical exploration for groundwater is an indirect geological investigation method that was developed over the past century. Active geophysical methods such as resistivity and seismic methods can investigate the succession of the geological layers in mineralogy and thickness, the fact that resistivity can reveal water-saturated layers. Inactive methods like gravity and geomagnetic can map the topography of the bedrock, reveal the thickness of the alluviums above the basement and can assist in delineating the internal structures of the basins. As a result, the majority of the geophysical methods can emphasize on the results of each other. The methods were developed over time according to the equipment, field survey methods and interpretation software, Al Farajat (2008).
Despite the advancement of the means of geophysical technology in the exploration of groundwater, still they consume time, efforts and money; thing emphasizes on that the field surveys should be applied in promising areas. GIS can be used in determining promising areas when the geology and the geomorphology of an area are taken into consideration.
In 2007, Petra was ranked the second wonder of the Seven World Wonders. Since then, Petra region witnessed an accelerating prosperity associated with land use expansion and rapid population growth. Petra has a local population of thirty thousand persons and is visited by around couple thousand international tourists daily. In the summer, tourism boosts cause serious pressure on the drinking water resources. Therefore, in 2009 the central government of Jordan allocated a local authority for Petra "Petra Development and Tourism Region Authority" to develop the region and search for solutions to problems caused by tourism boost, especially on the water supply impact.
The following facts clarify the challenges the water supply faces:
- Jordan was ranked four on the international water poverty index, Salameh (1996).
- The country with predominantly arid climate mainly depends on groundwater resources for its water supply, Ministry of Water and Irrigation of Jordan (2014).
- Some of the groundwater basins were depleted because they are nonrenewable (Salameh, 2001).
- Tourism sector forms one of the most important economic engines in Jordan. About 50,000 persons are working in this industry. In addition, the country's dependent on the tourism sector to secure its needs from hard currencies. However, tourism industry consumes high amounts of water and increases the pressure on the water-supply system.
For abstraction purposes, environmental sustainability of groundwater in dry lands calls for dealing with rechargeable/renewable aquifers as much as possible, Salameh (1996).
To secure more drinking water, especially in the summer session, for the Petra region, which covers an area of 800 km2, it is essential to locate productive local groundwater aquifers prone for recharge. This study used an effective, sustainable strategy for locating productive local groundwater aquifers in alluvial sedimentary basins.
In groundwater hydro-geophysics and in the lands having Mediterranean type of climate (dry, hot summer and cold, wet winter) alluvium basins surrounded by highlands form productive aquifers with good groundwater potentials, Al Farajat and et al (2005). The presence of faults within the beds of the alluviums enhances percolation of rainwater into the depths of the aquifers, Al Farajat (2008).
1.2 Methodology
In this study, three logical phases were followed to locate productive local groundwater aquifers in alluvium sedimentary basins that are prone for recharge in the Petra region:
Phase 1: Geological, structural and geomorphological knowledge will be used in selecting suitable sedimentary basins with potentials for being local groundwater aquifers. A small number of the selected sedimentary basin with appropriate hydrological conditions for recharge will be chosen after running an optimization process by using GIS.
Phase 2: The selected basin will be emphasized on its detailed geologic and hydrologic aspects. Gravity visualization of the chosen part of the sedimentary basin will be implemented.
Phase 3: Parts of the basin with suitable conditions to contain groundwater (concerning to the gravity visualization) will be chosen to locate and apply Vertical Electrical Soundings (VES).
1.3 Literatures review
Near surface geophysics for groundwater exploration is usually limited to depths of less than 250 m under the ground surface. Groundwater applications of near-surface geophysics include mapping the depths and thickness of an aquifer, mapping water migration paths such as fractures, joints, cracks, bedding planes and fault zones, and mapping pollution of the groundwater aquifers.
Geoelectric methods depend on the correlation of the subsurface electrical properties, especially the resistivity (VES) of layers varying extremely with lithology. The vertical resistivity method proved to be a very important method of groundwater prospecting. Coker et al (2009) investigated geophysical potentials of groundwater of Oke-Badan Estate, Ibadan, and Southwestern, Nigeria. In Sweden, Wattanasen & Elming (2008) used this method to detect groundwater. Gowd (2004) used electrical resistivity surveys to delineate groundwater potential aquifers in Peddavanka watershed, Anantapur District in India. Edet & Okereke (2002) and Urish & Frohlich (1990) used the VES method for the same purpose. Babu (1991) used the geomagnetic method to map the topography of the bedrock.
Carmichael et al (1977) used gravity to explore for groundwater and bedrock topography in Glaciated Areas. Bose et al. (1973) used this method to explore groundwater potentials in India.
In Jordan, Al Farajat (2008) modeled the geometry of the southern basin of Aqaba in Jordan to delineate groundwater rich layers, and to determine the topology and structures of the granite basement and the thickness of the alluviums. In the model he built gravity and resistivity methods were used. In 2009, founding on the scientific findings of this article - a study for the suitability of the area of this basin as a location for the proposed Jordanian atomic energy plant took place. Al Farajat (2006) modeled geometrical properties in the southern basin of Aqaba for groundwater potentials, using resistivity method. Al Farajat and et al. (2005) investigated the potentials of groundwater in the alluvium aquifer of Titin basin using gravity and resistivity method. The gravity study led to the conclusion that the basin is an asymmetrical graben and the help of the resistivity method the groundwater rich layers have been found in the deepest limp of the graben with values less than 100 Ω m. Al Farajat et al (2005) investigated the hydrogeophysical and environmental aspects of the groundwater potentials in Al Sokhna Alluvium Aquifer in Zarqa - Jordan. In this study, the gravity method was used to delineate depth to bedrock under the alluviums. Al Farajat et al (2004) delineated the hydrodynamic interface between fresh and seawater in the coasts of Gulf of Aqaba. In a Ph.D. thesis, Al Farajat (2002) studied the hydro geoecosystems in Aqaba coasts and nearby region for topics such as natural settings, impacts of land use, spatial vulnerability to pollution and sustainable management. In the study, Al Farajat modeled and sliced a groundwater aquifer in this coastal city using direct measurements in groundwater wells besides vertical electrical soundings. Al Farajat (2002) in an MS.Sc. Thesis delineated subsurface karstic holes using Winner Array in the northern part of Jordan.
1.4 Study area
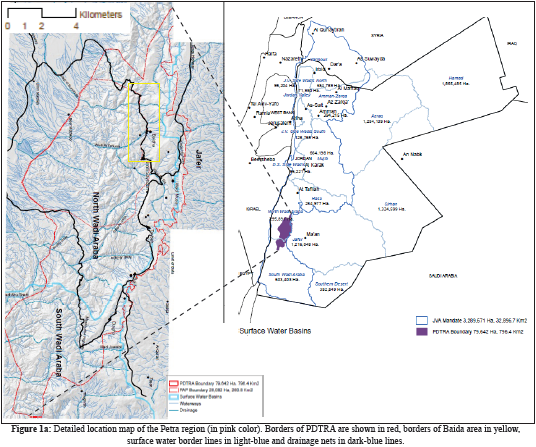
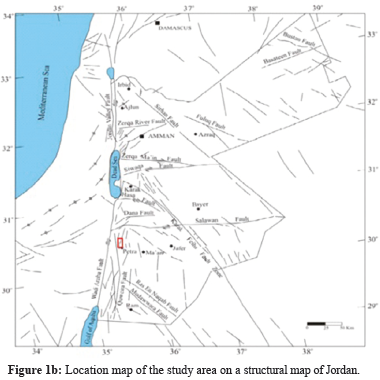
The Petra region is located in the southern part of Jordan, about 280 kilometers to the south of Amman. The study area Wadi Al Baida is located about 8 kilometers to the northeast of Petra Archeological Park (PAP) (Figure 1a). The following coordinates define the center of the area: Easting: 194616, Northing: 975746, while its elevation is around 1100 m. The area overlooks the Dead Sea Valley (central part of the Jordan Valley). The majority of the geologic structures of the area are attributed to the Dead Sea fault (Figure 1b).
2. Optimization of the most promising areas for exploration
To optimize promising areas for groundwater exploration in the Petra Region, geological and surface modeling is necessary to extract the most suitable sites from the region that are characterized by good groundwater potentials and recharge abilities. Consequently, geophysical exploration will be implemented. In the first step, two models were produced using ArcGIS (Figure 2):
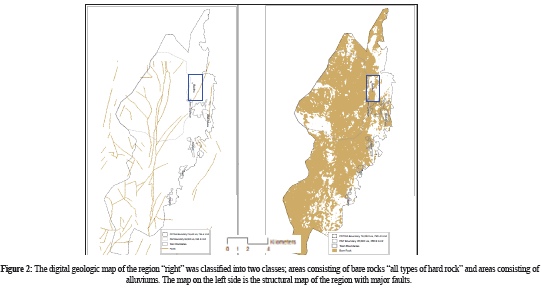
- The digital geologic map of the region was classified into two classes with areas consisting of bare rocks (all types of hard rock) and areas consisting of alluviums.
- Structural map of the region with the major faults.
With these models, it is hoped they will help in locating areas consisting of alluvium basins and surrounded by highlands, and crossed by major faults.
In the second step, ArcGIS with a high-resolution digital elevation model (DEM) was used to build a topographic model for the Petra region. Drainage nets, surface water basins, and topographic slope models were derived by using surface modeling option (Fig. 3a, 3b).
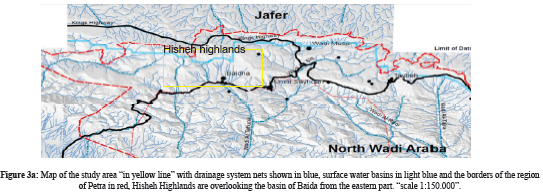
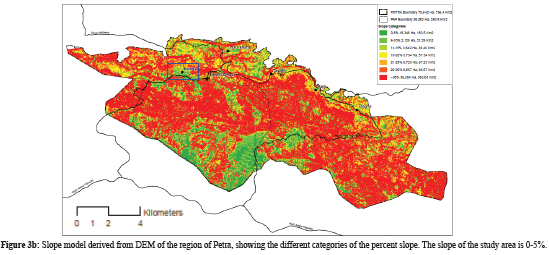
The selected basin had a relatively flat topography (0-5%) and drainage system and located exactly on the periphery of Hisheh Highlands (Fig. 3a). The basin is located in the lowest topographic zones of the region. Hisheh Highlands are well known to be swept annually in the winter by snow and heavy rainfall events.
3. Detailed geological settings of the selected locality
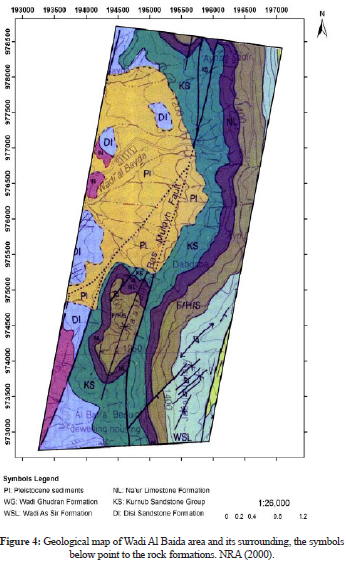
Wadi Al Baida forms from an escarpment trending N-S and consisting of the following lithological and structural features (Figure 4):
3.1. Stratigraphy
- The Umm Ishrin Sandstone formation (IN) (Middle-Late Cambrian) The formation forms the oldest rock unit and covers the lowest points in the study area especially along wadi courses. It can be found in the southwestern parts of the study area as massive, steep slopes and cliffs. It consists of red-brown to yellow-brown and mauve-red, medium to coarse-grained massive weathered quartzose sandstone with thin beds of micaceous sub-arkosic sandstone. The color banding was caused by rhythmic deposition of iron and manganese oxide and hydroxide minerals within the sandstone.
- Disi Sandstone Formation (DI) (Upper Cambrian-lower Ordovician). The formation overlies the Umm Ishrin formation and can be found in the southwestern part of the study area. Its thickness reaches up to 250 m and consists of white, grey, yellowish-grey, medium to coarse-grained sandstone.
- The Kurnub Sandstone Group (KS) (Aptain to Early Cenomanian) The group is unconformably overly the Disi Formation and reaches about 160 m in thickness.
- Na'ur Limestone Formation (NL)(Cenomanian).
This is the first carbonate marine formation. It follows the siliciclastic rocks of about 60-75 m in thickness.
- Fuhays/ Hummar/ Shu'ayb(F/H/S) (Undifferentiated) (Cenomanian-Lower Turonian)
The formation is about 80-110 m thick. It consists of grey-green, pink, red calcareous siltstone-mudstone, thin-bedded yellow-buff fossiliferous marl, marly limestone, banded gypsum with green and red mudstone and multicolored sandstone beds.
- Wadi As Sir Limestone Formation (WSL) (Turonian).
It is about 120 m thick and consists of massive, buff and grey dolomitic limestone, which at the base is overlain by massive sandy-dolomitic carbonate beds intercalated with marly limestone, silty mudstone and nodules of grey chert.
- Pleistocene Sediments (Pl) (Pleistocene)
They are the youngest sediments in the study area consisting of poorly-good sorted gravel, sand, silt and fine loess materials. It is mainly covering the down slopes and sliding blocks. It covers a large area in the northern part of the study area especially down the escarpment where the erosional process is concentrated in addition to the effect of gravitational force.
3.2. Detailed structural settings of the selected locality
The region where the study area is located is overlooking the Dead Sea Transform Fault System as shown in figure 1a and figure 4 affecting the area and leading to the formation of active faults extended both east-west and south-north.
Wadi Al Baida area is cross-cut by a major sinistral strike-slip fault (Ras Mulayh Fault) trending about 35o. This is sub-parallel to the Wadi Musa Fault system that is located very close to the eastern boundary and caused the main disturbance in the study area. A faulted and shifted block in the southern part of the study area is a clear evidence for the tectonic influence of the fault.
Secondary faults cut the major one, and other sub-parallel faults are found cross-cutting the study area with different trends and throws.
A series of NE-SW trending folds of synclines and anticlines are documented in the southern part of the study area especially within the Wadi As Sir Formation.
3.3 Detailed hydrological settings of the selected locality:
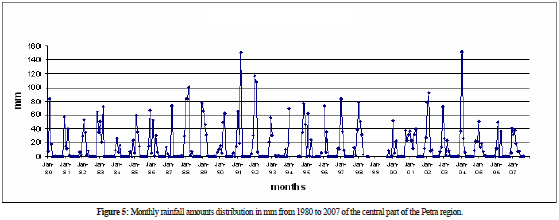
Figure 1b illustrates the hydrological settings of the study area. The Petra area is located on the western slopes of the north-south Sharah mountain range, which extends from Showbak to Ras al Naqab. This part of Western Highland Range forms a continuous elongated recharge mound. The crest of this mound attains its highest elevation between Wadi Musa and Ras al Naqab. A part of the recharge flows westwards and gives rise to springs along the escarpment in the Showbak - Wadi Musa areas. A large proportion of the recharge discharges eastwards into the Jafer Basin. Since the Ras Mulayh Fault occurs between the Kurnub sandstone and the Disi sandstone, it acts as a conduit for groundwater movement because both sandstones are aquifers. Figure 5 illustrates the monthly rainfall amounts distribution in mm from 1980 to 2007 in the area of Wadi Musa.
4. Geophysical measurements and data
4.1. Gravity Method
The gravity measurement in this study utilizing forty-three gravity stations (Figure 6, black dots) for the period of December 2012 to January 2013.
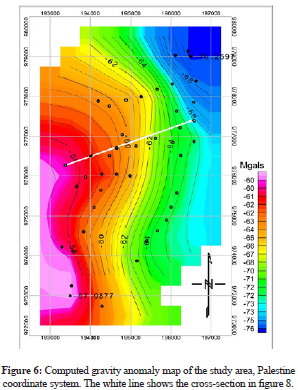
The stations were placed at random positions (Figure 6) considering the rugged surface. The coordinates and altitudes for the gravity stations were obtained from the Survey Division, a part of the Natural Resources Authority. The survey incorporated very precise benchmarks using the transit and rod surveying method. The gravity measurements were performed by using a Lacoste Romberg G880 Gravity Meter. Each day of the data collection began and ends with a measurement taken at the gravity base station called "Ma'an 901690", which belongs to the Jordan Gravity Standardization Network (JGSN), established in NRA (1990).
The location and absolute gravity value of this station are:
Latitude 30° 12.90 ‘
Longitude 35° 43.22 ‘
Elevation of 1110.88 m
The observed gravity at this base station is 979075.193 mGal.
The above information from the base station were needed, because the used gravimeter cannot determine the absolute gravity, but only the difference in their readings at two stations, which is proportional to the difference between the gravity values at the two stations. To convert these differences or relative gravities into absolute gravity values, one station at least is needed, called the gravity base station, where the absolute gravity field was already determined earlier by tying it to the national network.
4.1.2 Data processing
The gravity values, as well as the complete Bouguer anomaly (CBOG) for each gravity station, were computed utilizing raw gravimeter readings on a portable computer. Oasis Montaj Software from Geosoft was used for data reductions; the program computes all the necessary corrections to the ideal earth model gravity. In addition, it makes the conversion from gravimeter readings to observed gravity and applies the earth tide and instrument drift corrections. Moreover, the program calculates the gravity effect of a homogeneous layered spinning earth, its elevation correction or "free air effect", the Bouguer slab effect and its curvature correction, and the total terrain correction to generate the gravity effect of the ideal earth model. The Bouguer density used for the data reduction was 2.67 g/cm3. However, the program also computed the gravity anomaly associated with any regional densities. The program then converts each gravimeter reading into gravity value and computes the earth tide and instrument drift corrections from the base station data applying them to produce the true observed gravity value for each station. Finally, the program subtracted the earth model gravity from the observed gravity to give the complete Bouguer gravity anomaly (CBOG) for each station.
4.1.3 Analysis results
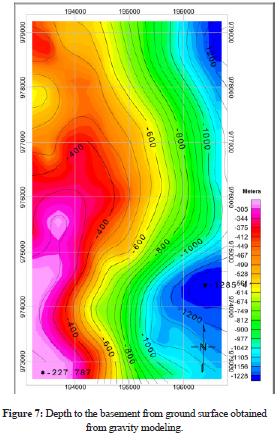
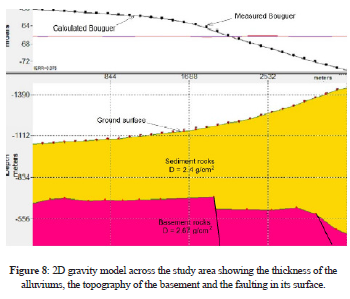
The complete Bouguer gravity anomaly map (Figure 6) was generated from the data generated from the data processed in section 4.1.2. For contouring, the Oasis montaj software was used. The contour interval was drawn with 1mGal with a grid cell size of 200 meters. The calculated minimum value was -70.65 mGal, the maximum value was -56.74 mGal, the mean value was -62.00 mGal and the standard deviation was 3.74 mGal. The calculated depth to the basement by Werner deconvolution is shown in the Figure 7. A 2D gravity model (figure 8) was constructed across the study area (figure 6, white line).
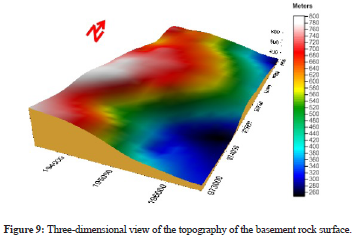
The results have been correlated in order to determine the depth of the basement; results were correlated in order to determine the depth of the basement, to develop a possible geological scenario and to visualize a three-dimensional view for its site (figure 9).
4.2. VERTICAL ELECTRICAL SOUNDING (VES) METHOD
4.2.1 Data Acquisition in the selected site of the basin
The use of gravity method enables us to visualize the basin in 3-D. With this, it is possible to choose areas having promising groundwater potentials. In those areas, the resistivity survey was applied. Four Schlumberger electrical resistivity depth soundings were performed in the study area utilizing Syscal R2 Resistivity Meter (Iris Instruments. Ltd.). The maximum electrode spacing was 2000 m.
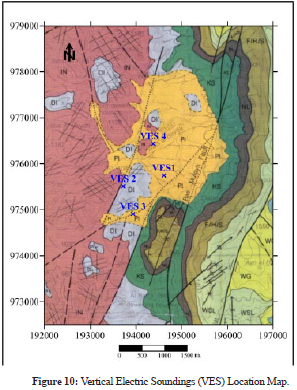
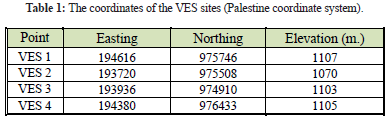
The electrodes were configurated in a north-south direction, which is the most suitable direction to have the electrical current passing -as much as possible- through the same geology. The selected VES sites are shown in figure 10; with coordinates that resemble the Palestine coordinate system of these sites are shown in Table 1.
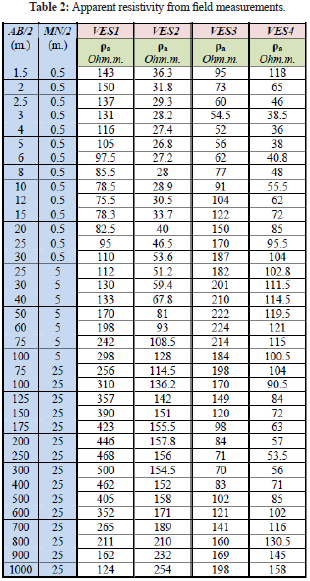
During the fieldwork, data quality was controlled by exchanging the current and potential electrodes and simultaneously checking the results obtained on site by plotting the values on a logarithmic scale to ensure smooth operations. Field measurements of apparent resistivity values are shown in Table 2.
Interpretation of the geoelectric results was executed by automatic techniques. The sounding curves were interpreted by using computer resistivity programs, IX1Dv3, and Ipi2win; the interpretation proceduresuse forward modeling. A hypothetical layered earth model is generated to compute theoretical response with the observed or measured field response. Then a model refinement is made by using automated inversion. The electrical resistivity distribution of the subsurface can be obtained from an inversion of the full dataset (Roy & Apparao, 1971; Koefoed, 1979).
5. Interpretation and Discussion
By the aid of GIS, it was possible to determine a suitable area to apply the geophysical survey. Baida basin was found to be one of the flattest and lowest areas in the Petra region with a topographic location that can drain the surrounding highlands; thing which is typical for indirect types of groundwater recharge, and a slope less than 5%, which makes the basin an optimized one for direct groundwater recharge. Hydrologically, it is surrounded with side wadis that drain highland. From the geological point of view, it consists of alluviums (Pleistocene sediments) with poor good sorting where elongated active faults are cutting the basin.
The faults in the basin and due to their direction (parallel to the Dead Sea transform fault system) and due to their clear extension on the space photos (despite the continuous erosion processes) seem to be active faults, thing makes rainwater to percolates easier into the depths of the basin making additional direct recharge.
In the winter, the basin receives both direct and indirect types of recharge into those layers able to store water; indirect type of recharge is coming from the side wadis surrounding the basin especially in the eastern parts. The highlands of Hisheh receive annual precipitation more than 300 mm. Snow storage also plays its role in these highlands when the snow is melting a flowing down in stream flow through the mentioned wadis. Surface runoff along the wadis with the presence of some active faults (due to the impact of the Dead Sea Transform Fault that is close to the basin) can easily percolate and reach the groundwater-bearing layers. The basin itself receives annual rainfall amounts of about 150 mm giving a good chance for annual direct recharge, especially with the relatively accepted amounts of actual evaporation (around 80%) and proper ratios of infiltration.
The gravity anomaly map (figure 6) shows high negative values of Bouguer anomaly at the west and low negative values at the east of the map. This anomaly reflects the gradient of the basement rocks, which are characterized by densities higher than the densities of the overlying sedimentary rocks. Values that are more negative indicate the deeper are the basement rocks. The gravity, modeling the bulk density of the alluvium was given 2.4 g/cm3, and the basement density was given 2.67 g/cm3. The depth of the basement surface was found to range between 300 m in the west and southwest of the study area to 1300 m under the sedimentary cover at the far east of it. With the aid of the gravity-2D and 3D-models it was possible to visualize the basin of Baida. The fault systems (extending north-south) were found to show vertical continuity through the sediments into the basement (also emphasized on the surface geology mapping of the area). Those faults should enhance and improve recharge processes of groundwater.
Figure 7 shows that the basement surface is tending in general from the west to east, where the sedimentary cover is thicker. These sedimentary rocks are forming high mountains. The depth of the surface basement ranges between 300 m in the western area of the map to 1300 m under the sedimentary cover in the eastern part of the study area.
In order to test this aspect of the data analysis results, the 2D gravity model (fig. 8) was constructed across the study area (figure 6, white line). This model shows an abrupt change in thickness in the middle and the east of the profile. This can be interpreted as a result of series of faults with an orientation in north-southward direction. These faults are according to the faults shown in the geological (figure 4) and tectonic map (figure 2, left side). The model also shows the thickness of the sedimentary rocks; it ranges from 300 m in the west to 1000 m in the east over the basement rocks. The coincidence with Werner technique result map (Figure 7) is good. In both figures, the general inclination of the basement from West to East is visible as well as the thickening of the sedimentary coverage.
The findings of the gravity also are pointing to that Baida Basin is a structural basin and more likely to be a graben structure. The inferring elongated and vertically extended faults in the gravity modeling extending parallel to each other are emphasizing on that.
The gravity models allowed the location of the VES points in promising areas with good potentials to contain groundwater.
In VES 1, the first resistivity horizon from surface to about 1.5 m depth with resistivity values from 112 to 193 Ωm (Layers 1 and 2 in Table 3) indicates surface materials like sand, clay, gravel and boulders of sandstone. The underlying horizon (ranges from 1.5 m to about 15 m in depth, Layers 3 and 4 in Table 3) consists of wet sand, gravel, limestone and clay with a low resistivity (47-76 Ωm). The high resistivity values of the third horizon (ranges from 17-137 m in depth, Layers 5, and 6 in Table 3) can be interpreted as hard, dry and fractured sandstone. At a depth of about 137.5 m the low resistivity value (35 Ωm) indicates saturated sandstone (Figure 11, Layer 7 in Table 3).
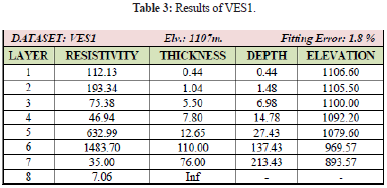
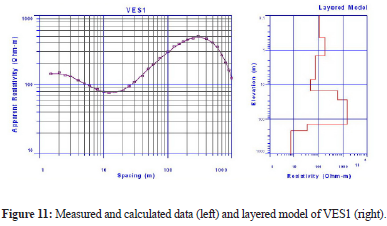
Table 3: Results of VES1.
In VES 2, the first resistivity horizon from surface to 55 m depth (Layer 1 to 4 in Table 4) had moderate to high resistivity values indicating surface materials consisting of sand, gravel, boulders of sandstone, limestone and clay. The second resistivity horizon (Layer 5 in Table 4) is characterized by low resistivity value (24.3 Ωm) indicating wet or saturated sandstone supposed to be Umm Ishrin Sandstone. The third resistivity horizon (Layer 6 in Table 4) starts at a depth of about 121.5 m and reaches 194 m with high resistivity values. These data allowed the interpretation of this layer as saturated sandstone (Figure 12, Table 4).
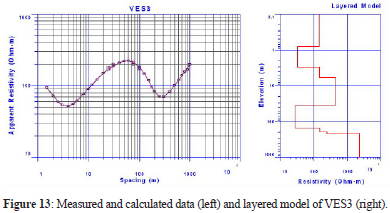
In VES 3, the different resistivity values ranging fsom 32 Ωm to 147 Ωm from the surface to about 6 m depth (Layer 1 to 3 in Table 5) are interpreted as surface materials. The underlying layer with a depth of nearly 36 m (Layer 4 in Table 5) with a resistivity value of 447 Ωm is supposed to be the top of the sandstone.
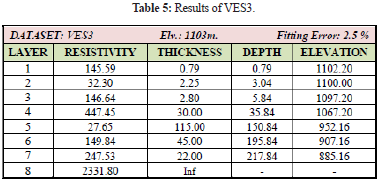
The lowest resistivity value (27.8 Ωm) appears at 36 to 150 m depth (Layer 5 in Table 5). This result of measurement indicates high iron-oxide concentration known from Umm Ishrin sandstone. Saturated sandstone was found at depths starting at 150 m with a depth of 45 m having a resistivity value of 150 Ωm (Figure 13, Layer 6 in Table 5).
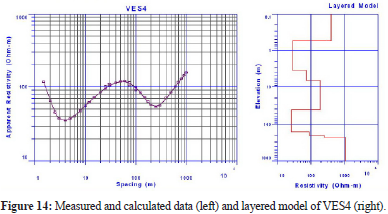
In VES 4, the Surface layers appear down to a depth of 6.7 m consisting of sand, clay, gravel and boulders of sandstone (Layers 1 to 3 in Table 6). The resistivity values are ranging from 397 to 28.3 Ωm.
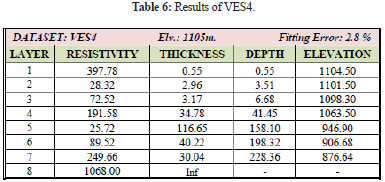
The top sandstone layer starts at a depth of 6.7 m to 41.5 m with a resistivity value of 192 Ωm (Layer 4 in Table 6). The lowest resistivity value (25.7 Ωm) appears at 41.5 to 158 m depth (Layer 5 in Table 6) according to iron-oxide-rich Umm Ishrin sandstone. Water-saturated sandstone starts at the depth of 158 m with a resistivity value of 89.5 Ωm (Figure 14, Layer 6 in Table 6).
6. Conclusions
Baida basin was found to be a structural basin, it was proved by this study to be most likely a graben structure. The inferred elongated and vertically extended faults extending parallel to each other from its eastern and western parts are emphasizing on that. The basin is composed of successive layers of alluvium fillings with thicknesses ranging between 300 meters in the west to 1300 meters in the east. The sediments have been transported through wadis eastern wards and westwards of the basin. Those alluviums cover beds of sandstone from Ordovician age. A good correlation was found between the gravity derived cross section and the geoelectric. Both methods showed very similar depths of the basement..With the gravity method, it was possible to visualize the basin in 3-D. This helps to find promising areas to have groundwater potentials.
Due to the lack of direct groundwater data about the area and depending on the previous data and results, the proposed location for an exploration well should be located at the measurement points VES1 or VES2 site. The proposed drilling depth should be about 190 m.
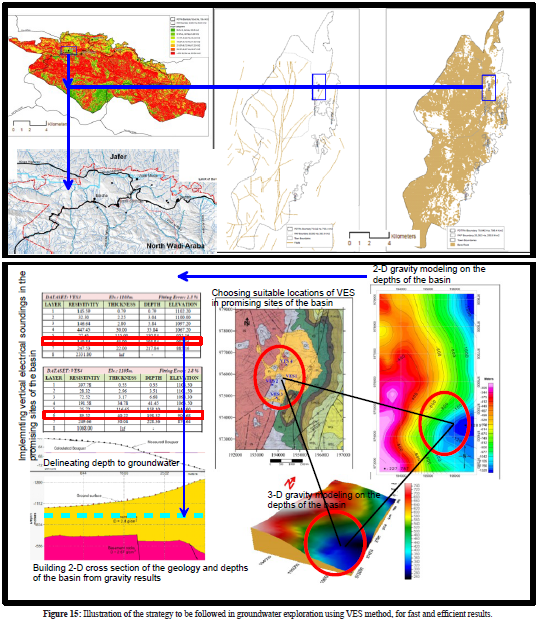
Figure 15 illustrates the steps to be followed in groundwater exploration using VES method if there are available gravity readings of the basins and if there is a good correlation between the gravity and geoelectric data.
As results of this study, the following conclusions can be made:
- Promising areas in this context mean low topographic and flat geological basins, filled with alluviums, surrounded by side wadis that draining their floods into the basin from the surrounding highlands.
- In arid and semi-arid areas, the described strategy can be followed in looking for promising areas that contain rechargeable groundwater aquifers of alluvium sedimentary types, especially for alluvium-filled sedimentary basins. Therefore, it is possible to neglect the majority of the unwanted areas. This contributes to saving time, money and efforts in the exploration for groundwater.
- The modern software with the presence of digital spatial models makes easier to reach the promising areas for groundwater exploration using geophysics. Where the surface modeling using GIS with the aid of DEMs is of a paramount importance in identifying areas prone for groundwater recharge, while regional geology and structures enrich the hydrogeological conceptuality of the studied basin to neglect unpromising sites.
- Conditions are typical when the basin contains faults. Active types of faults can keep the connection with depths of the basin, which means rapid groundwater recharge and percolation.
- Details of geology and structures of the site can emphasize on resulted geophysical visualization models.
- Using gravity in visualizing sedimentary basins is an excellent step locating VES sites, to enable application of resistivity investigations in promising sites with good water potentials. Where the gravity results can be directly modeled to reveal the basin's geometry, bedrock topography, and subsurface structures. Also, gravity method is of a great importance in understanding the internal behaviors of the faults that can be inferred from the surface.
- A good correlation was found between the gravity derived cross section and the geoelectric results. This is obvious from the obtained depths to the basement of the two methods. Consequently, besides its importance in studying stratigraphic sequences and delineating water-rich strata, results of the vertical electrical sounding method can emphasize on gravity models.
Acknowledgment
AlHussein bin Talal University is highly recognized for making the software and hardware of the study available. PDTRA is highly acknowledged for their continuous support and choosing scientific methods in decision-making. NRA is also highly acknowledged for the continuous follow up with PDTRA during the phases of field survey in both gravity and resistivity methods, and in sharing data processing and interpretation with Directorate of Studies and Planning in PDTRA. Eng. Adel Hasant (M.Sc. holder in software development) is highly acknowledged for his technical assistance.
REFERENCES
Apparao A., Roy A. (1971). Resistivity model experiments 2: Geoexplor. 9, 195-205. Extension of previous work by Apparao and Roy (1969) including results for five electrode configuration. [ Links ]
Al Farajat M., H. Amoush, R. Abou Salah (2005). Hydro-geophysical exploration for groundwater potentials in Titin Basin, South Jordan, J. Hydrogeol. Umwelt 33, 8, 1-13. [ Links ]
Al Farajat M. (2008). Characterization of a Coastal Aquifer Basin Using Gravity and Resistivity Methods: a Case Study from Aqaba in Jordan, Acta Geophysica, Springer, vol. 57, no. 2, pp. 454-475. [ Links ]
Al Farajat M. (2002). Hydrogeo-eco-systems in Aqaba/Jordan - coasts and region; natural settings, impacts of land use, spatial vulnerability to pollution and sustainable management, Ph.D. Thesis, Universität Würzburg, Germany, http://opus.bibliothek.uni-wuerzburg.de/opus/volltexte/2002/241/. [ Links ]
Al Farajat M., A. Mashagbeh (2004). Delineation of the hydrodynamic interface between fresh and seawater in the coasts of Gulf of Aqaba, Al Manarah J. 10, 47-60, Al al-Bayt University, Mafraq-Jordan. [ Links ]
Al Farajat M. et al. (2005). Hydrogeophysical exploration for groundwater potentials in Titin Basin South Jordan, Hydrogeologie und Umwelt 33. [ Links ]
Al Farajat M. (2006). Modeling geometrical properties in the southern basin of Aqaba for groundwater potentials, using resistivity method, J. Appl. Geophys., Egyptian Soc. Appl. Petro-Phys. 5, 1, 11-22. [ Links ]
Al Farajat M, Alansari N., Mashagbeh A., Abou Salah R., (2005). Hydrogeophysical and Environmental Investigation of Groundwater Potentials in Al Sokhna Alluvium Aquifer in Zarqa - Jordan, Journal of Hydrogeologie und Umwelt, Heft 33, (7) 1-14, Wuerzburg - Germany. [ Links ]
Al Farajat M. (1997). Karstification in North-west of Irbid and its Role in Enhancing Human Impacts on the Local Groundwater Resources. M.Sc. thesis, University of Jordan, Amman-Jordan. [ Links ]
Babu H. V. R., Rao N. K., Kumar V. V. (1991). Bedrock topography from magnetic anomalies - An aid for groundwater exploration in hard-rock terrains (short note): Geophysics, 56, no. 07, 1051-1054. [ Links ]
Bender F., (1975). Geology of the Arabian Peninsula: Jordan. U.S. Department of the Interior, Geological Survey Professional Paper, 560-1, Washington. [ Links ]
Bose R.N., D. Chatterjee, A.K. Sen (1973). Electrical resistivity surveys for groundwater in the Aurangabad sub-division, Gaya district, Bihar, India, Geoexploration 11, 1-3, 171-181, DOI: 10.1016/0016-7142(73)90059-8. [ Links ]
Burger H.R., Sheehan C.H. and Jones, A.F. (2006). "Introduction to Applied Geophysics: Exploring the Shallow Sub-surface," W.W. Norton & Company, New York. [ Links ]
Coker JO, Makinde V, Olowofela JA (2009). Geophysical Investigation of Groundwater Potentials of Oke-Badan Estate, Ibadan, Southwestern, Nigeria. Proceedings of 3rd International Conference on Science and National Development University of Agric. Abeokuta, p. 119. [ Links ]
Carmichael R. S. and Henry, G., Jr. (1977). Gravity Exploration for Groundwater and Bedrock Topography in Glaciated Areas. Geophysics, v. 42, pp. 850-859. [ Links ]
Dobrin M.B., (1976). INI RODUCTION TO GEOPHYSICAL PROSPECTING, Third Edition: McGraw-Hill, Inc., . Elsevier, Scientific Publishing Company, New York, pp. 141-191. [ Links ]
Edet A.E., and C.S. Okereke (2002). Delineation of shallow groundwater aquifers in the coastal plain sands of Calabar area (Southern Nigeria) using surface resistivity and hydrogeological data, J. African Earth Sci. 35, 3, 433-443, DOI: 10.1016/S0899-5362(02)00148-3. [ Links ]
Gowd S. S. (2004). Electrical Resistivity Surveys to delineate Groundwater Potential Aquifers in Peddavanka Watershed, Anantapur District, Andhra Pradesh, India. J. Envir. Geol.,46:118-131. [ Links ]
Hassan H., (2007). Mapping Depth to Basement Using 2D Werner Inversion of High-Resolution AeroMagnetic (HRAM) Data, John Milsom, (2003). FIELD GEOPHYSICS, UNIVERCITY COLLEGE, LONDON. [ Links ]
Kirsch R., Ed., (2006). "Groundwater Geophysics: A Tool for Hydrogeology," Springer, New York. [ Links ]
Koefoed O. (1979). Geosounding principles. Vol.1: Resistivity sounding measurements. Elsevier, Amsterdam-Oxford-New York. [ Links ]
Ministry of Planning and International Cooperation of Jordan (2013): Open files of the Ministry of Planning and International Cooperation of Jordan, Amman-Jordan. [ Links ]
Ministry of Water and Irrigation of Jordan (2014). Open files of the Ministry of Water and Irrigation of Jordan, Amman-Jordan. [ Links ]
NRA (1990). Jordan Gravity Standardization Network (JGSN), established in Natural Resources Authority of Jordan, Amman-Jordan. [ Links ]
NRA (2000). Geological map of Wadi Musa, Natural Resources Authority of Jordan, Amman-Jordan. [ Links ]
Salameh E. (1996). Water Quality Degradation in Jordan, Friedrich Ebert Stiftung, Amman-Jordan, 179 pp. [ Links ]
Salameh, E. (2001). Water shortages and environmental degradation. In S. M. J. Baban, & N. A. Al- Ansari (Eds.), Living with water scarcity: Water resources in the Jordan Badia Region, the way forward pp. 71-87. Jordan: Al Al-Bayt University. [ Links ]
Smith D., (1986). Application of the pole-dipole resistivity technique to the detection of solution cavities beneath highways: Geophysics, 51, 833-837. [ Links ]
Spiegel R., Sturdivant V., and Owen T., (1980). Modeling resistivity anomalies from localized voids under irregular terrain: Geophysics, 45, 1164-1183. [ Links ]
Telford W.M., Geldart, L.P., Sheriff, R.E., and Keys, D.A., (1978). APPLIED GEOPHYSICS: Cambridge University Press, 1976. [ Links ]
Urish D.W., and R.K. Frohlich (1990). Surface electrical resistivity in coastal groundwater exploration, Geoexploration 26, 4, 267-289, DOI: 10.1016/ 0016-7142(90)90008-G. [ Links ]
Wattanasen K., and S., -A., Elming (2008). Direct and indirect methods for groundwater investigations: A case-study of MRS and VES in the southern part of Sweden, J. Appl. Geophys. 66, 3-4, 104-117, DOI: 10.1016/j.jappgeo.2008. 04. 005. [ Links ]
William Jess Ellett (1994). Geologic Controls On The Occurrence And Movement Of Water In The Lower CihNEGA CREEK BASIN, DEPARTMENT OF HYDROLOGY AND WATER RESOURCES,. 31 [ Links ]
