


Serviços Personalizados
Journal
Artigo
 Inglês (pdf)
 Artigo em XML
 Referências do artigo
 Enviar este artigo por email
Indicadores
-
 Citado por SciELO
 -
 Acessos
Links relacionados
-
 Citado por Google
 -
 Similares em
SciELO
Similares em
SciELO -
 Similares em Google
Compartilhar

 Permalink
Earth Sciences Research Journal
versão impressa ISSN 1794-6190
Earth Sci. Res. J. vol.19 no.1 Bogotá jan./jun. 2015
https://doi.org/10.15446/esrj.v19n1.44714
http://dx.doi.org/10.15446/esrj.v19n1.44714.
HYDROLOGY
Gis Based SCS - CN Method For Estimating Runoff In Kundahpalam Watershed, Nilgries District, Tamilnadu.
R. Viji1, P. Rajesh Prasanna2, R. Ilangovan3
1 Assistant Professor, Department of Civil Engineering BIT, Anna University Chennai, Tiruchirappalli
2,3 Professor, Department of Civil Engineering BIT, Anna University Chennai, Tiruchirappalli
Email:1rajaviji_23@yahoo.co.in, 2rajeshprasanna71@yahoo.com.
Record
Manuscript received: 01/08/2014 Accepted for publication: 15/01/2015
ABSTRACT
Divination and determination of catchment surface runoff are the most important contestable process of hydrology. Soil Conservation Service - Curve Number (SCS - CN) method is employed to estimate the runoff. It is one of the physical based and spatially distributed hydrological models. In this model, the curve number is a primary factor used for runoff calculation. The selection of curve number is based on the land use pattern and HSG (Hydrological Soil Group) present in the study area. Since the spatial distribution of CN estimation by the conventional way is very difficult and time consuming, the GIS (Geographic Information System) based CN method is generated for Kundapallam watershed. With the combination of land use and HSG the estimated composite CN for AMC (Antecedent Moisture Condition) I, AMC II and AMC III for the entire watershed was about 48, 68 and 83 respectively. The average annual runoff depth estimated by SCS-CN method for the average annual rainfall of 173.5 mm was found to be 72.5 mm. The obtained results were comparable to measured runoff in the watershed.
Key words: Hydrological Modeling, Land Use and Hydrological Soil Group, Geographic Information System, SCS-CN, Surface Runoff.
RESUMEN
La predicción y la determinación del caudal de escorrentía de una cuenca son procesos de amplio debate en la hidrología. El método coeficiente de escurrimiento, del Servicio de Conservación de Suelos (SCS-CN, inglés) fue utilizado en este trabajo para estimar la escorrentía. Este es uno de los modelos hidrológicos basados en conceptos físicos y distribución espacial. En este modelo el coeficiente de escurrimiento es un factor de relevancia para el cálculo de la escorrentía. La selección del coeficiente de escurrimiento está basada en los patrones del uso de la tierra y del Grupo de Suelos Hidrológicos (HSG, inglés) relativos a esta área de estudio. Debido a que la estimación del coeficiente de escurrimiento en la distribución espacial es compleja, para la cuenca Kundapallam se implementó un método a partir de un Sistema de Información Geográfica (GIS, inglés), y basado en el coeficiente de escurrimiento. Con la combinación del uso de suelos y el HSG, la estimación compuesta del coeficiente de escurrimiento para el Antecedente de Condición de Humedad AMCI, AMCII y AMCIII para toda la cuenca fue de 48, 68 y 83. El promedio anual de escorrentía profunda estimada por el método SCS-CN con una media anual de lluvia de 173,5 mm fue de 72,5 mm. Los resultados fueron comparados con la escorrentía medida en la cuenca.
Palabras clave: Modelamiento hidrológico, uso del suelo, grupo de suelos hidrológicos, Sistema de Información Geográfica, SCS-CN, caudal de escorrentía.
INTRODUCTION
Water is one of the most vital requirements for economic and social development. The Nilgiris is an upstream catchment district, and the bulk of its water resources are dedicated to power generation for the state. Over the years, the natural systems and watersheds have seen much change in the Nilgiris. Building a series of hydroelectric projects, tunnelling the water to different areas of irrigation, building reservoirs, planting the upper areas with commercial pulpwood species and replacing natural grasslands with tea and marshes with vegetables has changed the district's water regime. Overall, water resources are said to be abundant in the district but about a third of the sources are seasonal, more than 80 percent rural settlements get less than 40 lpcd (liters per capita per day) of water available, and shortages are also common in urban locations (Nilgries water portal). This prompted the study of water resources regimes in the Nilgries. For a better water management in the watershed, the relationship between rainfall and runoff should be established. Rainfall and runoff are the main components of the hydrological process and contribute a major source of water to the upstream and downstream of the watershed.
Physically based and spatially distributed hydrologic computer models are in existence to calculate the phases of runoff generation for a given rainfall event (Beven and Kirkby 1979, Murari Paudel et al 2006, Ratika et al.2010, Jaehak et al 2010). The key benefit of these models is the precision of their predictions. Their major weakness is that they require considerable expertise, time and effort to be used effectively. In between the boundaries there are methods like the SCS-CN (Soil Conservation Service Curve Number) method that are relatively easy to use and yield acceptable results (Schulze et al. 1992). In this approach a simple empirical formula and readily available tables and curves are used. The CN is a crucial factor to consider for runoff estimation (Bonta1997). A high curve number means high runoff and low infiltration; whereas a low curve number means little runoff and high infiltration (Xiaoyong Zhan and Min-Lang Huang 2004). The curve number is a function of land use and Hydrologic Soil Group (HSG). It is a method that can incorporate the land use for the computation of runoff from rainfall. The SCS-CN method provides a rapid way to estimate runoff change due to land use change (Zhan and Huang 2004).
There are certain advantages of a fully distributed model and that prompted its selection for this study. First, it enables to divide any significant catchment into a number of grids and accordingly runoff can be generated over each grid (Dubayah and Lerrenmaier1997). Runoff can be routed from each pixel to the outlet of the whole basin for the purpose of calibration and validation. Secondly, once the model is developed, calibrated and validated, the same can be applied to any grid in that basin to calculate runoff, even if they are ungauged at sub-catchment or sub-basin level. There is a certain limitation to the present study, i.e., the point that the rainfall data have been applied uniformly to the entire grid area. The principle of the present study is to build up a fully distributed GIS-based hydrologic model considering physiographic heterogeneity in terms of soil and land use to estimate the daily run-off.
Keeping these points in view, a fully distributed Rainfall -Runoff model has been developed based on the widely accepted, SCS- CN method in GIS environment (Jain 1996; Nash and Sutcliffe 1970; Sameer shaded and Mohammad almasri 2010). This provides basic information for managers to assess runoff generation volumes within the region and thus supports the decision-making process for future development of water resources and hydrologic structures in the area.
DESCRIPTION OF THE STUDY AREA
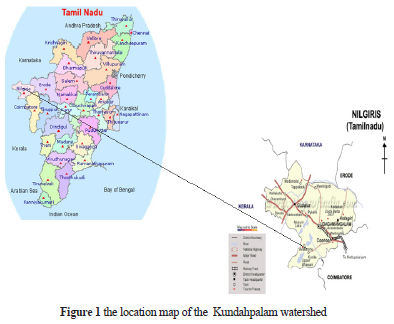
Kundahpalam micro watershed number 12 C/75 with an area of 14.37 Km2 lies in the Nilgiris District of Tamil Nadu. It is a hilly area located in the fragile environment of the Western Ghats with an elevation ranging from 1560 m in the moyar gorge to 2410 m above mean sea level at Doddabetta peak. Kundahpalam micro watershed is bounded by 11º14'17"- 11º 16' 54" North latitude and 76º 34' 45" - 76 º 39' 7" East longitudes. The name of the river in the study area is Kundah, and the catchment for the drainage towards the east is larger in the area compared to those of the west. The drainage is influenced mainly by joint patterns and the foliation trends of the rock. The area is fully covered by charnockite rock. A very important hydel power project, Kundah is located in the study area. The major problems of the study area are the improper land use practice and the degradation of Shola forest which has caused severe soil erosion and damage to the fragile environment. The wind velocity and relative humidity of the Kundahpalam watershed are E 0.3 m/s and 61%. The Annual Rainfall of the area varies from 1300mm to 2000mm. The maximum and minimum temperature of the watershed are 21º C during the summer season and 10.5º C during the winter season. The Figure 1 shows the location map of the Kundahpalam watershed.
DATA AND METHODOLOGY
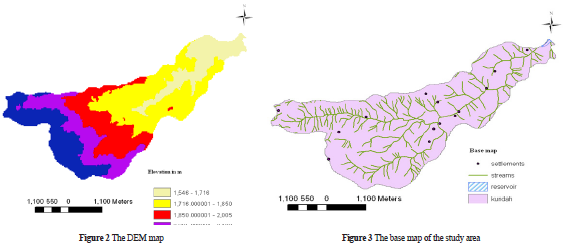
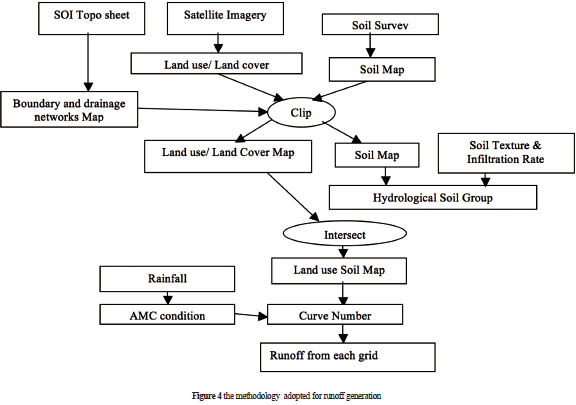
The study area was delineated from Survey of India (SOI) Toposheet No.58A/11 of scale 1:50000 of 1972 and the base map was prepared. The daily meteorological and rainfall data for five years were collected from the ISRO Automatic Weather Station (AWS) no 175. The soil survey reports from the agricultural department were used for preparing the detailed soil map and texture map. The altitude values were obtained from the contour lines available in the SOI toposheets, and the contour map was made from Cartosat 1 Dem. The Digital Elevation Model (DEM) map and the base map of the study area are shown in figure 2, and 3. AWiFS satellite data were used to prepare the land use map. The Figure 4 shows the methodology adopted for runoff generation from the various theme layer and meteorological data.
LAND USE/LAND COVER MAP
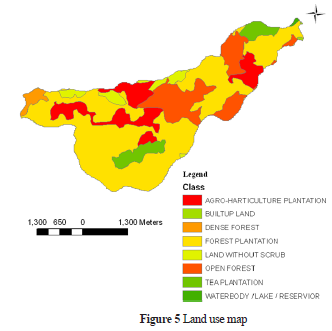
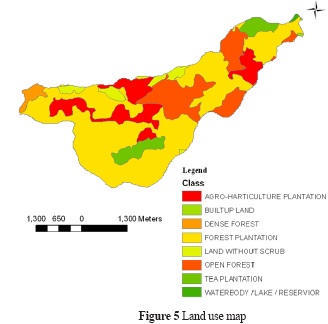
After merging of the four bands of Resourcesat -1 AWiFS satellite image of the study area, the unsupervised land use classification would be generated by using a composite tool in the Idrisi software. With unsupervised land use classification, the visual interpretation of the study area was done using image characteristics and finally the land use/ land cover map would be prepared. The accuracy of the land use/land cover was verified by correlating ground truth information. The study area was classified into eight classes such as agro- horticultural plantation, built-up land, dense forest, forest plantation, water body/lake/reservoir, land with scrub, open forest and tea plantation. The detailed classification of the land use map is shown in Figure 5.
SOIL MAP
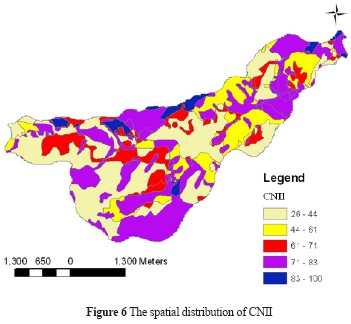
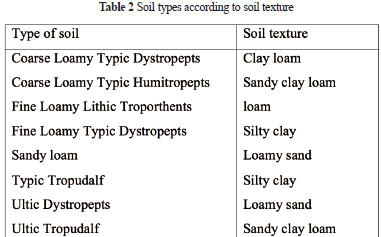
The soil map of Kundahpalam watershed was prepared after a detailed study of the soil profiles in the watershed. Soil types were defined on the basis of physiographic units homogenous in terms of geomorphology, topography and land use/cover, which ultimately resulted for eight different soil types such as coarse loamy typic dystropepts, coarse loamy typic humitropepts, fine loamy lithic troporthents, fine loamy typic dystropepts, sandy loam, typic tropudalf, ultic dystropepts, ultic tropudalf. The soil map was then classified into Hydrological Soil Groups (HSGs) that referred to the infiltration potential of the soil after prolonged wetting. The three HSGs that existed in the kundahpalam watershed is shown in Figure 6.
CALCULATION OF SURFACE RUNOFF
The curve number (CN) is a function of land use and HSG. CN values range between 0 and 100, with higher CN values associated with higher runoff potential. Traditionally, an area weighted average curve number is used for the entire watershed to study the runoff of a watershed. A fully distributed rainfall-runoff model with a fixed grid size was constructed in the present work. Appropriate curve number values for each grid element were assigned based on standard SCS curve number tables (SCS, 1975) considering Antecedent Moisture Conditions (AMC).
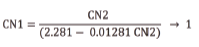
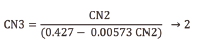
Runoff calculations were done for each sub grid. The quality of this model was improved by incorporating the spatial variation of watershed characteristics using Remote Sensing and GIS. The CN2 values arrived at based on the combination of land use, and Hydrologic soil group were meant for AMC-II condition. CN values for AMC-I (dry condition) and AMC-III (wet condition) conditions were calculated using conversion equations are given below.
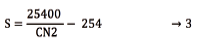
The recharge capacity 'S' was calculated by substituting the value of weighted CN in the equation
Daily rainfall data (P) collected for a period of 2008 to 2012 from the ISRO Automatic Weather Station (AWS) was used as input. Program in Micro Soft Excel was developed to calculate daily runoff for each grid using SCS-CN method. The daily direct runoff (Q) of each grid was computed by the following equation
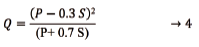
Where,
Q = Runoff Depth in mm,
P = Rainfall in mm,
S = Maximum recharge capacity of watershed after five days rainfall antecedent
Ia = 0.3S (for Indian conditions)
In this study, the curve numbers were weighed with respect to the watershed area by using the following equation:
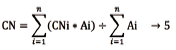
Where
CN= the area-weighted curve number for the drainage basin;
CNi= the curve number for each land use-soil group polygon;
Ai = the area of each land use-soil group polygon;
n = the number of land use-soil polygons in each drainage basin.
The average rainfall data from 2008 to 2012 of the watershed and the curve numbers corresponding to different land use and hydrological soil cover complex are given as inputs for each sub grid and daily runoff results were obtained for each sub-grid. The cumulative runoff from the basin outlet was computed. Finally, the runoff zonation map was generated by using a runoff coefficient. The runoff coefficient is the ratio between runoff and rainfall.
RESULTS AND DISCUSSION
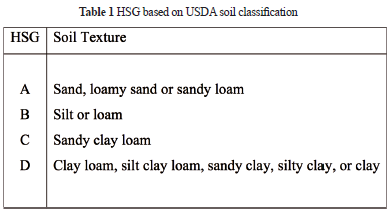
Generation of runoff model for the Kundahpalam watershed, the land use and soil maps were processed using GIS techniques. Based on the USDA soil classification the HSG of the study area could be determined according to the percentage of sand, silt, and clay. Table 1 shows the classification HSG of the study area based on USDA soil classification.
Based on the U.S. soil taxonomical classification, soil texture was defined for the different soil types of Kundahpalam watershed. Table 2 shows the soil texture corresponding to different soil types.
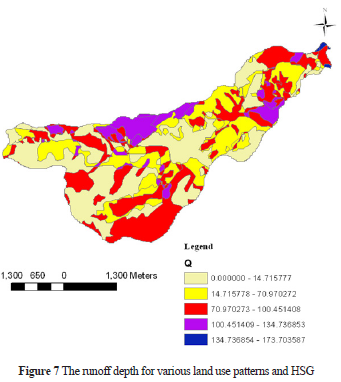
The HSG and land use map of Kundahpalam watershed was intersected using GIS according to the data shown in Tables 1 and 2. This step retains all details of the spatial variation of soil and land use. Due to the humid nature of kundahpalam watershed, the produced theme and its related attributes table were used to determine the CNII value for each grid. CNI and CNIII were computed using Equations 1 and 2 to adjust for antecedent moisture conditions (AMCI or AMCIII). The weighted curve numbers calculated for the study area under AMCI, AMCII and AMCIII were 48, 68 and 83 respectively. The spatial distribution of CNII of the Kundahpalam watershed for AMCII is shown in Figure 6. The Hydrologic soil cover group and CN used for different land use under AMCII condition are given in Table 3. The runoff depth calculated for various land use patterns and HSG of the study area is shown in Figure 7.
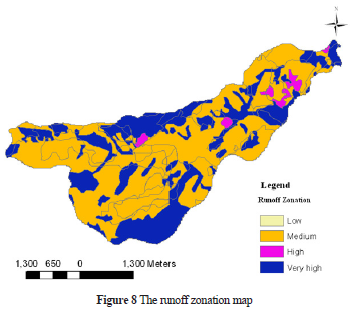
The runoff zonation map was developed for the study area is shown in Figure 8. The 30% of the study area fell under very high runoff potential, and 2% of study area fell under high runoff potential. The moderate and low runoff potential classes occupied 35% and 33% of the study area.
CONCLUSION
GIS based SCS CN model will be helpful to the researchers for the protection of water resources and water quality in watersheds. This method makes the runoff estimation more accurate and fast. In this study, the average annual precipitation of 1780.143 mm from 2008 to 2012 was used for the runoff calculation. The generated runoff from the precipitation was 1591.8 mm. This result shows that 11% of rainfall would be infiltrated into the ground and remaining 89% of rainfall is converted in to runoff. This occurs due to the hilly terrain of the watershed, i.e., the elevation of the watershed ranges from 1560 to 2410 m above mean sea level. The spatial distribution of CN value varies from 46.25 to 100. Here the values of 46.25 and 100 are in correspondence with to dense forest and water. Another highest CN value 86.75 corresponds to the built-up land. The higher CN value has a high runoff and lower CN value has a little runoff. Due to the high infiltration capacity of the dense forest, the runoff was low and in the hard surface of the built up land the runoff was high. In the water body, 100% of rainfall is converted into runoff. In horticulture plantation, agricultural land and degraded forest the infiltration is very less, and surface runoff will be more and join to the stream at the base that may cause top-soil loss. The estimated runoff showed that the watershed had a very good surface runoff potential. Hence, the surface water can be recharged into the ground by constructing suitable artificial ground water recharge structures.
REFERENCE
1. Beven K.J., Kirkby M.J. (1979). A Physically based variable contributing area model of basin hydrology. Hydrological Sciences, Bulletin, 24(1), 43-69. [ Links ]
2. Bonta J. V. (1997). Determination of watershed curve number using derived distributions. Journal of Irrigation and Drainage Engineering, 123(1), 28-36. [ Links ]
3. Dubayah R., Lerrenmaier D. (1997). Combing Remote Sensing and Hydrological Modeling for Applied Water and Energy Balance Studies. NASA EOS Interdisciplinary Working Group Meeting, San Diego, CA. [ Links ]
4. http://nilgirihillswater.pantoto.org/nilgiri/index.html, 2007. [ Links ]
5. Jain M.K. (1996). GIS based rainfall, runoff modelling for Hemavathi Catchment, NIH Report CS/AR-22/96-97. National Institute of Hydrology, Roorkee. [ Links ]
6. Nash J. E., Sutcliffe J. V. (1970). River flow forecasting through conceptual models. J. Hydrol. 10, 282-290. [ Links ]
7. Sameer shadeed, Mohammad almasri (2010). Application of GIS-based SCS-CN method in West Bank catchments. Palestine Water Science and Engineering, 3(1), 1-13. [ Links ]
8. Schultz G.A. (1993). Hydrological Modeling based remote sensing information. Adv. Space Res., 13(5). [ Links ]
9. Soil Conservation Service (1985). Hydrology, National Engineering Handbook, Washington, USDA. [ Links ]
10. Xiaoyong Zhan , Min-Lang Huang (2004). ArcCN-Runoff: an ArcGIS tool for generating curve number and runoff maps, Environmental Modelling & Software, 27-04-04 13:11:52 3B2 Ver.: 7.51c/W Model: 5 ENSO1500. [ Links ]
