


Services on Demand
Journal
Article
 English (pdf)
 Article in xml format
 Article references
 Send this article by e-mail
Indicators
-
 Cited by SciELO
 -
 Access statistics
Related links
-
 Cited by Google
 -
 Similars in
SciELO
Similars in
SciELO -
 Similars in Google
Share

 Permalink
Earth Sciences Research Journal
Print version ISSN 1794-6190
Earth Sci. Res. J. vol.19 no.2 Bogotá July/Dec. 2015
https://doi.org/10.15446/esrj.v19n2.44897.
http://dx.doi.org/10.15446/esrj.v19n2.44897.
ELECTROMAGNETIC METHODS
Electromagnetic Measurements for Monitoring Molybdenum Contamination in Near-Surface Survey
Mediciones Electromagnéticas para Rastrear la Contaminación de Molibdeno en un Estudio de Superficies
Ali Ismet Kanli1* and Boriszlav Neducza2
1*Istanbul University, Faculty of Engineering, Department of Geophysical Engineering, 34320, Avcilar Campus, Istanbul, Turkey. E-mail: kanli@istanbul.edu.tr
2 MinGeo Ltd., H - 1142 Budapest, Ráskai Lea u. 20., Hungary.
Record
Manuscript received: 12/08/2014 Accepted for publication: 14/08/2015
How to cite item
Kanli, A.I. & Neducza, B. (2015). Electromagnetic Measurements for Monitoring Molybdenum Contamination in Near-Surface Survey. Earth Sciences Research Journal, 19(2), 107-111. http://dx.doi.org/10.15446/esrj.v19n2.44897.
ABSTRACT
We carried out electromagnetic measurements in the vicinity of the near surface molybdenum contamination observed in the "Blue Lagoon" plum located in the north-east of Hungary. The aim of the investigation was to find the origin of the molybdenum pollution, situated in the area, which could be a container or other infrastructure leading to the source of contamination. The field study was conducted in two stages. In the first phase, we gathered electromagnetic data by using GEM-2 type equipment. We derived conductivity and susceptibility maps for each acquired frequency from the electromagnetic data. In the second stage of the field study, GPR data were obtained from 50 MHZ and 450 MHz antennas. In the GPR measurements, we gathered detailed information from GPR depth slices from very shallow depth ranges to deeper parts of the investigated area (from 50cm to 8 m depths). In all results from the measurements executed by the GEM-2 and (50 MHZ and 450 MHz) GPR equipment, there are several clear anomalies are observed in the data for distribution of molybdenum contamination. Although there are several contaminated zones observed, no clear evidence of the source of contamination was found in the vicinity of the molybdenum pollution peak.
Keywords: Electomagnetic, GPR, Molybdenum, contamination.
RESUMEN
En este estudio se llevaron a cabo mediciones electromagnéticas en las inmediaciones de un foco de contaminación de molibdeno hallado en el "Blue Lagoon", al noreste de Hungría. El propósito de la investigación fue encontrar el origen de la contaminación de molibdeno, detectada en el área, y que podría ser el contenedor u otra infraestructura que lleve a la fuente de polución. El trabajo de campo se llevó a cabo en dos partes. En la primera fase se reunió la información electromagnética a través del equipo GEM-2. De esta forma se obtuvieron mapas de conductividad y susceptibilidad para cada frecuencia adquirida de la información electromagnética. En la segunda fase del estudio de campo se obtuvieron datos del radar de penetración terrestre (GPR, en inglés) con antenas de 50 y de 450 megahercios (MHZ). En las mediciones GPR se recopiló información detallada de las muestras de penetración en un rango desde la superficie a la profundidad en el área de estudio (desde 50 cm a 8 m de profundidad). En todos los resultados de las medidas hechas con los equipos GEM-2 y GPR se encontraron varias anomalías en la distribución de datos de la contaminación por molibdeno. A pesar de que se observaron varias zonas contaminadas, no hay evidencia clara de la fuente de polución encontrada alrededor del pico de contaminación por molibdeno.
Palabras clave: Electromagnetismo, GPR, molibdeno, contaminación.
Introduction:
Molybdenum does not occur naturally as a free metal on Earth, but rather in various oxidation states in minerals. It readily forms hard, stable carbides in alloys, and for this reason most of world production of the element (about 80%) is in making many types of steel alloys, including high strength alloys and superalloys. Most molybdenum compounds have low solubility in water, but the molybdate ion MoO42− is soluble and forms when molybdenum-containing minerals are in contact with oxygen and water. Industrially, molybdenum compounds are used in high-pressure and high-temperature applications, as pigments and catalysts. About 86% of molybdenum produced is used in metallurgical applications such as alloys, with the rest of molybdenum used as compounds in chemical applications (Smallwood, 1984). A congenital molybdenum cofactor deficiency disease, seen in infants, results in interference with the ability of the body to use molybdenum in enzymes. It causes high levels of sulfite and urate, and neurological damage. The cause is the inability of the body to synthesize molybdenum cofactor, a heterocyclic molecule that binds molybdenum at the active site in all known human enzymes that use molybdenum (Smolinsky et al. 2008, Reiss, 2000). Although human toxicity data is unavailable, animal studies have shown that chronic ingestion of more than 10 mg/day of molybdenum can cause diarrhea, growth retardation, infertility, low birth weight and gout; it can also affect the lungs, kidneys and liver (Coughlan, 1983).
Our study area is located nearby both agriculture and industrial environment having some problems about molybdenum contaminations. Therefore, we have conducted electromagnetic based geophysical surveys that are adequately used in environmental studies in the area (Figure 1).
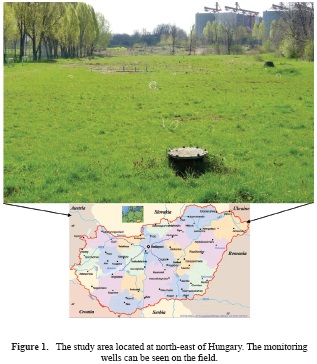
In the figure, some monitoring wells located in the survey area can be seen. These wells have been monitored to acquire information on molybdenum contamination with hydrogeological conditions of the investigated area.
Electromagnetic Survey and Measurements:
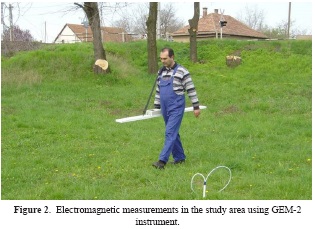
Electromagnetic based survey methods have been successfully applied to large-scale groundwater prospecting, hydrogeological studies, engineering and environmental research, monitoring and imaging subsurface. There have been several important studies and results on the success of GPR, Electrical and Electro-Magnetic based research used in contamination surveys (Cassidy, N.J., 2007, Daniels et al., 1995, Olhoeft, 1992, Nyari and Kanli, 2007, Nyari et.al., 2010). Combining cutting-edge technology with the simplicity of use, the GEM-2 is the finest electromagnetic geophysical method for geological, environmental, and geotechnical shallow-earth surveys. The Geophex GEM-2 electromagnetic (EM) instrument used in our investigation provides a rapid multi-frequency technique for shallow geophysical exploration (figure 2). GEM-2 electromagnetic (EM) instrument that uses an active EM signal to detect variations in subsurface conductivity can provide typical 1.5 ground point spacing and allows a surveyor to collect around 20.000 data points per hour over five frequencies when linked with active GPS tracking. It operates in a frequency range of 330 Hz to 24 kHz, and can transmit an arbitrary waveform containing multiple frequencies. EM currents result in a secondary magnetic field that is measured together with the original transmitted signal by using a receiver coil on the EM instrument. The penetration depth is dependent on various factors but mostly the ground conductivity and the EM wave frequencies (Yaccup and Brabham, 2012), when the quality of data acquired is influenced by the ambient electromagnetic noise. Based on many analyses and field data, we estimate the GEM-2 should be able to see about 30-50 m in very high resistive areas (>1000 ohmm) and some metres or 10 metres in conductive areas (<100 ohmm). The noise level is high in urban areas and low in rural areas. For typical applications, we do not recommend the GEM-2 for depths deeper than 20 m. The GEM2 instrument outputs the ratio of the secondary to the primary field (Hs/Hp) in ppm.
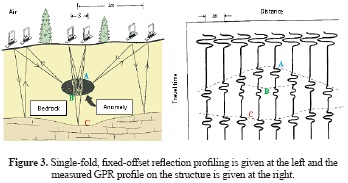
Ground penetrating radar (GPR) is the general term applied to techniques that employ radio waves, typically in the 1 to 1000 MHz frequency range, to map structure and features buried in the ground (or in man-made structures). Historically, GPR was primarily focused on mapping structures in the ground; more recently GPR has been used in non-destructive testing of non-metallic structures. The concept of applying radio waves to probe the internal structure of the ground is not new. Radar systems can be deployed in three basic modes that are referred to as reflection, transillumination and velocity sounding. The most common mode of operation is single-fold, fixed-offset reflection profiling as illustrated in figure 3 (Annan, 2001). This mode of operation gives rise to data such as shown conceptually in the figure. A detailed description of GPR systems, data processing and interpretation can be found in Daniels, 1996, Reynolds, 1997; Daniels, 2004, Jol, 2009, Miller et. al. 2010.
We have carried out electromagnetic measurements in the vicinity of the near surface molybdenum contamination observed in the "Blue Lagoon" plum located in the north-east of Hungary. The aim of the investigations was to delineate and find the origin of the molybdenum pollution, situated in the area, which could be a container or other infrastructure leading to the source of contamination.
The field study:
The field survey was carried out in two stages. In the first phase of measurements, GEM-2 type electromagnetic equipment was used. The data acquisition was in a 100x50 m area that was chosen around the polluted shallow boreholes, parallel to the railway track (Figure 1).
In electromagnetic measurements, conductivity and susceptibility maps are produced for each acquired frequency. Data were gathered at all available frequencies, but below 1 kHz too noisy data were collected. Therefore, we omitted them for reliable interpretation. The interpreted maps, in the frequency range of 1.1 - 42.2 kHz, are given in figure 4. The conductivity and susceptibility values are given for different frequencies.
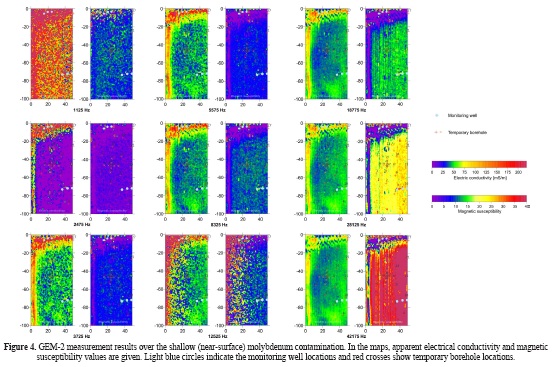
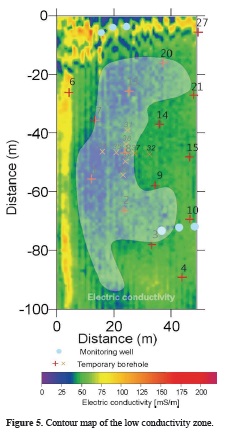
In the maps, the location of the temporary and the monitoring wells can also be seen. Although we were not given the detailed data from the wells, only high content of molybdenum pollution were reported. When the acquired maps are interpreted, an "L" shaped (reversed) anomaly can be identified at the upper end of the maps, along the railway line (on the left), which has high conductivity (low resistivity) and low susceptibility. On the other hand, when compared to their surroundings, three higher conductivity and lower susceptibility anomalies can be identified about ∼2 m long stripes that showing up at different frequencies on the maps at near the well no. 13. Detailed interpretation results also show us that there is a shapeless, low conductivity zone, observed on conductivity maps that can not be seen on the susceptibility maps (Figure 5). The maximum of this zone is located near the high molybdenum concentration. However, there is no any indication that it is connected to some infrastructure.
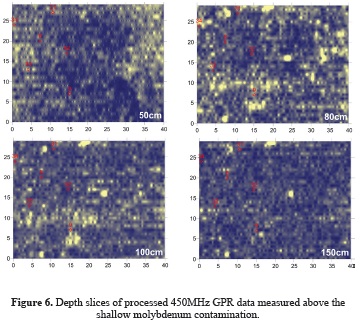
In the second stage of measurements, GPR surveys were carried out in the study area. The aim of this investigation was to find a container or other any geological unit that can be a source of contamination. In geo-radar measurements, two different type of antennas were used, 450 MHz and 50 MHz frequency respectively. During the measurements, the attenuation of the waves was very high with the maximum penetration depth was about ∼1.5 m. The data acquisition was carried out along profiles with 1 m interval. The data was collected in the area among the wells numbered 34, 31, 32 and 33. The spatial sampling rate was less than 10 cm within the sections. In radar measurements, we get some reflections from the border of the materials with different conductivity properties due to the existence of plastic and metal tubes. We processed the sections concerning reflection strength, and the results are sliced at several depth levels. The maps at different depth levels from 50cm to 150cm are given in figure 6.
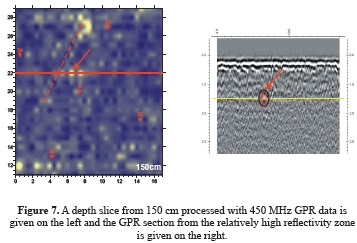
The important anomaly locations highlighted on the slices were searched in details on the individual records to understand the causes of the reflections. As seen on the 1.5 m depth slice, location of the significant anomaly can be recognized. The depth slice with the recorded GPR data is displayed in Figure 7. The reflections, observed on the record, are coloured by transparent red. In the figure, a dashed red line that indicates an anomaly can be observed on all the sections independently.
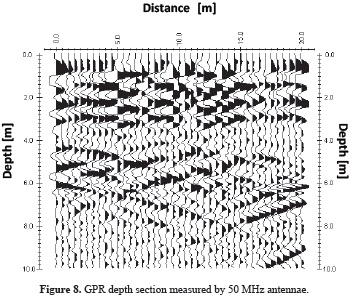
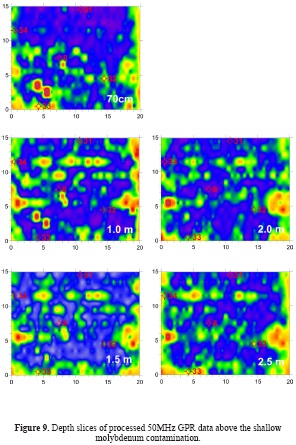
To increase the penetration depth, we recorded GPR data at 50 MHz lower frequency. Due to the lower resolution at this frequency, the attenuation of the electromagnetic waves is also reduced. This low-frequency data give us to investigate deeper strata and subsurface of the study area. Since there are unshielded antennas at these frequencies, the outside effects are more dominant on the records. The hyperbolas appearing deeper than 4 m are obviously the results of external effects given in the profile in Figure 8. We calculated depth slices from the 50 MHz GPR data from 70 cm to 2.5 m depths. The depth slices are given in figure 9. After detailed analysing the individual records, based on the higher amplitude reflections observed on the slices, none of them were found to be the outcome of human activities or the effects of manmade objects.
Conclusions:
We have carried out electromagnetic measurements in the vicinity of the near surface molybdenum contamination observed in the "Blue Lagoon" plum located in the north-east of Hungary. The aim of the investigations is to delineate and find the origin of the molybdenum pollution leading to the source of contamination. In electromagnetic measurements recorded by GEM-2 equipment, conductivity and susceptibility maps are produced for each acquired frequency. The results of the measurements by GEM-2 data, several anomalies are observed indicating the polluted area. The GPR profiles measured by the 450 MHz antenna have high-resolution images and the data gathered with 50 MHz GPR have given us useful information from the deeper parts of investigated area. Verifying the GPR anomalies no buried container or clear manmade sources of molybdenum contamination were indicated in the vicinity of the pollution peak.
Acknowledgments:
The Author, Ali Ismet KANLI, was supported by The Division of Scientific Research Projects of Istanbul University, International Research Projects, Project number: IRP-50242.
The authors would like to thank anonymous reviewers for their constructive remarks in the preparation of the final form of the paper.
References:
Annan, P. (2001). Ground Penetrating Radar Workshop Notes, Sensors & Software Inc., 192 pages. [ Links ]
Cassidy, N. J. (2007). Evaluating LNAPL contamination using GPR signal attenuation analysis and dielectric property measurements: Practical implications for hydrological studies, Journal of Contaminant Hydrology 94, pp. 49-75. [ Links ]
Coughlan, M. P. (1983). The role of molybdenum in human biology, Journal of Inherited Metabolic Disease, 6: 70-77. doi:10.1007/BF01811327. [ Links ]
Daniels, J. J., Roberts, R. and Vendl, M. (1995). Ground penetrating radar for the detection of liquid contaminants, Journal of Applied Geophysics 33, 195-207. [ Links ]
Daniels, D. J. (1996). Surface Penetrating Radar, Radar, Sonar, Navigation and Avionics Series 6. The Institute of Electrical Engineers, London, U.K. [ Links ]
Daniels, D. J. (ed.). (2004). Ground Penetrating Radar, Radar, Sonar, Navigation and Avionics Series 15. The Institute of Electrical Engineers, London, U.K. [ Links ]
Jol, H. M. (ed.). (2009). Ground Penetrating Radar: Theory and Applications, Elsevier, ISBN 978-0-444-53348-7, 524 pages. [ Links ]
Miller, R. D., Bradford, J. D. and Holliger, K. (ed.). (2010). Advances in Near-Surface Seismology and Ground-Penetrating Radar, Geophysical Developments Series No. 15, SEG Reference Publications Program, Tulsa, Oklahoma-USA., ISBN 978-1-56080-224-2, 487 pages. [ Links ]
Nyari, Z. and Kanlı, A. I. (2007). Imaging of Buried 3D Objects by Using Electrical Profiling Methods with GPR and 3D Geoelectrical Measurements, Journal of Geophysics and Engineering, vol.4, p.83-93 [ Links ]
Nyari, Z., Kanlı, A. I., Stickel, J. and Tillmann, A. (2010). The use of non-conventional CPTe data in determination of 3-D electrical resistivity distribution, Journal of Applied Geophysics, vol. 70, issue 3, p. 255-265. [ Links ]
Olhoeft, G. R. (1992). Geophysical detection of hydrocarbon and organic chemical contamination. In: Bell, R. S. (ed.), Proceedings on Application of Geophysics to Engineering, and Environmental Problems. Society of Engineering and Mining Exploration Geophysics, Golden, CO, Oakbrook, IL, pp. 587-595. [ Links ]
Reiss, J. (2000). Genetics of molybdenum cofactor deficiency, Human Genetics 106(2): 157-63. doi:10.1007/s004390051023. [ Links ]
Reynolds, J. M. (1997). An Introduction to Applied and Environmental Geophysics. John Wiley & Sons, Chichester, England. [ Links ]
Smallwood, Robert E. (1984). TZM Moly Alloy, ASTM special technical publication, 849: Refractory metals and their industrial applications: a symposium. ASTM International. p. 9., ISBN 9780803102033. [ Links ]
Smolinsky, B., Eichler, S. A., Buchmeier, S., Meier, J. C. and Schwarz, G. (2008). Splice-specific Functions of Gephyrin in Molybdenum Cofactor Biosynthesis, Journal of Biological Chemistry 283 (25): 17370-9. doi:10.1074/jbc.M800985200. [ Links ]
Yaccup, R. and Brabham, P. (2012). Ground Electromagnetic Survey (GEM-2) technique to map the hydrocarbon contaminant dispersion in the subsurface at Barry Docks, Wales, UK, AWAM International Conference on Civil Engineering (AICCE12) and Geohazard Information Zonation (GIZ 12), Penang, Malaysia, 28-30 August 2012. [ Links ]
