


Serviços Personalizados
Journal
Artigo
 Inglês (pdf)
 Artigo em XML
 Referências do artigo
 Enviar este artigo por email
Indicadores
-
 Citado por SciELO
 -
 Acessos
Links relacionados
-
 Citado por Google
 -
 Similares em
SciELO
Similares em
SciELO -
 Similares em Google
Compartilhar

 Permalink
Earth Sciences Research Journal
versão impressa ISSN 1794-6190
Earth Sci. Res. J. vol.20 no.1 Bogotá jan./mar. 2016
https://doi.org/10.15446/esrj.v20n1.49624
http://dx.doi.org/10.15446/esrj.v20n1.49624
Geospatial Analysis for the Determination of Hydro-Morphological Characteristics and Assessment of Flash Flood Potentiality in Arid Coastal Plains: A Case in Southwestern Sinai, Egypt
Análisis Geoespacial para Determinar las Características Hidromorfológicas y Evaluar las Inundaciones Potenciales en Llanuras Costeras Áridas: Caso de Estudio en el Suroccidente de Sinaí, Egipto
Ahmed Wahid1, Marguerite Madden2, Fikry Khalaf3, and Ibtehal Fathy4
1 Geology Department, Faculty of Science, Port Said University, Port Said, Egypt, postdoctoral Researcher, Center for Geospatial Research; Department of Geography, University of Georgia. Email: awahid@sci.psu.edu.eg;
2 Center for Geospatial Research; Department of Geography, University of Georgia, Athens, Georgia; Email: mmadden@uga.edu
3 Geology Department, Faculty of Science, Port Said University, Port Said, Egypt; Email: fikry_khalaf@hotmail.com
4 Geology Department, Faculty of Science, Suez Canal University, Ismaelia, Egypt; Email: ibtehal_fathy@yahoo.com
Record
Manuscript received: 13/03/2015 Accepted for publication: 18/12/2015
How to cite item
Wahid, A., Madden, M., Khalaf, F., & Fathy, I. (2016). Geospatial Analysis for the Determination of Hydro-Morphological Characteristics and Assessment of Flash Flood Potentiality in Arid Coastal Plains: A Case in Southwestern Sinai, Egypt. Earth Sciences Research Journal, 20(1), E1-E9. http://dx.doi.org/10.15446/esrj.v20n1.49624
ABSTRACT
Coastal plains with a unique geographic setting and renewable natural resources are promising for sustainable development; however, these areas may be subjected to some environmental hazards due to their geological setting. One of those hazards is the seasonal flash flood that can threaten existing and future development projects in such critical areas. Southwestern Sinai, Egypt, is a coastal plain that is characterized by complex geological setting an arid climate with seasonal rainfall which can result in a high runoff. The aim of this work is to model spatially the runoff amount and density related to flash flood development and to create a flash flood hazard map of the plain as an example of coastal plain in a desert environment with large and complex hydrologic setting. In this research, ASTER images are used to develop a digital elevation model (DEM) and land use/land cover (LULC) data sets of the study area. Geographic information system (GIS) was used to perform runoff and flash potential flood analyses of the created databases and to show distributed runoff and flooding potential in spatial maps. A module was created in a GIS environment to develop a flash flood potential index map. It was clear that the main two factors controlling runoff amounts and flash flood potential in such kinds of areas are the slope and soil types. The final dataset map procedure by this work can be very helpful in land use planning by highlighting the areas subjected to flash floods.
Keywords: Flash flood, Remote Sensing, GIS, Hydrology, Geo-environment, DEM.
RESUMEN
Las llanuras costeras que poseen recursos naturales renovables y una configuración geográfica única son promisorias para el desarrollo sostenible. Estas áreas, sin embargo, son objeto de algunas amenazas ambientales debido a su escenario geológico. Una de estas amenazas es la temporada de inundaciones rápidas que pueden poner en riesgo los proyectos de desarrollo existentes y los futuros en estas zonas críticas. El suroccidente de Sinaí, Egipto, es una llanura costera que se caracteriza por su compleja configuración geológica de clima árido, con temporadas de lluvia que pueden resultar en una gran escorrentía. El objetivo de este trabajo fue modelar espacialmente la cantidad y densidad de escorrentía relacionada al desarrollo de inundaciones rápidas y elaborar un mapa de amenazas de inundación rápida en este valle, como un ejemplo de llanura costera en un ambiente desértico con un escenario hidrológico grande y complejo. En este trabajo se utilizaron imágenes ASTER para desarrollar un Modelo de Elevación Digital (DEM, en inglés) y establecer la información de uso del suelo/cobertura del suelo (LULC, en inglés) en el área de estudio. A partir del Sistema de Información Geográfica (GIS) se analizaron la escorrentía y el potencial de inundación de las bases de datos creadas, y se mostró la escorrentía y el potencial de inundación en mapas espaciales. Se creó un módulo en un ambiente del GIS para desarrollar un mapa del índice inundación rápida potencial. Se estableció que los dos factores que controlan la cantidad de escorrentía y el potencial de inundaciones rápidas en estas áreas son la inclinación y los tipos de suelo. El mapa final de procemiento con el conjunto de datos de este trabajo es de gran ayuda en la planeación del uso de suelos, ya que evidencia las áreas con posibilidad de inundaciones rápidas.
Palabras clave: Inundación rápida, teledetección, Sistema de Información Geográfica (GIS), hidrología, geoambiente, Modelo de Elevación Digital (DEM).
1. Introduction
Some of the main applications of hydrologic models are in water resources assessment, irrigation design, prediction of erosion and sedimentation, aquatic ecology, evaluation of climate change impacts and subsurface water contamination (Refsgaard and Abbott, 1996; Ogden et al., 2000). Parameters derived from hydrologic models usually focus on the physical parameters of the catchment area, which as noted by Ogden et al. (2000), is an advantage of such models. One of the significant applications of hydrologic modeling is predicting and monitoring flash floods and their hazard, especially for urban areas and areas planed for development activities.
Flash flood is one of the supreme enemies to mankind in an environment. Flooding is one of the worst weather-related hazard, causing loss of life and excessive damage to property (Carpenter et al., 1999). However, human often place themselves in the heart of risk and human activity is expanding into more hazardous areas, particularly in or next to mountainous regions (Montz and Gruntfest, 2002).
Recently, and because of global climate changes, concern about the flash flood hazard has increased (Habets et al., 1999, Becker and Grunewald, 2003; WMO, 2003, Hattermann, et al and Knebl et al., 2005). Flash flood events in arid regions have a particular behavior, they happen locally, suddenly and in short duration . Commonly, desert storms are highly localized, with only part of a catchment receiving rain and contributing directly to surface runoff along the wadis (valleys) (Foody et al., 2004). In such arid regions, it is important to be concerned about flash flood potential. There are different ways to predict flash floods. The simplest way has been used by the U.S. National Weather Service since it was developed in the 1970s as described by Konstaintine and Georgakakos (2006), that depends on the idea of comparing in real time the observed (for now-casting) and predicted (for forecasting) rainfall volume of a given duration and over a given catchment area. If the nowcast or forecast rainfall volume is greater than the characteristic rainfall volume then flooding in the catchment is likely. In the absence of detailed field measurements, the most appropriate method for predicting the sites subjected to flash flooding is to use a spatially distributed hydrological model (Foody et al., 2004). As, the climate data for the study area is discontinuous since 1967, so that spatial hydrologic modeling is the most favorable way to be used for the study area.
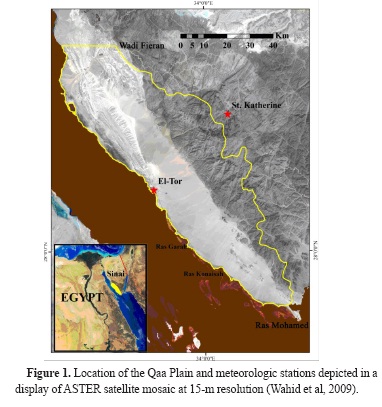
The study area; Southwestern Sinai coastal plain is located between 27 o 45/ -28 o 45/ N and 33o13/ -34 o 10/ E (Figure 1). It is considered one of the most promising areas for sustainable development in Sinai, as it has the main constituents for establishing development projects.
El-Qaa Plain is an elongated coastal plain occupies an area of about 3500 km2 with low-lying land. It contains important natural resources such as a large quaternary groundwater aquifer, sources of constructing and ornamenting materials and rich soils. However, some environmental and anthropogenic circumstances surrounding the plain need to be under considered during decision making for land use planning. There are a considerable number of valleys running over the plain known as wadis. These separate drainage systems are of significant importance to the plain. The plain is associated geologically and environmentally with the south Sinai mountainous ranges and the northern granitic and sedimentary hills. The drainage vallies deliver sediments from the source rocks of the granitic rocks to this coastal gravelly plain. They also represent the main recharging source for coastal groundwater aquifer, which are fed by seasonal floods as surface runoff, or as ground water (Wahid et al, 2009).
Although, land use covers less than 2% of the study area at present, the area is one of the most promising parts of the Sinai for development. The Egyptian government is currently planning to address various development activities and increase the population density of the area. Thus it is important to delineate the flash flood potential index for the area to help decision makers for rational and sustainable land use planning.
Southwestern Sinai has been extensively studied and still remains interesting for different kinds of investigations of geology and stratigraphy (Abdallah,1982; Bunter, 1982; Adawy, 1986), tectonic pattern (Gilboa, 1980; Ibrahim and Ghoneimi, 1992; Meshref and El-Kattan, 1989; McClay et al., 1998) geomorphology and hydrology (El-Refai, 1984; Eweida et al., 1985a and 1985b), hydrogeology (Abdel Rahman et al., 1994; Shendi et al., 1999; Gorski and Ghodeif, 2000; Ghodeif, 2001; Sayed et al., 2004), and soil and mineralogy (El-Assy and Sadek, 1992; Hammad et al., 1998; El Nahry and Saleh, 2005). Recent works have investigated how to use the promising natural resources in this interesting area while being mindful of the potential surrounding hazards. Ghodeif (2001) studied the underground water resources and how to manage and protect them for sustainable development. He used topographic maps and aerial photos to delineate the watershed of the basins recharging the ground water aquifer. El Nahry and Saleh (2005) studied the influence of seasonal flash floods on soil erosion of the plain using Landsat Enhanced Thematic Mapper Plus (ETM+) images and GIS. Wahid (2008) used ASTER images, GIS modeling and programming to model the wind transported sand along the coastline of the Qaa Plain, southwestern Sinai.
Among the huge number of works that studied the study area, none tried to estimate the environmental impact of runoff or assess the flash flood hazard on the existing and expecting areas of development activities. The overall objective of this study is to estimate the level of hazard that can threat such promising coastal plains. The final product of this work is essential for interested agencies of planning and decision makers. This aim is accomplished by defining the hydrologic setting and developing a framework for flash flood potential modeling using the advanced GIS analysis techniques and remotely sensed data.
2. Materials and methods
The ASTER images (level 1b data with 15-m resolution) were used for the present study. Eight scenes were required to cover the study area dated between April 2003 and February 2004. Data was obtained from the U.S. Geological Survey (USGS). ASTER is an instrument on board the Terra (EO-1) satellite platform launched in December of 1999. The Visible Near Infrared Radiometer (VNIR) sensor is a high performance, moderate resolution optical instrument of 15-m spatial resolution. The ASTER raw data were processed using ERDAS Imagine, Leica Geosystem, Inc. and subjected to geometric and radiometric corrections.
Egyptian Military Survey topographic maps (scale 1:50,000) were scanned and geo-referenced to be used along with the ASTER images for extracting the land use /land cover (LULC) of the study area.
Geologic map scale 1: 250,000 from the Egyptian Authority for Mineral Resources were used to delineate the geologic setting of the study area.
Precipitation records of the study area during a 23-year period (from 1980 to 2003) were obtained from the Egyptian Meteorological Authority. Data were derived from the El- Tor and St. Kathrin meteorological stations that are located close to the watershed of the study area(figure 1).
A soil map in the form of a GIS shape file of the study area was obtained from the Egyptian National Authority for Remote Sensing and Space Sciences ( NARSS ) created by El Nahry and Saleh, 2005. For the needs of the present study, some modifications were carried out to this soil map such as spatially extending of some soil types to the parts of the study area that were not in the original map. The eastern granitic mountains were not represented in the original soil map of El Nahry and Saleh (2005). Using the geologic map of the study area, soil types were compared to the geologic rock units in the same site to define the equivalent soil type of the granitic rocks. This lets the missed parts to be filled and presented in the soil map.
Elevation variation of the examined area were produced and presented according to (Wahid et al., 2009) and summarized here after. DEMs extraction process matches the two scenes of ASTER images, nadir-looking VNIR (band 3N) and the backward looking-VNIR (band 3B), on a pixel by pixel basis, notes the parallax and then calculates the relative or absolute height for each image separately and then mosaiced using ERDAS Imagine. The resulting DEM grid has 30-m post spacing resolution. The vertical accuracy assessment were done from collected check points extracted from topographic maps. DEMs of the study area yielded RMSEz of 3± to 15±. This result is considered reasonable and DEMs were not applied to correction.
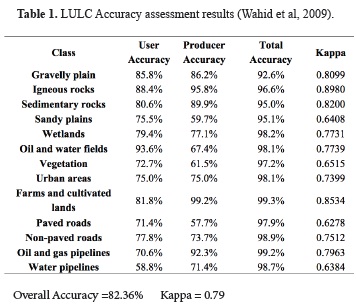
The primary LULC classification scheme used for this work was derived from the Anderson classification system for level I and II (Anderson et al., 1976). In addition to field observation, supervised and unsupervised classification were used for identifying the classes in the study area. Also manual editing were used for small features defined from field work. With the classification for the area complete an accuracy assessment of the final data product was performed using randomly selected field reference points. To overcome reference accessibility issues the random reference sites were generated within a specified distance of existing transportation features. The accuracy is evaluated using computed producer accuracy, user accuracy, overall accuracy and kappa index (Wahid et al., 2009). Almost all errors occurred in the boundary area between different land use /land covers. The overall accuracy is 82.4% and overall Kappa is 0 .79 (Table 1).
2.1. Hydrologic and watershed analysis
The hydrologic parameters were identified using the ArcHydro tool that can be added to ESRI ArcGIS™. The parameters defined for the needs of the present study are; flow directions, flow accumulation, catchment areas, drainage lines and drainage points.
2.2. Curve Number (CN) and runoff
The Curve Number (CN) method is an empirical approach to estimate the direct runoff from the relationships between rainfall, land use and hydrologic soil groups (Lim et al., 2006). The high CN, the low soil infiltration and the high runoff and vise versa. The ArcCN-Runoff tool developed by Zhan and Huang (2004) is used to spatially model the watershed CN and runoff. This tool functions with vector data of LULC and soil of the watershed and is based on the U.S. Department of Agriculture (USDA) Soil Conservation Service (SCS) method for CN calculation (Zhan and Huang, 2004). Precipitation quantities fall over the study area are also required for the calculation.
The procedure for calculating CN and runoff using the ArcCN-Runoff tool involves defining the infiltration of each soil type from its components and physical characteristics according to USDA-Natural Resources Conservation Service (USDA-NRCS, 2007). There are four hydrologic soil groups (A, B, C and D) where soils of the A hydrologic group have high infiltration rates and D soils have the slowest infiltration rates. The clastic constituent of each soil type were defined according to USDA-NRCS, 1999 and then their infiltration rates were delineated. For example, soils that mainly consist of sand and gravel have high rate of infiltration, soils with high percentage of clay and mud have lower infiltration rate, where the hard rocks have no infiltration. Area of study found to include the four types of the soil hydro-groups. The LULC layer was converted to a polygon layer using ArcGIS. The soil and LULC layers were then clipped to the study area and intersected to generate a new composite layer that has the polygon associated with both soil hydro-group and LULC name. The ArcCN-Runoff tool was then applied to calculate the CN and runoff for the study area watershed. Calculation of CN and runoff requires three sets of data: precipitation records, landuse/ land cover (LULC) and soils. The steps of calculating CN and runoff using the CN-Runoff tool is illustrated in Figure 2.
2.3. Creating Flash flood model
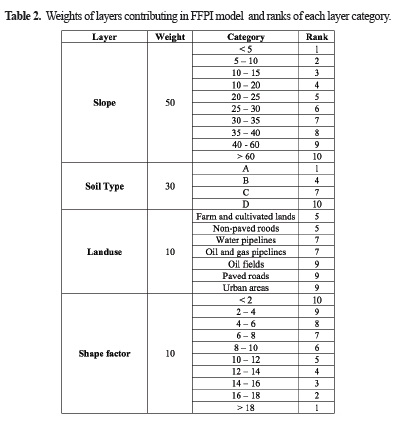
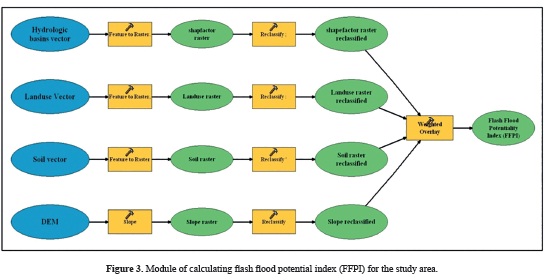
Four sets of gridded data were prepared for this analysis. These data sets are, slope layer derived from 30-m resolution DEM, soil layer, landuse layer and basins shape factor layer (Table 2). DEM is used to prepare the slope grid. The modified soil after El Nahry and Saleh, 2005 is used for soil layer that represents the different types of soils and its filtration capacity. Landuse layer is extracted from classified image and topographic map of the study area. Shape factor is calculated for each basin resulted from Archydro model. Shape factor is calculated as the square of maximum straight-line length of basin (from mouth to water divide ) divided by total area (Jena and Tiwari, 2006). These data sets were then re-sampled to 30-m resolution using a bilinear method. A relative flash flood potential index (rank) ranging from 1 to 10 was assigned to each data layer based on the layer attributes associated with the hydrologic response of each category. Using Model builder in ArcGIS, a module integrating the four data sets was created (Figure 3). The four raster data sets were reclassified according the given rank. For example the slope grid values were reclassified (re-valued) into 10 values as follows: slope 0-5 = 1, 5-10 = 2, 10-16 = 3 and so on (Table 2 ). After giving each category of each layer the appropriate rank, weighting overlay were subjected to the four reclassified layers according to its importance in flashflood occurrence (Table 2).The result of the model is a new grid was thus created that represents the overall flash flood index of the study area. A buffer zone is then created around the highest risk zone as a precaution.
3. Result and discussion
3.1. Geomorphology
There is a close relationship between the geomorphlogical setting and the hydrologic pattern of the study area. The hydrology of the study area is mainly controlled by structural elements defined in shape, size and slope by long term fluvial process during the Pleistocene period. The hydromorphic structure combined with current precipitation controlling factors influence runoff and flash flood in the study area. El-Qaa Plain was and still, is subjected to the process of the fluvial geomorphic cycle for long time intervals (El-Refai, 1984).The effect of extensive amounts of past rainfall precipitation on the area is evident by the aerial distribution of drainage systems, large alluvial fans, abundant terraces and dispersed playa deposits.
According to Wahid et al, 2014, DEM and ASTER stacked VNIR_SWIR image were displayed in ArcGIS ArcScene to show the major geomorphological units of the study area in a 3D terrain view. Several perspective scenes and 'fly-by' simulations were developed showing the study area from different view angles and in different scales (Figure. 4). These views highlight the major geomorphic features described below.
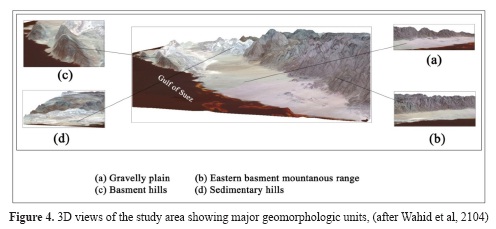
a) The gravelly coastal plain (El Qaa Plain) that extends along the Gulf of Suez and trends in a NW-SE direction parallel to the Suez rift with elevations ranging from mean sea level to 200 meters above sea level (Figure. 4a). It generally slopes to the west towards the Gulf of Suez.
b) Precambrian mountains are represented by the eastern mountainous basement that bounds the eastern part of the study area and is composed of highly fractured igneous and metamorphic basement rocks that are dissected by many wadies and drainage lines (Figure. 4b). The drainage pattern of this unit represents about 80% of the watershed of the study area that drains to the gravelly coastal plain. c) There are some Precambrian basement hills distributed along the northwestern part of the Qaa Plain and other isolated small hills that are scattered in the southern part of the study area (Figure. 4c).
d) Sedimentomorphic units include the sedimentary hilly ranges distributed mostly in the northwestern part of the study area with low elevation and relief and wide spread alluvial beds deposited by wadis dissecting the eastern mountainous unit (Figure. 4d). These wadis drain large amounts of water during floods accumulating rock debris at the mouths of wadis and, accordingly, forming the alluvial deposits called alluvial fans.
3.2. Hydro-morphology and watershed
The study area is a clear example about the relationship between the geologic history of a region and its hydrologic pattern. Hydrology of Southwestern Sinai coastal plain is mainly controlled by two main factors. The first is the structural elements defined in shape, size,slope and fracture density . The second factor is long term fluvial process during the Pleistocene period. The hydrographic basins of the study area are controlled by endogenous and exogenous processes (Hammad, 1980; El Nahry and Saleh, 2005). The endogenous factors are represented by structural lines (faults, domes, synclines, and anticlines along with the variation in lithologic formations). The study area is dominated by two large NW-SE trending fault systems- the Rift Border Fault system and the eastern marginal fault system that defined the locations and the direction of wadis in the eastern granite massive (Gilboa, 1980; Khalil, 1998). The exogenous factor is the environmental conditions that started in the past (Pleistocene fluvial period) and present time conditions as the area was and still, is subjected to the process of the fluvial geomorphic cycle for long time intervals (El-Refai, 1984).The effect of extensive amounts of past rainfall precipitation is evident by the aerial distribution of drainage systems, large alluvial fans, abundant terraces and dispersed playa deposits. By defining the flow directions and flow accumulation, the catchment boundaries (hydrobasins), drainage streams and drainage points were established (Figure 5).
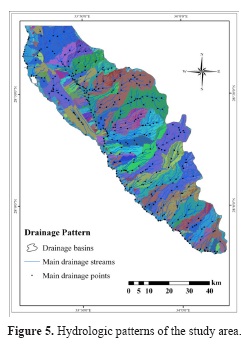
The area of study is characterized by a considerable number of drainage basins. It has 186 drainage basins that vary in area from 0.3 km2 to 264.6 km2 and mostly run in the granitic mountainous range, and some in the sedimentary hills. Drainage pattern refers to the particular plan or design which the individual stream courses collectively form (Thornbury 1969). The drainage patterns of southwestern Sinai are mostly of dendritic and rectangular type, especially in the faulted and jointed mountainous basement rocks.
3.3. Surface runoff
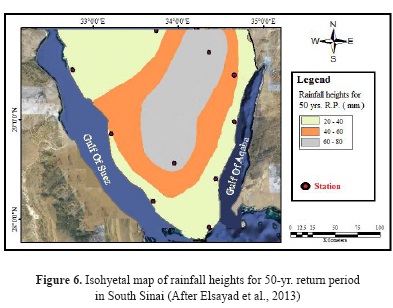
Several works studied the watershed and rainfall analysis of Sinai Peninsula (Issar 1982, Ghodeif 2001, Cools et al 2012,Afandi et al. 2013 and Elsayad et al., 2013). Figure 6 modified after Elsayad et al., 2013 shows that the rainfall heights for 50 years return period is 20 to 60 mm.
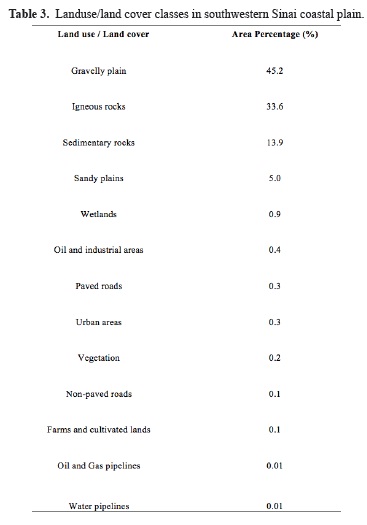
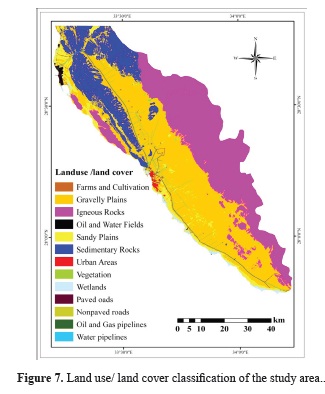
Runoff is the excess amount of rainfall that can accumulate over a drainage basin in a period of time and floods at the outlet of the draining stream of the basin. Estimating the runoff of watersheds is an essential component of flash flood warning systems that is highly dependent upon surface characteristics of the LULC. Table 3 shows the percentage of the area occupied by each of the 13 varieties of LULC (Figure 7). The area of study is mainly covered by gravelly plain (45.2%), igneous rocks (33.6%), sedimentary rocks (14.0%) and sandy plain (5.0%). The remaining land use classes represent less than 2% of the study area.
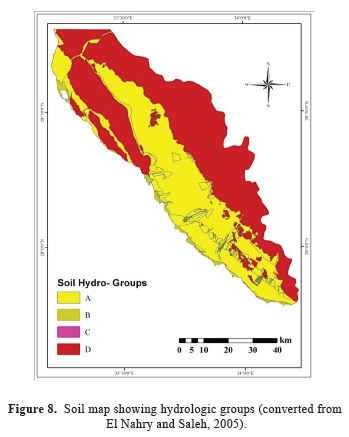
The physical properties of soils also govern the hydrological processes, such as transmission and storage of received water. Figure 8 shows the hydrological soil groups according to the infiltration capacity, where soil A has the highest infiltration rate and D has the lowest rate. The highest infiltration rate occurs within the gravelly plain, while the eastern basement mountainous ranges have the lowest infiltration ability.
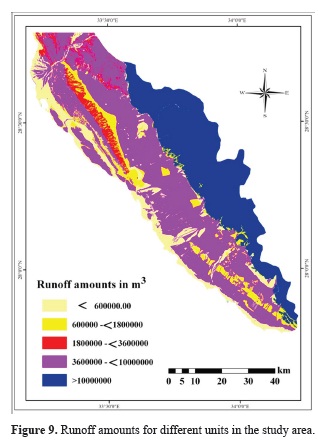
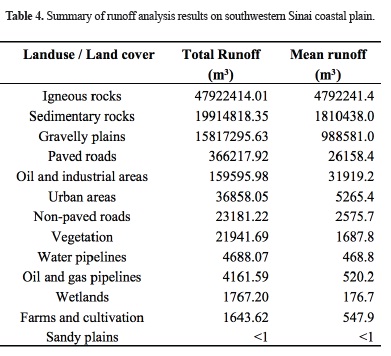
The third factor affecting surface runoff is the climatic conditions. The Sinai Peninsula is generally characterized by a Mediterranean climate, with mild winters and hot summers, relatively low precipitation and high evaporation. Study area receives rare, but sometimes noticeable and irregular, amounts of rainfall mainly in winter and autumn where summer is a dry season (JICA, 1999; Ghodeif, 2001). The analysis of the annual rainfall data of El-Tor and St. Katherine Stations shows that, the mean annual precipitation varies from about 9 mm at El-Tor to 33 mm at St. Katherine. The maximum quantity of rainfall that fell in one day since 1980 until 2003 was 37.1 mm on May 27, 1995. This value (37.1mm) was used in the runoff calculation to determine the highest volume of runoff in case of the maximum rainfall recorded amount.CN values range from 30 to 98 with average 78, while runoff values vary between 0 and 479,224,14.0 m3 with average 609,468.8 m3 (Figure 9 and Table 4). The highest CN and runoff values are noticed in the eastern mountainous basement heights in contrast to coastal areas and gravelly plains. Also, there is a dramatic decrease in runoff production when moving from the eastern mountainous areas to the coastal sandy plain in the west .This refers to the absence of connection between runoff production zones, and a partial down-slope re-infiltration of the runoff (Bergkamp, 1998; Braud et al, 2001). It emphasizes the fact that areas close to the heights are more subjected to receiving more water from the drainage streams to store or to flush away, whereas the coastal zone absorbs all or most of the rainfall and does not receive much water from the high runoff areas.
3.4. Flash flood potential index map
A flash flood is generated when precipitation saturates the drainage capacity of the basin slope causing impoundment of the drainage network and resulting in exceptionally high discharge amounts at the basin's outlets. (Carpenter et al., 1999; Al-Rawas et al., 2001; Montz and Gruntfest, 2002; Rosso and Rulli, 2002). The study area is located in an arid area and receives small amounts of precipitation. However, seasonally intensive rainfall, along with its geological and geomorphological settings, creates potential flash flood hazards in the area. In 2004, an extreme rainfall happened over the study area and caused some damage of properties.
The flash flood potential index is an indicator of the hydrologic response of an area to the intense rainfall in its watershed. This index helps in predicting the flash flood prone areas and planning development accordingly. The higher rank values of index point to the high hydrologic response for flash flood potential and threat. Factors contributing to flash flooding in an area depend on the physiographic characteristics of its watershed. Slope is an important factor in the momentum of the flood velocity . Also, a basins geometry reflects the way that runoff will move toward the outlet. A comprehensive study conducted in three selected sites in the Egyptian desert suggests that circular basins create flash floods with sharp discharge peaks (quick flow), whereas elongated basins are generally characterized by slower flood-water flow (Al-Rawas et al., 2001).
Soil structure and texture are important in determining water holding and infiltration characteristics. Land use practices can play a significant role in water infiltration, concentration and runoff behavior. The concept of creating this flash flood index is to analyze these characteristics together to derive information about the hydrologic response and flash flood potential inherent to a specific area.
The produced flash flood index map (Figure 10) shows that the areas of highest risk are those close to the eastern mountainous ranges, followed by those close to the northern sedimentary heights. The safest area is the part close to the sea.
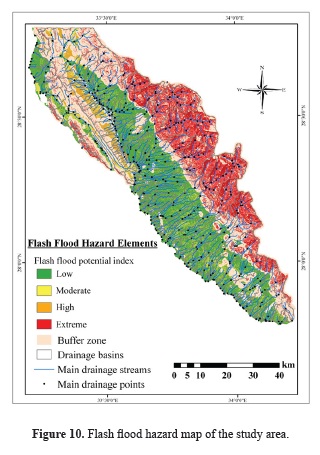
It is important to point out that slope is the most effective factor in defining the flood potential index. The slope of the study area gradually changes eastward. This makes the runoff move out strongly in the eastern side where the slope is very steep. This could be very dangerous for any development activities built close to this high flood potential index. In addition, the high infiltration soils of the low land infiltrate the incoming water faster and reduce runoff possibility, whereas, the impervious rocks of high mountainous areas in the east and north increase the possibility of runoff. Shape factor results shows that most of the basins of the watershed are elongated and basins of high shape factor values are those of very small areas. The least effective factor is the landuse factor, as it covers a very small area of the study area.
The flash flood hazard map (Figure 10) contains the flash flood potential index, buffer zones around the high index areas, boundary of each basin, main drainage streams and points. The hazard map can help national and international agencies interested in landuse planning and sustainable development to make the right decisions in establishing development projects.
4. Conclusions
Coastal plains could are promising area for sustainable development activities as long as the existing resources are managed wisely and development proceeds in a planned and organized manner. Southwestern Sinai coastal plain is an example of these promising areas. However, its geological and morphological characteristics along with the climatic conditions are responsible for seasonal flash floods that may threat the landuse planning in this area. It is very important for landuse planning to illustrate in detail the hydro-morphological setting of such kinds of area and define the spots prone to flash floods (Montz and Gruntfest, 2002). For more accurate results, ASTER images were used to create a DEM with 30-m resolution and LULC cover maps with a resolution of 15 m, along with field work. Although the study area is arid, intensive seasonal rainfall can cause catastrophic flash floods. The geomorphological parameters of this area defines its drainage pattern, with the highest amount of originating runoff flows from the eastern basement rocks followed by the northern and northeastern sedimentary hills. Slope is the most effective factor in defining the flash flood index along the study area. The most area subjected to flash floods is that closest to the eastern side where the slope is very steep, the soils are impervious and flooded water can flush the sediment and boulders through the drainage streams. Coastal zone is mainly composed of sandy and gravelly sediments. This makes this zone the safest from flash hazards because of the high infiltration capacity of the gravelly and sandy sediments forming this gentle slope plain.
The results of this work are very important for sustainable development of the coastal plains close to rocky heights, because spatially explicit flash flood hazard is very critical for landuse planning of infrastructure, water management and establishment of new residential and tourism areas. Using this map, it is easy to find the suitable sites for running roads and pipes (oil or water) far from the floodhazards . Also it can help in groundwater management, as it can be used to find the best locations for building dams to preserve surface water for ground water recharging. Future work to improve the accuracy and detailed of flash flood potential may require additional spatial factors such as distance from urban and economic areas and proximity to main streamlines. GIS modeling of risk from natural disasters before development plans are initiated to management planners and decision makers hopes to prevent loss of life, damage to property and ecological impacts.
Acknowledgements
Authors would like to express appreciation to Professor E. Lynn Usery, U.S. Geological Survey (USGS) for providing the ASTER images. We acknowledge with sincere appreciation Dr. Ned Gardiner, American Museum of Natural History for technical support in extracting the DEMs of the study area. We also appreciate the support of the staff of the Center for Geospatial Research; Department of Geography, University of Georgia.
References and Notes
Abdallah, M.A., 1982. Straigraphy of the Miocene Deposits of the El-Qaa Plain, West Southern Sinai, Egypt, M.Sc Thesis, Faculty of Science, Ain Shams University. Cairo, Egypt. [ Links ]
Abdel Rahman, S. I., Zagloul, E.A., Younes, H.A., 1994. Evaluation of land and water resources of El-Qaa plain, South Sinai, for sustainable agriculture, Agro. Kemia E's Talajtan, Budapest. 43 (3-4), 408-414. [ Links ]
Adawy, H.F., 1986; Geophysical interpretation of Qaa Plain Area, Gulf of Suez, MS.c, Faculty of Science, Cairo University, Egypt. [ Links ]
Al-Rawas, G., Koch, M., and El-Baz, F., 2001. Using GIS for flash flood hazard mapping in Oman, Earth Observation Magazine. 10 (8) 18-20. [ Links ]
Anderson, J.R., Hardy, E.E., Roach, J.T., Witmer, R. E., 1976. A Land Use and Land Cover Classification System for Use with Remote Sensor Data. United States Government Printing Office. Washington D.C. [ Links ]
Becker, A., Grunewald, U., 2003. Flood risk in central Europe, Science, 300 (5622),1099. [ Links ]
Bergkamp, G., 1998. A hierarchical view of interactions of runoff and infiltration with vegetation and micotopography in semiarid srublands. Catena 33, 201-220. [ Links ]
Braud, I., Vich, A. I. J., Zuluaga, J., Fornero, L. and Pedrani, A., 2001. Vegetation influence on runoff and sediment yield in the Andes region: observation and modeling, Journal of Hydrology. 254, 124-144. [ Links ]
Bunter, M.A., 1982. Surface and subsurface geology of the Qaa Basin, southwest Sinai, 6th Egyptian General Petroleum Corporation, Petroleum Exploration and Production Conference, Cairo, Egypt. 414-436. [ Links ]
Carpenter, T.M., Sperfslage, J.A., Georgakakos, K.P., Sweeney, T. and Fread, D.L, 1999. National threshold runoff estimation utilizing GIS in support of operational flash flood warning systems, Journal of Hydrology. 224, 21-44. [ Links ]
Cihlar, J., 2000. Land cover mapping of large areas from satellites: status and research priorities. International Journal of Remote Sensing, 21, 1093-1114. [ Links ]
Cools, J., Vanderkimpen, P., El Afandi, G., Abdelkhalek, A., Fockedey, S., El Sammany, M., Abdallah, G., El Bihery, M., Bauwens, W., and Huygens, M.: An early warning system for flash floods in hyper-arid Egypt, Nat. Hazards Earth Syst. Sci., 12, 443-457, doi:10.5194/nhess-12-443-2012, 2012. [ Links ]
El-Assy, I.E. and Sadek, A., 1992. Geology and radioactivity of some phosphrite beds, east El-Qaa plain, Sinai, Egypt. 1st International Conference of Geology of the Arab World, Cairo Univ., Cairo, Egypt. 2, 467-478. [ Links ]
El Nahry, A.H., and Saleh, A. M., 2005. Using remote sensing and GIS techniques for identifying influence of seasonal flashfloods on El-Qaa plain, south Sinai, Egypt, The 31st International Symposium on Remote Sensing of Environment : Global Monitoring for Sustainability and Security, June 20-24, 2005, St. Petersburg, Russia. [ Links ]
El-Refai, A. A., 1984. Geomorphological and hydrological studies on EL-Qaa plain, Gulf of Suez, Sinai, Egypt, M.Sc. Thesis, Faculty of Science, Cairo University. [ Links ]
Elsayad, M. A, Sanad, A. M, Kotb, G and Eltahan, A. H., 2013 Flood Hazard Mapping in Sinai Region, Global Climate Change, Biodiversity, and, Sustainability Conference, Arab Academy for Science, Technology and Maritime Transport April 15 to 18, 2013. [ Links ]
Erdas, 2003. ERDAS Field Guide, 7th ed., Atlanta: ERDAS, Inc. [ Links ]
Eweida, E.A., El-KiKi, F.E., and El-Refai, A.A., 1985 a. Hydrological features of El-Qaa Plain, Sinai, Egypt, 4th Symposium on the Quaternary and Development in Egypt. [ Links ]
Eweida, E.A. El-KiKi, F.E., and El-Refai, A.A.; 1985 b. Hydrogeochemistry of the Quaternary Aquifer at El-Qaa plain, Sinai, Egypt, 4th Symposium on the Quaternary and Development in Egypt. [ Links ]
Foody, G.M. Ghoneim, E. M. and Arnel, N.W., 2004. Predicting locations sensitive to flash flooding in an arid environment. Journal of Hydrology. 292, 48-58. [ Links ]
Gamal El Afandi, Mostafa Morsy, and Fathy El Hussieny, Heavy Rainfall Simulation over Sinai Peninsula Using the Weather Research and Forecasting Model, International Journal of Atmospheric Sciences, vol. 2013, Article ID 241050, 11 pages, 2013. doi:10.1155/2013/241050. [ Links ]
Ghodeif, K., 2001. Management and Protection of ground water in El-Qaa Plain, Sinai, Egypt. Ph.D. Dissertation, Geology Institute, Adam Mickiewicz University, Poznan, Poland. 193 p. [ Links ]
Gorski, J., and Ghodeif, K., 2000, Salinization of shallow water aquifer in El-Qaa Costal plain, Sinai, Egypt. 16th SWIM, Wolin Island, Poland. [ Links ]
Gilboa, Y., 1980. Post Eocene clastics distribution along the El-Qaa plain, southern Sinai, Israeli . Journal of Earth Science. 29, 197-206. [ Links ]
Habets F, Noilhan J, Golaz C, Goutorbe JP, Lacarr'ere P, Leblois E, Ledoux E, Martin E, Ottl´e C, Vidal-Madjar D. 1999. The ISBA surface scheme in a macroscale hydrological model applied to the Hapex-Mobilhy area. Part I: Model and database. Journal of Hydrology 217: 75-96. [ Links ]
Hammad, F.A., 1980. Geomorphological and hydrological aspects of Sinai peninsula, Annals of geological Survey of Egypt. X, 807-817. [ Links ]
Hammad, M.A., Hussein, M.A., Attawiya, M.Y. and Amer, A.M., 1998. Morphological and mineralogical studies of some soils, in El-Qaa plain - south Sinai, Al-Azhar Journal of Agricultural Research. 28, 195-217. [ Links ]
Hattermann, F. F., Wattenbach, M., Krysanova, V. and Wechsung, F. (2005), Runoff simulations on the macroscale with the ecohydrological model SWIM in the Elbe catchment-validation and uncertainty analysis. Hydrol. Process., 19: 693-714. doi: 10.1002/hyp.5625. [ Links ]
Ibrahim, S. A. and Ghoneimi, A. E., 1992. Subsurface configuration of southwest Sinai from potential field data, Proc. 3rd Conference Geological Sinai Development, Suez Canal University, Ismailia. 27-36. [ Links ]
Issar, A. and D. Gilad, 1982. Ground Water Flow Systems in the Arid Crystalline Province of Southern Sinai. Hydrological Sciences Journal, 27, 305-325. [ Links ]
Japan International cooperation Agency (JICA), 1999. South Sinai groundwater resources study in the Arab Republic of Egypt, Report. [ Links ]
Jena, S. K., Tiwari, K. N., 2006. Modeling synthetic unit hydrograph parameters with geomorphologic parameters of watersheds. Journal of Hydrology. 319, 1-4, 1-14 [ Links ]
Jensen, J.R. (1996): Introductory digital image processing: A remote sensing perspective: Prentice Hall, Upper Saddle River, New Jersey, 107-124. [ Links ]
Khalil, S., 1998; Tectonic Evolution of the eastern margin of the Gulf of Suez, Egypt, Ph.D. Thesis, Royal Holloway, University of London. [ Links ]
Knebl, M.R., Yang, Z.-L., Hutchison, K., and Maidment, D.R., 2005. Regional scale flood modeling using NEXRAD rainfall, GIS, and HEC-HMS/RAS: a case study for the San Antonio River Basin Summer 2002 storm event, Journal of Environmental Management. 75, 325-336. [ Links ]
Konstantine P. and Georgakakos, 2006. Analytical results for operational flash flood guidance, Journal of Hydrology. 317, 81-103. [ Links ]
Lim, K.J., Engel, B. A.., Muthukrishnan, S., and Harbor, J., 2006. Effects of initial abstraction and urbanization on estimated runoff using CN technology, Journal of the American Water Resources Association. 42 (3), 629-643. [ Links ]
McClay, K.R., Nichols; G.J., Khalil, S., Darwish, M., and Bosworth, W., 1998, Extensional tectonics and Sedimentation, eastern Gulf of Suez, Egypt. In Purser, B and Bosence., D.W.J.B. (eds), Sedimentation and tectonics of Rift Basins; Red Sea-Gulf of Aden, chapman and Hall, London. 223-238. [ Links ]
Meshref, W. M. and El-Kattan, M.I., 1989; Tectonic pattern of El-Qaa plain, Sinai using Aeromagnetic data, proc. 2nd conference Geology of Sinai for Development, Ismailia. 33-42. [ Links ]
Montz, B. E., Gruntfest, E., 2002. Flash flood mitigation: recommendations for research and applications, Environmental Hazards. 4, 15-22. [ Links ]
Ogden, F.L., Sharif, H.O., Senarath S.U.S, Smith J.A., Baeck, M.L. and Richardson, J.R., 2000. Hydrologic analysis of the Fort Collins, Colorado, flash flood of 1997. Journal of Hydrology, 228, 82-100. [ Links ]
Refsgaard, J.C. and Abbott, M.B., 1996. The role of distributed hydrological modelling in water resources management. In: Distributed Hydrological Modelling, M.B Abbott and J.C. Refsgaard (Eds.), Kluwer, the Netherlands. 1-16. [ Links ]
Rosso, R. and Rulli, M., C., 2002. An integrated simulation method for flash-flood risk assessment: 2. Effects of changes in land-use under a historical perspective, Hydrology and Earth System Sciences. 6 (3), 285-294. [ Links ]
Sayed, M. A. A., El-Fakharany, M. A., Hamed, M. F., 2004. Integrated Geophysical and Hydrogeological Studies on the Quaternary Aquifer at the Middle Part of El Qaa Plain, SW Sinai, Egypt,Egyptian Geophysical Society Journal. 2 (1), 135-145. [ Links ]
Shendi, A. H., Ghoneimi, A. E. and Gemail, K. M., 1999. Discovery of promising fresh water aquifer in the downstream parts of Wadi Isla-Wadi Garf, El-Qaa plain, SW Sinai, Journal of Environmental Research. 1 (1), 105-123. [ Links ]
Soil Survey Staff. 1999. Soil Taxonomy Second Ed: A basic system of soil classification for making and interpreting soil surveys. USDA-NRCS Agriculture Handbook No. 436. [ Links ]
Thornbury, W.D.,1969. Principles of Geomorphology, John Willy & Sons. New York. [ Links ]
USDA-NRCS. 2008. National Soil Survey Handbook, title 430-VI. [Online] Available: http://soils.usda.gov/technical/handbook/. [ Links ]
Wahid, A. M (2008) GIS-Based Modeling of Wind-Transported Sand on the Qaa Plain Beach, Southwestern Sinai, Egypt. Journal of Coastal Research: Vol. 24, No. 4 pp. 936-943. [ Links ]
Wahid, A., Madden, M., Khalaf, F., and Fathy, I., 2009. Land Suitability Scenarios for arid coastal plains using GIS modeling: Southwestern Sinai coastal plain, Egypt, Journal of Urban and Environmental Engineering (JUEE), v.3, n.2, p.73-83. [ Links ]
Wahid, A., Madden, M., Khalaf, F., and Fathy, I.,2014, Geospatial Analysis for Determination of the Geomorphologic Forms in Southwestern Sinai Coastal Plain, Egypt. International Journal of Geosciences and Geomatics, Vol.2, Issue 1, 2014. [ Links ]
WMO (World Meteorological Organization), 2003. Our Future Climate (Publication WO-952). [ Links ]
Zhan, X., and Huang, M., 2004. ArcCN-Runoff: an ArcGIS tool for generating curve number and runoff maps, Environmental Modelling and Software. 19, 875-879. [ Links ]

