


Services on Demand
Journal
Article
 English (pdf)
 Article in xml format
 Article references
 Send this article by e-mail
Indicators
-
 Cited by SciELO
 -
 Access statistics
Related links
-
 Cited by Google
 -
 Similars in
SciELO
Similars in
SciELO -
 Similars in Google
Share

 Permalink
Earth Sciences Research Journal
Print version ISSN 1794-6190
Earth Sci. Res. J. vol.20 no.1 Bogotá Jan./mar. 2016
https://doi.org/10.15446/esrj.v20n1.43128
http://dx.doi.org/10.15446/esrj.v20n1.43128
The effects of ex-situ oil shale mining on groundwater resources in Siwaqa area, southern Jordan, using DRASTIC index and hydrochemical water assessment
Efectos en las fuentes de agua subterránea de la minería ex situ de esquistos bituminosos, en el área de Siwaqa, al sur de Jordania, a través del índice DRASTIC y la evaluación hidroquímica del agua
Alsharifa Hind Mohammad, Omid Alkurdi, Elias Salameh
The University of Jordan, Jordan.
s.jasem@ju.edu.jo
Record
Manuscript received: 24/042014 Accepted for publication:08/01/2016
How to cite item
Mohammad, A. H., Alkurdi, O., & Salameh, E. (2016). The effects of ex-situ oil shale mining on groundwater resources in Siwaqa area, southern Jordan, using DRASTIC index and hydrochemical water assessment. Earth Sciences Research Journal, 20(1), F1-F8. doi: http://dx.doi.org/10.15446/esrj.v20n1.43128
ABSTRACT
Energy resources in addition to water resources are the most limited resources in Jordan, being one of the fourth poorest countries in water resources, and limitation of surface water resources put huge pressure on groundwater which is the main resource there. High expenses and the increasing prices of oil over all worlds increase the feasibility to mining the oil shale that exists in southern Jordan area, Siwaqa. This study took place to clarify the possible effects of mining and energy production activities on the water resources in that area. Groundwater vulnerability mapping was done for many areas all over the country, including this part. The initiative of this work is to determine the vulnerability under the conditions of removing the bedrock of the oil shale which is described as a confining layer. Results that are obtained by this work conclude that the oil shale area becomes highly vulnerable to the human activities because of the existing geological structures while it is small and medium vulnerable in the fields in which there are no geological structures. In addition to the structural features and adding the possibility of the oil shale mining from the outcropped areas which will decrease the depth to water table and hence will affect the vulnerability values.
Keywords: Oil shale, ex-situ mining, groundwater, vulnerability, DRASTIC.
RESUMEN
Las fuentes de energía y agua son las más limitadas en Jordania, uno de los cuatro países más pobres en recursos hídricos; además, las limitadas fuentes superficiales hacen de las aguas subterráneas las más importantes. Las ganancias y el precio del petróleo, por su parte, incrementan la viabilidad de la minería de esquistos bituminosos en el sur de Jordania, en la región de Siwaqa. Este estudio se realiza con el fin de establecer los posibles efectos de las actividades de producción de energía y minería en las fuentes hídricas de la zona. Se elaboró un mapa de vulnerabilidad para las fuentes de agua subterránea en varias regiones del país, incluida el área de estudio. La iniciativa de este trabajo es determinar la vulnerabilidad si se remueve el lecho rocoso del esquisto bituminoso, que funciona como una capa de confinamiento. Los resultados obtenidos evidencian que el esquisto bituminoso se torna bastante vulnerable a las actividades humanas debido a la presencia de estructuras geológicas, mientras que su vulnerabilidad es media o baja en aquellos lugares donde no hay estructuras geológicas. Además de los rasgos estructurales, existe la posibilidad de que la minería del esquisto bituminoso en las áreas de afloramiento podría descender hasta la capa freática y allí afectar los valores de vulnerabilidad.
Palabras clave: Esquisto bituminoso, minería ex situ, aguas subterráneas, vulnerabilidad, DRASTIC.
Introduction
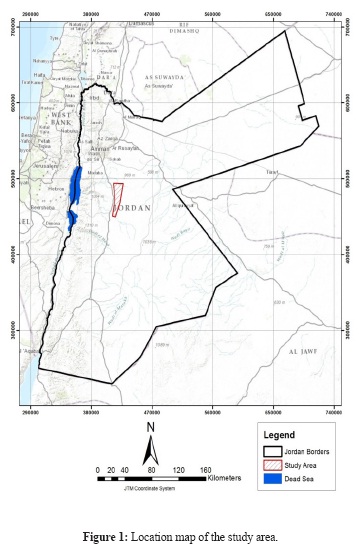
Having independent energy resources increases the stability of a country and lessens its dependence on exterior resources and boosts the economy. Jordan, aiming for such goals, tries to enter a new phase of energy development and raw material acquisition which can be seen in the increased number of mining concessions granted to numerous major companies throughout the country, especially in the central part of Jordan, to extract oil shale from their deposits there, Figure 1.
The main issue which faced and is still facing Jordan during the last decades is the urgent need to protect the groundwater resources in quality and quantity. Vulnerability studies represent the most important protection actions to sustain these resources for present and future generations. (Mohamad; 2014)
The increasing interest in new sources of energy both renewable and non-renewable has also hastened the process of explorations and also mining for these resources. Mining processes, products and byproducts could have serious repercussions on the environment if these issues are not studied and treated accordingly. Jordan, in the most part, is considered to have arid climate with little influence of semi-arid climate in small parts of the country, making the country short in water resources much like other countries that fall under the same climatic conditions. Being a country that is poor in water resources there must be a need to be aware of any developments in the water situation, and water characteristics, and quality changes of both surface and ground water which are of high importance. Protecting these resources from all kinds of pollution becomes an important task. Therefore, the new mining Oilshale and other resources must be adequately studied on their effects on water resources both from qualitative and quantitative aspects (Luck, 2008).
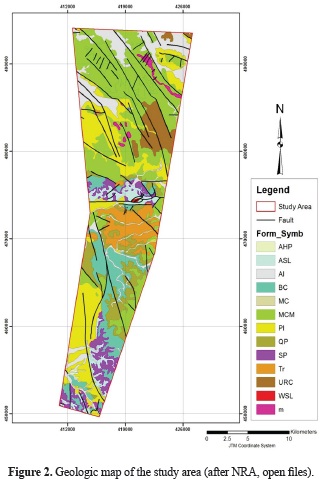
The rocks found in the area belong to the most upper deposits of the upper Cretaceous of Jordan. Following is a brief description of the geologic formations cropping out in the study area and of relevance to the present study (Table1 and Figure 2). The Ajlun Group overlies the Kurnub Group, and includes all the marine sediments which mainly consists of limestone, dolomite, marl, shale and sandstone and is subdivided into five formations; Na'ur Formation which consists mainly of limestone, gray and pink in color, hard crystalline coarse-grained and fractured, and is considered as a poorly developed aquifer with a thickness ranging from 200 to 230 m (Bender, 1968). Fuhais formations which consists of marl, limestone, marly limestone and shale, and is considered as a semi aquifer with a thickness of 60-80 m (Mc Donalds, 1965). Hummar formation; this Formation forms an important lower good aquifer generally consisting of limestone and dolomitic limestone. Generally, the thickness of this Formation is between 30 and 60 m. Shueib Formation this formation acts as an aquiclude between Hummar and Wadi As-Sir Aquifers in the groundwater basin with a thickness of about 200 m, mainly consisting of marl and marly limestone (Mc Donalds, 1965). Wadi As-Sir Formation; this formation acts as a good aquifer. It covers the minor part of the study area and consists of about 100 m thick bedded limestone with chalky limestone interactions and occasional chert beds and nodules (Mc Donalds & partners, 1965).
Belqa Group was firstly named by Quennell (1951) and was divided into five formations of predominantly limestones and chalks showing partly high amounts of chert and phosphate; Wadi Umm Ghudran Formation which is considered as an aquitard, it is composed of white chalk, chert, and microcrystalline limestone concretions with phosphatic chert, with an average thickness of about 20 m (Mc Donalds, 1965). In places, this formation is missing and the overlaying formation Amman Silicified Limestone directly overlays the underlying formation of Wadi As-Sir Formation; then Amman Silicified Limestone Formation is found; lithologically, this Formation is composed of dark gray to brown chert intercalated with limestone. The chert is micro fractured and brittle deformation is found in this Formation. Marl and chalky dolomite laminas are found an addition to some phosphate granules in the most upper parts (Mc Donalds, 1965). This Formation is exposed in the central parts of the area and in a remarkable outcrop to the north of the Swaqa town. The thickness of the Formation is around 50 m. This Formation forms a good aquifer in the northwestern part of the country including the study area.after that; Al Hasa Phosphorite Formation which is composed of phosphatic chert, phosphatic limestone, phosphate, chalky limestone, micritic limestone, marl, with the presence of Oysters shells. It is widely exposed in the northern parts of the area, and extends to most eastern and western parts of the northern part of the area. The Formation thickness is around 60 m in the study area. Together with the overlying Amman Silicified it forms a good aquifer. Muwaqqar (Chalk Marl) Formation this is composed of marl, chalky limestone, micritic limestone and chert. Oil shale forms the lower parts of this Formation. It crops out in some central parts of the area in addition to the southern parts of the study area. Generally it underlies the whole study area with a thickness ranging from 200 to 300 m. then; Umm Rijam Formation This Formation consists mainly of brown chert, chalk, and chalky limestone. It is exposed in a small part of the study area to the east, and has a thickness of about 70 m in the study area. overthat, Superficial Deposits are exists due to the relatively high relief in the study area the activities of surface water widely deposited quaternary superficial deposits including the following types Fluviatile and lacustrine gravels; these sediments comprise coarse grained sand and sub angular to sub rounded gravels of chert, limestone, dolomite, dolomitic limestone, sandstone and basalt (Shawabekeh 1998). these sediments are found as cemented layers or friable sediments and can be found widely distributed in most parts of the study area where the topography is gentle. And Calcrete (Caliche) which covers some parts of the study area, Calcrete developed preferentially over the calcareous rocks in the presence of soil moisture evaporating and depositing the Caliche. The thickness of Caliche over the study area is generally less than or around 1m (Alali, 2006).
Ground water vulnerability assessment was carried out for the Wadi AsSir aquifer unit, to provide further understanding of the environmental risks and probability of pollution for this aquifer, the following is a brief summary of for the index that was used in this study.

Methodology and data processing:
Groundwater vulnerability is an overlay method that is used to determine the ability of pollutants to penetrate to the target aquifer and to harm it. This method helps decision makers by shedding light on pollution areas expected to pollute groundwater aquifers as caused by human activities on the ground surface. In Jordan, groundwater is the main water resource the country uses to match its demand, (Mohammad, 2015). DRASTIC is an overlay and indexing method which is widely used to assess groundwater vulnerability to a wide range of potential contaminants. Merchant (1994) argued that DRASTIC has been used throughout the world with exceptional frequency. In this model, spatial datasets on Depth to groundwater Recharge by rainfall, Aquifer type, Soil properties, Topography, Impact of the vadose zone and the hydraulic Conductivity of the aquifer are combined (Engel et al., 1996).
According to Aller et al., (1987) the DI vulnerability index can be calculated according to the following equation:
DI = DwDr + RwRr + AwAr + SwSr + TwTr + IwIr + CwCr
Where:
Dr = Rating to the depth to water table, Dw = Weight assigned to the depth to water table.
Rr = Rating for ranges of aquifer recharge, Rw = Weights for the aquifer recharge.
Ar = Rating assigned to aquifer media, Aw = Weight assigned to aquifer media.
Sr = Rating for the soil media, Sw = Weight for soil media.
Tr = Rating for topography (slope), Tw = Weight assigned to topography.
Ir = Rating assigned to vadose zone, Iw = Weight assigned to vadose zone.
Cr = Rating for rates of hydraulic conductivity, Cw = Weight given to hydraulic conductivity.
The D factor; Depth to water table:
Depth to the water is the distance between the ground surface and the groundwater table. The water level map is prepared by interpolating well information obtained from the Water Authority of Jordan. These data present a D factor map indicating the water table.
The rating for D decrease with increasing depth. The most vulnerable D rates are pixels which are located in areas with the lowest depth to water table and therefore higher potential to contamination. The rating of different depth intervals are shown in Table 2.

Net Recharge - the "R" factor:
Precipitation is the primary source of groundwater because priciptation rates ifiltrates through the ground surface and percolates down to the water table. Net recharge represents the amount of water per unit area of land which penetrates the soil cover and reaches the water table. Recharge water is the principle vehicle for leaching and transporting contaminants vertically into the groundwater and horizantally within the aquifer. Arears with higher rainfall amounts pose higher potential and more vulnerable effects on the aquifer. Many parameters affect the R factor. These parameters are rainfall and evaporation and finally permeability, soil retention and thickness of the soil (Piscopo, 2001).
Components and there corresponding values and standardized values are shown in Tables 2.
Aquifer media - the "A" factor:
This factor refers to the type of the layer that contains water whether it is consolidated or unconsolidated rock serving as aquifers (sand and gravel or limestone). The large grain size and the presence of fractures or openings within the aquifer lead to higher permeability and lower attenuation capacity of the aquifer media; for aquifer media e.g. massive shale (low permeability) or sand and gravel (very high permeability) (Table 2).
Topography - the "T" factor:
Topographic digitized maps of a scale of 1:50000 were used to produce digital version which were then converted into TIN feature and slope maps. Table 6 shows the values of slopes interval, according to Aller et al., 1987.
Impact of the vadose zone - the "I" factor:
This is the zone above the water table. It is unsaturated or discontinuously saturated with water, and determines the attenuation characteristics of the material below the typical soil horizon and above the water table. It is the region where pores and fractures are partially filled with water and partly by air and where also water droplets are generally in vertical a downward movement. Table 2 shows the ratings for each vadose zone.
Hydraulic Conductivity - the "C" factor:
This is the ability of the aquifer materials to transmit water. It controls the rate at which groundwater flows under a given hydraulic gradient. The rate at which the groundwater flows also controls the rate at which a contaminant moves away from the source. Table 2 shows the ratings of the hydraulic conductivity. Values for the hydraulic conductivity are calculated and modeled from aquifer pumping tests.
Final vulnerability classes:
The final vulnerability map is determined and classified into four legend categories following Fritch et al (2000). This study divides the land into: low, moderate, high or very high vulnerability as shown in Table 3.

Results and discussion
Oil shale is a general term indicating a sedimentary fine grained rock containing a fossilized mixture of organic material that when heated breaks down -like oil- to gas and other oil products after processing.
Difference between oil shale and normal oil is the burial time, which indicates the process at which both formed and the depth at which burial took place, in the case of the oil shale the burial was not deep enough or not for long enough time to transform into oil.
A conservative estimate of oil shale reserves in the center of Jordan is 47 billion tons, although the reserve estimates are not a direct indicator it gives a general idea of the situation (NRA, open files).
Off-site processing of the oil shale generally referred to as Ex-Situe. This is the widest spread processing technology. Since oil shale processing entails mining the ore and shipping to fit facilities to undergo, processing in order to produce a more productive material.
Two primary methods are used to process the oil shale into synthetic crude oil:
1. Retorting:
Retorting starts with drying and heating the oil shale at 500 - 600 degrees. Then the heated shale passes to a gasification stage, where the residual organic carbon is oxidized at temperatures of less than 1000 degrees; to prevent its fusion which forms masses of in usable slag. Finally, the spent shale is cooled to 80 - 100 degrees and passed through the lower parts of the retort and removed using a water seal. The heat required to retort the shale is supplied by recycled fuel gas resulting from the retorting process or combusting conventional fossil fuels (Bsieso. M, 2006).
2. Circulating Fluidized Bed:
In this method, fine oil shale particles of a diameter less than 10 mm are introduced into a fluidized bed, these particles are separately heated to about 800 degrees. After that it mixed with the raw oil shale, causing it to break at 500 degrees. Oil vapor and shale gas are separated and cooled to condense and collect the resulting oil.
Applying DRASTIC index for the current situation in Sewaqa area; the D factor (Depth to water table) is determined from wells data collected from the Ministry of Water and Irrigation (MWI) and analyzed for all the aquifers in the study area. After that, the data was drawn to give the final depth to water map. For the main aquifer in the study area, depth to water table is more than 30 meters; hence according to the DRASTIC index the D value for this depth is 1 which means there are a little to no effects of the depth to the water level in the vulnerability ratings.
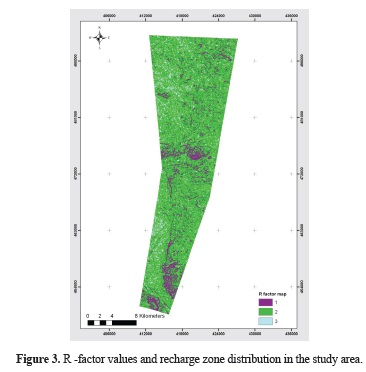
For producing the R factor map; which consists of the sub factors of rainfall amounts, the slope of the topography and the soil permeability; the study area is with rainfall rates less that 500 mm/yr , which gives the value 1 for the building of the R map, in addition to the rainfall, the soil types map according to the soil permeability which reflects the values 1 and 2 according to the differences of the soil cover in the study area, the most effective factor in building the R map in the study area was the slope factor which vary from 1 to 3 in the located aquifer. Applying that the R factor ranges from the value 1 to three and distributed in the study area as shown in Figure 3.
The information about the A- factor, which is the aquifer media types was obtained from the Natural Resources Authority (NRA) the geological maps with 1:50000 scale, from well data Jordan Water Authority, (open files )and own observation during the field work.
The information was combined to determine the aquifers properties and hence the A factor values. The study area aquifer media is bedded and karstic limestone, the common media of the B2A7 aquifer, since the study includes only 1 aquifer the map will also show a solid color and a uniform value of 6 according to the used index.
For finding the S factor map; a soil map of Jordan which prepared by MOA in 1993 was used as a base and along with field observations using the grain size analysis, most of the soils in the study area are of the Loam type; these reflect the value of 6 after Aller et al., 1987.
Producing the T factor map, the topographical setting of the study area was done using digitized maps of a scale of 1:50000 to produce digital version which were then converted into slope maps using the Arc GIS.Results obtained from this factor reflects T values range from 1 in the areas with steep slopes and up-to 7 in the gentle slopes areas as shown in Figure 4.

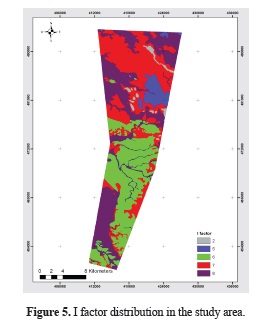
For the I factor; the impact of vadose zone, The National Water Master Plan (1977), geologic maps NRA and field visits were used to obtain the information of the vadose zone in the study area, many types of rocks and sediments lay over the targeted aquifer which reflect many values of I factor, the distribution of these values are shown in Figure 5.
The final factor of the DRASTIC index is the C map which is the hydraulic conductivity factor, this was produced by Bundesanstalt für Geowissenschaften und Rohstoffe BGR (1997) which is the Federal Institute for Geosciences and Natural Resources, they calculated the hydraulic conductivity of the aquifer rocks and B2A7 conductivity was found to be 2*10-6 -- 1*10 -4 m/s; which reflects the value of 1 according to DRASTIC.
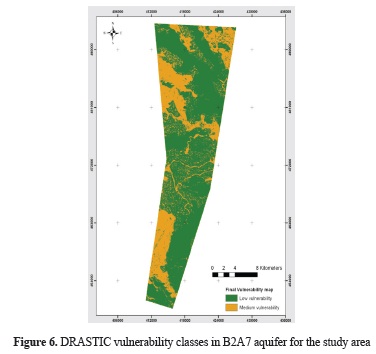
The final DRASTIC vulnerability thematic layer is generated by summing each DRASTIC thematic parameter. Each of these parameters according to be already multiplied by its designated weight. Figure 6 shows the final vulnerability classes in the study area, dividing it into 2 classes of low and medium vulnerability classes (AlKurdi, 2013).
But considering the geological structure in the area, which mainly consisting of extensional faults (Figure 7), makes the groundwater quite vulnerable to human activities, especially along those faults.
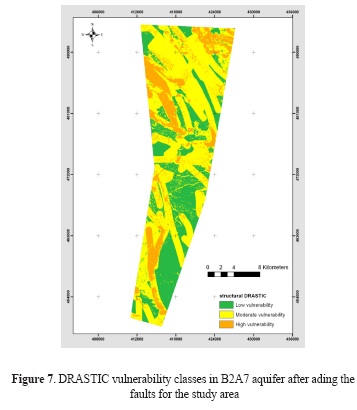
Overlaying the final vulnerability map with the existing faults, shows that the groundwater in the B2/A7 aquifer system will be endangered by human activities including oil shale mining (AlKurdi, 2013).
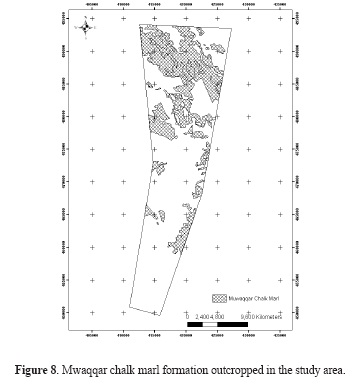
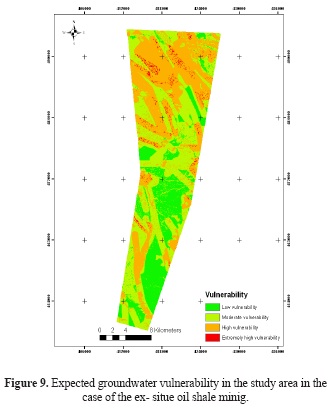
In the case of the ex-situe oil shale mining; the oil shale in the study area froms from the Muwaqqar (Chalk Marl) Formation; This Formation is composed of marl, chalky limestone, micritic limestone and chert and overlaid the main aquifer in the study area. Oil shale forms the lower parts of this Formation. It crops out in some central parts of the area in addition to the northern parts of the study area (Figure 8). Generally it underlies the whole study area with a thickness ranging from 200 to 300 m. removing this amounts of rocks from the outcropped areas will change the depth to water table in that areas and so will increase the vulnerability values there. Figure 9 shows the new vulnerability map in which the areas that supposed to be mined in order to extract the oil shale with its new vulnerability classes with extremely high value in some of the mining areas which need high protection parameters to be done in that areas during any activities to be done in the future.
Hydrochemical analysis:
Ground water samples from seven wells and 10 surface water samples were collected from the study area and were analyzed for their major, minor, and trace elements. Electric conductivity (EC), pH value, and temperature were measured directly on site using specialized digital equipment.
The temperature of the collected samples ranged from 25 C° to 28 C° for the surface water which is alongside the normal natural temperature for the area. However, it was from 30.5 C° to 41.5 C° for the samples collected from various wells in the study area.
Electrical conductivity, which reflects the total dissolved solids in the target sample, was measured directly in the field for better accuracy of the readings; it ranged from 148µS/cm to 180µS/cm for surface collected samples, and from 1980 µS/cm to 2380 µS/cm for the ground water samples. Sample pH ranged from 8 to 8.29 for the ground water samples and from 8.41 to 9.2 for the surface water samples.
Calcium and Sodium are the dominant cations in the samples of the ground water.
The calcium concentrations range from 136.8 mg/l to 453.3 mg/l for and sodium from 156.5 mg/l to 228.7 mg/l. For the surface water samples calcium ranged from 33.48 mg/l to 525 mg/l and sodium from 8.48 mg/l to 51.2 mg/l.
Chloride and sulfate are the anions dominating the samples in terms of measured concentration, while for the ground water samples the concentrations of chloride ranged from 125.5 mg/l to 183.4 mg/l for sulfate from 242 mg/l to 321 mg/l, the concentrations in surface water ranged from 6.8 mg/l to 31.6 mg/l and 1.2 mg/l to 1155 mg/l for both chloride and sulfate respectively.
Furthermore, the other concentrations are represented in tables 4 and 5.

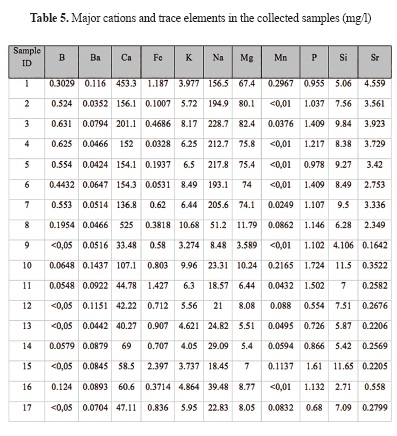
Trace elements group consists of boron (B), barium (Ba), iron (Fe), manganese (Mn), strontium (Sr), phosphorus (P), and silicon (Si) were determined in all of the samples. The concentrations were in ranges less than 10 mg/l with Sr and Si being the major contributors with concentrations of Sr from 2.75 mg/l to 4.55 mg/l for well samples and from 0.16 mg/l up to 2.34 mg/l for surface water samples, Si ranged from 5.06 mg/l to 9.84 mg/l in well retrieved samples and 2.71 mg/l up to 11.65 mg/l in surface water samples, results of these analysis are provided in table 10.
Conclusion
Results that are obtained by this work concluded by that the study area by applying the normal DRASTIC index shows two vulnerability classes which are low and moderate because of the deep water table and the limited recharge ability in the area in addition to other DRASTIC factors, but in the case of applying the modified DRASTIC index which considers the geological features into account increase the vulnerability classes by converting some areas to highly vulnerable areas to the human activities because of the existing geological structures which are weak zones that may allow pollutants to reach easily to the water table. In addition to the structural features; adding the possibility to the oil shale mining from the outcropped areas in the study area decrease the depth to water table by removing the vadose zone that is existed over the targeted aquifer and which will directly affect the vulnerability values in that areas. This work in very important to be a reference point to the option of using the ex-situe oilshale mining; this will shed the light on the groundwater vulnerability of the areas that was covered by the oilshale bed and that will be removed after the mining process.
References and Notes
Abed, A., (2000). The Geology, Environment and Water of Jordan. Amman: the Jordanian Association of Geologists. [ Links ]
Al-Adamat, R. A. N., Foster, I. D. L., Baban, S. M. J. (2003). Groundwater vulnerability and risk mapping for the Basaltic aquifer of the Azraq basin of Jordan using GIS, Remote sensing and DRASTIC. Applied Geography, 23: 303-324. [ Links ]
Alali, Jamal; Abu Salah, Abdelfattah; Yasin, Suha M.; Al Omari, Wasfi (2006). "Oil Shale in Jordan". Natural Resources Authority of Jordan. [ Links ]
Bender, F. (1974): Geology of Jordan. Berlin: Borntraeger. [ Links ]
Aller, L., Bennett, T., Lehr, J. H., Petty, R. J., Hackett, G. (1987). DRASTIC: A standardized system for evaluating ground water pollution potential using hydrogeologic settings. U.S. Environmental Protection Agency, EPA/600/2-87/036, 622pp. [ Links ]
Arc GIS, Geographical Information System 9.2, computer program. [ Links ]
Bsieso, Munther S. (2006). Oil Shale Resources Development In Jordan. [ Links ]
Chow, Ven Te et al, 1988, Applied Hydrology, McGraw - Hill, United States of American. [ Links ]
COST Action 260, (2002), Vulnerability and risk mapping for the protection carbonate aquifers, Final report. [ Links ]
Ebey, G.N. (2004): Principles of environmental geochemistry. Thomson Learning, Inc.,USA. ISBN 0-12-229061-5. [ Links ]
Jiries, A. (1986): Hydrogeology and Hydrochemistry of the area south of Amman city. M.Sc. thesis, University of Jordan. [ Links ]
JMD -Jordanian Meteorological Department (2009) JMD open files. Jordanian Institution for Standards and Metrology (JISM). (2001). Technical Regulation; Water - Drinking Water, No. 286, Amman. [ Links ]
Merchant, J. M (1994). GIS-Based groundwater pollution hazard assessment: A critical review of the DRASTIC Model. Photograommetric Engineering & Remote sensing, Vol. (60), No. (9), pp. 1117-1127. [ Links ]
MOA - Ministry of Agriculture. (1993). National soil map and land use project. The soils of Jordan. Hunting Technical services Ltd. In association with Soil Survey and Land. Research Center. Vol. 3 Level 1. [ Links ]
Mohammad, Alsharifa Hind, New Groundwater Vulnerability Index for the Main Aquifers in Central Catchment Area in Jordan and Validation of the Results Using NO3 Concentrations Maps, World Environment, Vol. 4 No. 1, 2014, pp. 22-32. doi: 10.5923/j.env.20140401.03. [ Links ]
Mohammad, A., Almomani, T. and Alhejoj, I. (2015) Groundwater Vulnerability for the Surface Outcropping Aquifers in Jordan. Journal of Environmental Protection, 6, 250-258. doi: 10.4236/jep.2015.63025. [ Links ]
MWI - Ministry of Water and Irrigation (2003): Water Information System. [ Links ]
Hydrologial, geological and hydrogeological data bank. MWI, Water Resources and Planning Directorate, Amman, Jordan. [ Links ]
Salameh, E. & Bannayan, H., (1993): Water Resources of Jordan Present Status & Future Potentials. First edition, Fridrich Ebert Stiftung, Amman - Jordan. [ Links ]
Salameh, E. (1996): Water quality degradation in Jordan (impacts on environment,economy generation resources base), final report. Friedrich-Ebert-Stiftung and Royal Society for the Conservation of Nature, Higher Council of Science and Technology. The national library, deposit No. 1134/8/1996, Amman. [ Links ]
Luck, T (2008-08-07). "Jordan set to tap oil shale potential". The Jordan Times. Retrieved 2008-10-25. [ Links ]
The German council of environmental advisors (SRU) (1998): Special report on groundwater protection. http://www.umweltrat.de/son98en1.htm. [ Links ]

