


Services on Demand
Journal
Article
 English (pdf)
 Article in xml format
 Article references
 Send this article by e-mail
Indicators
-
 Cited by SciELO
 -
 Access statistics
Related links
-
 Cited by Google
 -
 Similars in
SciELO
Similars in
SciELO -
 Similars in Google
Share

 Permalink
Earth Sciences Research Journal
Print version ISSN 1794-6190
Earth Sci. Res. J. vol.20 no.1 Bogotá Jan./mar. 2016
https://doi.org/10.15446/esrj.v20n1.52469
http://dx.doi.org/10.15446/esrj.v20n1.52469
GIS-based assessment of aquifer vulnerability using DRASTIC Model: A case study on Kodaganar basin
Evaluación basada en el Sistema de Información Geográfica a la vulnerabilidad de un acuífero a partir del método DRASTIC: caso de estudio en la cuenca Kodaganar
Johnny Colins1, M.C. Sashikkumar1, P.A. Anas2, M. Kirubakaran2
1 Department of Civil Engineering, Regional Office of Anna University, Tirunelveli, Tamil Nadu, India - 627007
2 Department of Civil Engineering, Regional Centre of Anna University, Tirunelveli, Tamil Nadu, India - 627007.
Corresponding author: colinsjohnny@gmail.com
Record
Manuscript received:12/08/2015 Accepted for publication: 04/12/2016
How to cite item
Colins, J., Sashikkumar, M. C., Anas, P. A., & Kirubakaran, M. (2016). GIS-based assessment of aquifer vulnerability using DRASTIC Model: A case study on Kodaganar basin. Earth Sciences Research Journal 20(1), H1-H8. doi: http://dx.doi.org/10.15446/esrj.v20n1.52469
ABSTRACT
Groundwater is vulnerable and more susceptible to contamination from various anthropogenic elements. Various steps are taken to measure the groundwater vulnerability for a sustainable groundwater development. The present study estimates the aquifer vulnerability by applying DRASTIC model in the Geographic Information System (GIS) environment. The DRASTIC model uses seven hydrological parameters which include depth to water level, net recharge, aquifer media, soil media, topography, the impact of vadose zone and hydraulic conductivity. DRASTIC index was calculated from DRASTIC model that ranged from 31 to 154. All these parameters characterize the hydrological setting for evaluating aquifer vulnerability. Sensitivity analyses have also been performed to determine the sensitivity of every individual DRASTIC parameter towards the aquifer vulnerability. Sensitivity analysis indicated that all the parameters have an almost similar influence on vulnerability index. Depth to water parameter inflicts larger impact on aquifer vulnerability followed by recharge, topography and soil Media. The whole of Kodaganar basin is classified into very low, low, moderate and high vulnerable zones. Nearly three-fourth of the basin has very low and low vulnerability. Incorporating DRASTIC model in the GIS environment has proved efficient in handling large volumes of data and in determining the groundwater vulnerability.
Keywords: Aquifer vulnerability, DRASTIC, GIS, Sensitivity analysis, Kodaganar basin.
RESUMEN
El agua subterránea es vulnerable y más susceptible a la contaminación de varios elementos antropogénicos. Se midió la vulnerabilidad del agua subterránea en varias etapas para establecer el desarrollo sustentable de la fuente acuífera. Este trabajo estima la vulnerabilidad del agua subterránea por la aplicación del método DRASTIC en el entorno del Sistema de Información Geográfica (GIS, en inglés). El método DRASTIC utiliza siete parámetros hidrológicos: profundidad del agua subterránea, recarga neta, litología del acuífero, tipo de suelo, topografía naturaleza de la zona no saturada y conductividad hidráulica del acuífero. El índice DRASTIC fue calculado a través de este método y que oscila entre 31 y 154 unidades. Estos parámetros caracterizan la configuración hidrológica para la evaluación de vulnerabilidad del acuífero. También se realizaron los análisis de susceptibilidad para determinar la respuesta de cada parámetro DRASTIC frente a la vulnerabilidad del agua subterránea. El análisis de susceptibilidad indicó que todos los parámetros tienen una influencia similar en el índice de vulnerabilidad. El parámetro de profundidad ocasiona un mayor impacto en el índice de vulnerabilidad, seguido por la recarga, la topografía y el tipo de suelo. Toda la cuenca de Kodaganar se clasifica en zonas de vulnerabilidad muy baja, baja, moderada y alta. La incorporación del método DRASTIC en el entorno GIS prueba la eficiencia en el manejo de grandes volúmenes de información y en la evaluación de vulnerabilidad de aguas subterráneas.
Palabras clave: Vulnerabilidad de acuíferos, DRASTIC, Sistema de Información Geográfica, Análisis de Sensibilidad, cuenca Kodaganar.
Introduction
The socioeconomic development of any region relies on the fresh and quality of water available in the area. Groundwater is a better resource for water requirement due to its economic and hygienic reasons. It is an important natural resource that mainly depends on the subsurface and various hydrological characteristics. The demand for the fresh water has been increased in the semi-arid regions of Tamil Nadu in the recent years due to the poor availability of surface water and increase in the population. According to Voudouris et al. (2010) the most effective method of combating the groundwater pollution is its initial prevention. Prevention of groundwater contamination is essential for effective groundwater resource management. People living in Dindigul district mainly depends on groundwater for various purposes due to the limited availability of surface water. For an effective groundwater resource management and a sustainable development, determination of aquifer vulnerability is essential. It is assumed that the physical environment might provide certain degree of protection to groundwater against the contaminants entering the subsurface environment. Contamination of groundwater by anthropogenic activities is a slow but harmful phenomenon which may result in adverse effects.
Scientists and resource managers have sought to develop techniques for predicting areas that are more likely than others to become contaminated as a result of activities at or near the land surface (NRC 1993). Intrinsic vulnerability is considered as a property of groundwater system that also depends on the impact of anthropogenic activities. Integrated vulnerability is a modified method that combines risk of loading of pollutants with the intrinsic vulnerability. The intrinsic method applied in this case study is DRASTIC which is a parametric system method developed by Aller et al. (1987) for the U.S. Environmental Protection agency (EPA). It is most widely used in United States for the groundwater vulnerability assessment. DRASTIC is an index model designed to produce vulnerability scores for different locations by combining several thematic layers (Babiker et al. 2005). The DRASTIC method requires data that are easily available and it suits for regional scale assessment. A high number of input data layers are included which in turn reduces the impacts of individual parameters on the vulnerability index. DRASTIC deals only with hydro-geological setting and does not describe the pollutant influence. This method uses seven environmental parameters like depth to water, net recharge, aquifer media, soil media, topography, impact of vadose zone and hydraulic conductivity. All these parameters characterize the hydrogeological setting and in evaluating aquifer intrinsic vulnerability. Vulnerability assessment delineates areas that are more likely than others to get contaminated from natural or anthropogenic causes. Overlay and index method combine factors controlling the movement of pollutants from ground surface into saturated zone which results in groundwater contamination. GIS tools are used to create the vulnerability index map which depicts the pollution potential for the aquifer by overlaying various map layers. The vulnerability results obtained through DRASTIC model are considered unreliable due to the adopted and selected feature weights and ratings used by the model (Aminreza Neshat et al. 2014). Therefore, the DRASTIC model is a potential victim for criticism. Hence, we attempt to evaluate whether it is really necessary to use all the seven DRASTIC parameters for determining aquifer vulnerability. The rated DRASTIC parameters were first evaluated for interdependence and variability. The concept of sensitivity analysis helps in determining the sensitivity of individual DRASTIC parameters to aquifer vulnerability. The influence of rating values and weights assigned to each parameter are provided by sensitivity analysis. When two sensitivity analyses tests namely the map removal and single-parameter sensitivity analysis were performed that causes variation in vulnerability index, it becomes more effective in the assessment of aquifer vulnerability. The main objective of this study is to demonstrate DRASTIC incorporated in GIS environment is an efficient method for assessing groundwater vulnerability and water resource management.
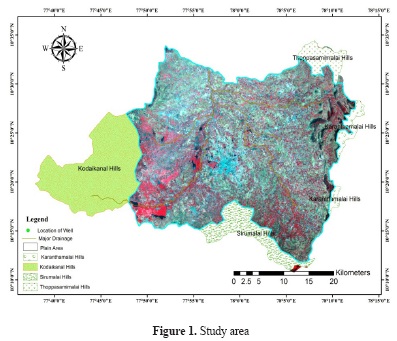
The study area chosen for evaluating the intrinsic vulnerability is Kodaganar basin which is located in Dindigul district of South India is shown in figure 1. It covers an area of 1540 km2. The basin lies in 10°18'N to 10°57'N latitude and 77º37'E to 78°12'E longitude. It is located between Kodaikanal hills, Sirumalai hills, Karanthamalai hills and Thoppasamimalai hills. The average elevation in the basin is 418 m with lowest and highest elevations as 207 m and 1846 m respectively. The Kodaganar basin is drained by river Kodaganar which flows northward and join river Amaravati. The tributaries of Kodaganar river originate from the hills which encloses the basin from three sides. It is almost surrounded by structural hills and entire runoff drains into river Amaravati. The larger part of the basin is occupied by the metamorphic, crystalline rocks which are highly folded, fractured and jointed. The major geographic units found in the basin are shallow pediments and pediments. Most of the rainfall occurs between September and December. The average annual rainfall recorded in the Dindigul district is about 828 mm. The basin has plain and hilly area and encounters modera te variations in climatic conditions. In the summer, temperature reaches a maximum of 37°C and minimum of 29°C. During winter the temperature ranges from 20°C to 26°C.
Data and Method:
In this paper, the Geographic Information System (GIS) based DRASTIC model was used to evaluate the groundwater vulnerability of the Kodaganar basin. The DRASTIC model was developed by Aller et al. (1987) for the United States Environmental Protection agency (EPA), with the purpose of creating a methodology that would permit a systematic evaluation of groundwater pollution potential of any hydrological setting. The various hydrological parameters used in the DRASTIC model include Depth-to-water, net Recharge, Aquifer media, Soil media, Topography, Impact of vadose zone and hydraulic Conductivity. The model yields a numerical index which is derived from the ratings and weights assigned to the seven model parameters. Each parameter is further subdivided into ranges or significant media types that are rated between 1 and 10 according to their relative impact on the pollution potential. The seven parameters are assigned weights ranging from 1 to 5 based on its relative importance. The DRASTIC index is then computed by applying a linear combination of all factors according to the following equation.

Where D, R, A, S, T, I, C are the seven parameters and the subscripts r and w refers to rating and weights respectively. The DRASTIC index is determined by multiplying each parameter rating by its weight and adding together the resulting values. Then all parameters are weighted to express their relative importance with respect to each other and two types of sensitivity tests were also carried out. Spatial data analysis and computerized mapping are done in the GIS environment
Preparation of parameters Maps:
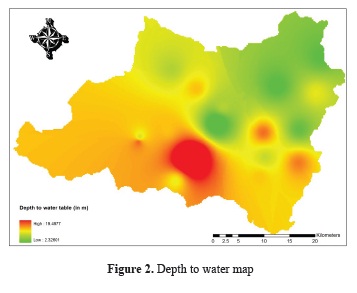
The seven model parameters are prepared as thematic maps which are obtained from several types of data and sources. The depth to water (D) represents the depth from the ground surface to the water. More deep in the level of water table inflicts less chance for contamination to occur. Depth to water parameters has been assigned with a relative weight of 5. Depth to water affects the time for a contaminant to undergo chemical and biological reaction. With a decrease in depth of water, the potential of groundwater contaminant increases. This parameter was derived from water level data of 19 control wells in and around the study area from the Public Works Department (PWD). The well location vector layer was prepared based on GPS survey and spatial distribution map of water table was obtained by interpolation through IDW technique.
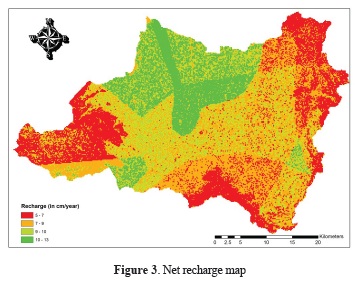
Net recharge (R) is the amount of water which penetrates the ground surface and reaches water table. It is the total quantity of water (in mm) which infiltrates into aquifer on an annual basis. The recharge value ranges from a minimum of 5 cm/year to a maximum of 11 cm/year in the study area. It acts as a significant medium for transporting the contaminants. It transports the contaminant to the water table vertically. The total recharge for the study area was estimated by adopting Piscopo method (Kaliraj et al. 2015) which is considered a better field based method. The relative weight is assigned as 4 for net recharge.
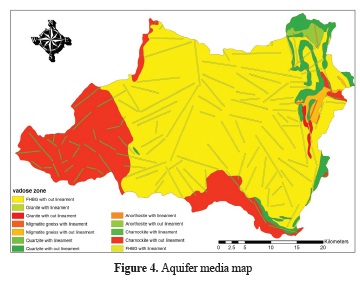
Aquifer media (A) refers to the saturated zone material properties that control the pollutant attenuation process. It has the potential to store water. The attenuation characteristic of the aquifer material is reflected by the mobility of the contaminants through aquifer media. It includes the pore spaces and fractures of the media where the water is held. A longer travel time will result in more attenuation of the pollutant. Its relative weight is assigned as 3.
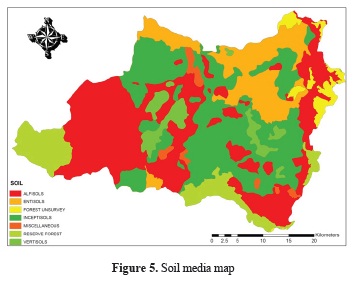
Soil Media (S) refers to the uppermost weathered portion of the unsaturated zone and controls the amount of recharge that can infiltrate downward. It transports the contaminant and water from soil surface to the aquifer. Soils with clay and silts increase travel time of pollutant (Sinan et al. 2009). Digital soil map was prepared from soil maps obtained from the Tamil Nadu Public Works Department. Based on the permeability the rating values of soils are assigned. Its relative weight is assigned as 2.
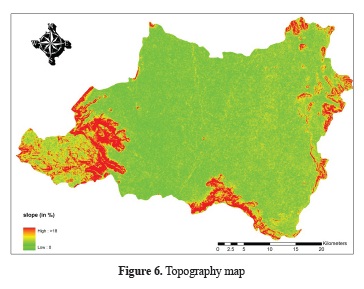
Topography (T) refers to the slope of terrain which is an input in DRASTIC method. The flow rate at the surface that influences biodegradation and attenuation is expressed by this parameter. The slope parameter dictates whether the water will remain on surface to allow contaminant percolation to saturated zone. Water stagnates in areas of low slope, increases the infiltration and a greater possibility for contaminant migration. Slope map was prepared from the SRTM DEM (Shuttle Radar Topographic Mission-Digital Elevation Model) data. It is expressed in percentage and its relative weight is 1.
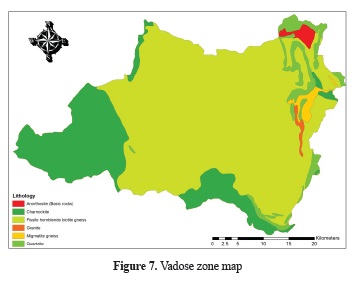
Impact of vadose zone (I) is defined as the unsaturated zone material lying below the typical soil horizon and above the water table. This is unsaturated or discontinuously saturated. The movement of the contaminants to the saturated zone is controlled by this parameter. Many processes that influence the pollution potential take place in vadose zones and control the passage and attenuation of the contaminated material to the aquifer (Yin et al. 2012). The parameter map was prepared from well lithology data obtained from PWD. The relative weight of Impact of vadose zone is 5.
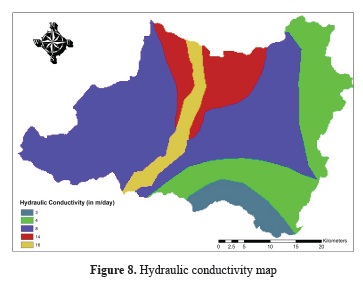
Hydraulic Conductivity (C) indicates the ability of aquifer to transmit water which determines the rate of flow of contaminant material within the groundwater system. The hydraulic conductivity data was obtained from the PWD. The parameters relative weight in DRASTIC method is 3. The hydraulic conductivity map was spatially registered and conductivity zones in the area were resampled into different zones. All the weights were assigned based on literatures.
Sensitivity analysis:
The sensitivity analysis of the DRASTIC parameters has been carried out to evaluate the sensitivity of individual parameter in assessing the intrinsic vulnerability of groundwater. The weights of the DRASTIC parameters are used to compute the vulnerability index values. Hence it is attempted to evaluate necessity to use all the seven DRASTIC parameters in determining the intrinsic vulnerability. Two sensitivity tests performed are the map removal and single parameter sensitivity analysis. The map removal sensitivity analysis represents the sensitivity associated with removing one or more layer at the time of model execution. In this analysis, the map removal sensitivity analysis is performed by the following equation.
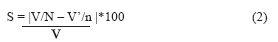
Where S -- Sensitivity measurement of particular parameter
V -- Total vulnerability index
V'-- Vulnerability index of the individual parameter
N -- Total no. of parameters involved in computation of V
n -- no. of parameters involved in calculating V'
Here V and V' are the unperturbed and perturbed vulnerability indices respectively. The actual vulnerability index obtained from using all the seven parameters was considered as an unperturbed vulnerability. The perturbed vulnerability is the one which is computed by lower number of data layers. The measurement represents the relationship between unperturbed and perturbed vulnerability conditions.
Single parameters sensitivity measure was developed to determine and assess the impact of seven parameters of DRASTIC method on the vulnerability index. It evaluates the degree of influence of an individual parameter for the vulnerability of groundwater. The effective weight of each feature class is found by the below formula
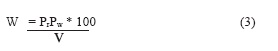
Where W - effective weight of each parameter
Pr, Pw - rating and weight of each parameter
V - Overall vulnerability index
Results and Discussion
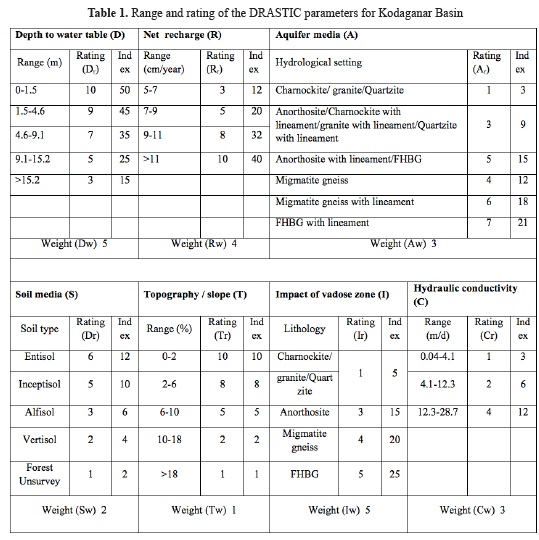
The total range of vulnerability index values ranges from 23 to 230. According to DRASTIC model, the vulnerability index map is classified into four classes such as very low, low, moderate and high vulnerable zones. The range and ratings for the study area is shown in table-1.
DRASTIC parameters:
The depth to water is an important parameter in assessing the groundwater contamination and evaluating the intrinsic vulnerability. It is a significant parameter that controls the ability of contaminants to reach the groundwater .The spatial variation of depth to groundwater table in the region was interpolated from 19 wells. The depth to groundwater level in the study area varies from 2.33 to 19.50 m. The assigned rating varies from 1 to 9 and the index value ranges from 5 to 45. Around 44 % of the basin has depth in the range of 6.6 m - 10.9 m. 32 % of the study area falls under 10.9 m - 15.2 m of depth. Less than 1 % has depth between 15.2 m and 19.5 m. The groundwater contaminant potential decreases with increase in the depth. Hence low ratings are assigned to areas with high water table depth. Depth to water parameter map is shown in figure-2.
The net recharge or effective infiltration is the amount of entering the ground per unit area of land which percolates and reaches water table. The study area is characterized by a moderate rainfall. Infiltration parameter is mainly controlled by land use on the surface. The vulnerability index rises with increase in rank of net recharge. 41 % of the study area has net recharge value in the range of 7 to 9 cm/year. The highest rating 10 is assigned only to 4 % of study area that has a recharge value more than 11 cm/year. Recharge parameter map is shown in figure-3.
The aquifer media map is shown in figure-4 which was prepared from subsurface geology map and lineament map. It consists of consolidated and unconsolidated rocks. The ratings are assigned from 1 to 7. The various types of aquifers found in the study area are charnockite, anorthosite, fissile horneblonde biotite gneiss (FHBG) and migmatite gneiss. The lineaments are found in migmatite gneiss and FHBG regions. This factor is highly controlled by degree of fracture and the weathered nature of rocks. Majority of Kodaganar basin (around 65%) has gneissic rock. Anorthosite, migmatite gneiss with lineament and FHBG with lineament are found in negligible amount in the study area. Charnockite covers 27.5% of the study area and it has a low rank of 1.
The textural properties of the soil media control the groundwater vulnerability. It has a significant impact on the amount of recharge and act as a contaminant aquifer. The soil media is usually variable and it plays an important role in the evaluation of intrinsic vulnerability. The ranks 1, 2, 3, 5 and 6 are assigned to forest unsurvey, vertisol, alfisol, inceptisol and entisol respectively. Fine soil and organic matter decrease permeability and retard the migration of contaminant. Various types of soils like entisol, inceptisol, alfisol, vertisol and forest unsurvey covers 13.7%, 33%, 36.2%, 4.9% and 12.2% respectively. High ratings are assigned for entisol and inceptisol. Forest unsurvey is assigned 1 because it is restricted to development. Five types of soil media present in the study area are shown in figure-5.
Topography map was generated from SRTM DEM data. Areas with low slope tend to retain water for a longer period of time and support infiltration. Hence high rating values are assigned to such areas where infiltration increases the migration of contaminants. The topographic thematic layer displayed a gentle slope (0 to 6 %) over most of the study area, hence scored ranks of 9 and 10. Slope range of 0 to 2 % occupies less than 1 % of study area and its rating is 10. A rank of 9 is assigned for 24.6% study area which has 2 to 6% slope. Places with steep slopes (>18%) are assigned with rank 1 which indicates its minimal effect on the aquifer vulnerability. The decrease in slope angle generally results in the increase in aquifer vulnerability. Topography map is shown in figure-6.
The unsaturated or vadose zone plays a prominent role in the assessment of groundwater vulnerability. This zone protects the aquifer from pollutants for an extent. The ratings 1, 3, 4 and 5 are assigned to various lithology like charnockite, anorthosite, migmatite gneiss and FHBG respectively. The FHBG has been assigned with a rank of 5 as it influences more on intrinsic vulnerability. Figure-7 depicts the Impact of vadose zone map.
The hydraulic conductivity test is obtained from the PWD and cross verified with pumping tests conducted in the basin. The hydraulic conductivity ranges from 0.04 to 29 m/day. This is a critical factor to control the contaminant migration and dispersion from injection point of contaminant source to the saturated zone (Rahman 2008). The potential for groundwater pollution is more for areas with high hydraulic conductivity zones. More than half of the study area has hydraulic conductivity in the range of 4.1 to 12.3 m/day.
Around 29.5 % of study area has 0.04 to 4.41 m/day with a low rating of 1. The values in the range of 12.3 to 28.7 m/day isfound in 15 % of the Kodaganar basin. The ranks 1, 2 and 4 are assigned to the different zones of hydraulic conductivity. Hydraulic conductivity map is shown in Figure-8 which is generated by IDW technique in GIS environment.
DRASTIC vulnerability index:
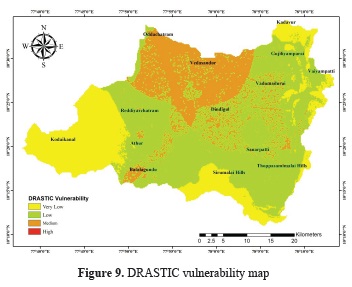
The DRASTIC aquifer vulnerability map is shown in figure 9. In the study area the vulnerability falls under very low, low, moderate and high vulnerable zones. DRASTIC index is highly sensitive to the parameter scores, weightings and the numerical values assigned. The DRASTIC vulnerability for the study area is shown in table-2. The DRASTIC index in the range of 31-56 and 56-91 comes under very low and low vulnerable zones. Very low and low vulnerable zones cover 29.5% and 45% of the Kodaganar basin respectively. This is mainly due to deep water table depth and relatively low permeability of vadose zone in such specific sites. Around 25 % of the study area has a moderate groundwater pollution potential. This does not mean that such zones are free from contamination but it is relatively less susceptible to contamination when compared with other areas. Very high vulnerability is found in less than 1% of the study area.

Sensitivity of the DRASTIC model:
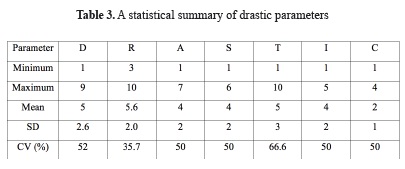
Table-3 provides the statistical summary of the DRASTIC parameters. The net recharge parameter induces the highest risk of contamination with a high mean value of 5.6. The parameters depth to water level, topography, aquifer media, soil media and vadose zone are influenced with moderate risk of contamination with mean values 5, 5, 4, 4 and 4 respectively. The hydraulic conductivity imposes a low risk of contamination with a mean value of 2. The topography parameter is highly variable as its coefficient of variation (CV) value is 66.6%. The depth to water, aquifer media, soil media, vadose zone and hydraulic conductivity are moderately variable with CV values 52%, 50%, 50%, 50% and 50% respectively. The net recharge parameter is least variable parameter (CV= 35.7%). The sensitivity is measured based on the rating and weights assigned to the feature classes of each parameter. The process of sensitivity analysis is mainly carried out to evaluate the sensitivity of seven parameters in determining the aquifer vulnerability.
Map removal sensitivity analysis:
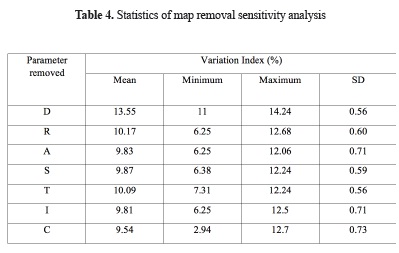
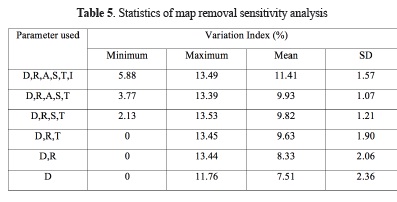
The map removal sensitivity analysis is performed by removing one or more thematic maps at a time as shown in table 4 & 5. It is stated that a high variation in vulnerability index is obtained upon the removal of depth to water parameter whose mean variation index is 13.55%. This could be due to the high theoretical weight assigned to this parameter. The vulnerability index seems to be moderate sensitive upon the removal of recharge and topography. The removal of map was based on the map removal sensitivity measure which is shown in table-4. The variation of aquifer vulnerability due to removal of one or more layers at a time is presented in table-5. The least mean variation index was calculated after removing hydraulic conductivity layer (9.54%). The adequate information on the most effective parameter involved is provided by computation of variation of vulnerability index.
Single Parameter sensitivity analysis:
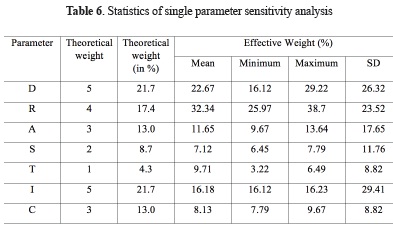
For the assessment of impact of individual parameters towards aquifer vulnerability, the single parameter sensitivity analysis is performed. The statistical summary of single parameter sensitivity analysis is shown in Table-6. The single parameter sensitivity analysis compares the effective weights and theoretical weights. The mean value of the effective weight of net recharge parameter is 32.34% and its theoretical weight is 17.4%. This indicates that this parameter is more effective in vulnerability assessment. The depth-to-water table and impact of vadose zone have high theoretical weights (21.7%). They have been assigned with an effective weight with mean value such as 22.67% and 16.18%. The remaining parameters like aquifer media, soil media, topography and hydraulic conductivity exhibits effective weights such as 11.65%, 7.12%, 9.71% and 8.73% respectively. The theoretical weights assigned to the parameters such as net recharge, topography, impact of vadoze zone and hydraulic conductivity are not in agreement with the effective weight. The net recharge has a greater influence in the vulnerability study followed by depth to water table, impact of vadoze zone, aquifer media, and topography and soil parameter. The mean value arrived for the input layer of the model is good representation of the weight for the respective parameter.
Conclusions
The evaluation of vulnerability index for the Kodaganar basin was done using the Geographic Information System (GIS) based DRASTIC model. The seven hydrogeological parameters are used in determining the vulnerability. From the index values assigned, it was found that 74.85% of the study area is under very low and low vulnerability of groundwater contamination. These zones have a minimum susceptibility to intrinsic vulnerability. It is noticed that the parts of Kodaikanal hills, Sirumalai hills, Karanthamalai hills and Thoppasamimalai hills comes under very low vulnerability. This is due to steep slopes which causes more runoff in such hilly areas. Nearly 24.85% of the study area has moderate vulnerability and it is found in northern part of the basin. The villages in the blocks such as Vadamadurai, Vedasandur, Dindigul and Oddanchatram are found to be moderately vulnerable region. Less than 1% of the study area comes under high vulnerable zone. The industrial activities were witnessed in the Dindigul, Vedasandur and Vadamadurai region. The agricultural activities are found to be a major threat in the region of moderately vulnerable zone. The DRASTIC index value ranged from 217-280 for the high vulnerability zones. The study signifies that net recharge parameter induces high risk to contamination whereas hydraulic conductivity induces a low risk of contamination with a mean value of 2. Sensitivity analyses helped to validate and evaluate the consistency of analytical results. With an efficient database in GIS environment, DRASTIC is an effective tool for analyzing the groundwater vulnerability. The study suggests that this model can be used as a better tool for the local authorities and water resource managers who are responsible for groundwater management.
References and Notes
Akhavan, S., Mousavi, S.F., Abbaspour, K.C. (2011). Conditioning DRASTIC model to stimulate nitrate pollution case study: Hamadan-Bahar plain, Environ Earth Sci. 63, 1155-1167. [ Links ]
Al Hallaq, A.H., Elaish, B.S.A. (2012). Assessment of aquifer vulnerability to contamination in Khanyounis Governorate, Gaza strip-Palestine, using the DRASTIC model within GIS environment, Arab J Geosci. 5, 833-847. [ Links ]
Alam, F., Umar, R., Ahmed, S., Dar, F.A. (2012). A new model (DRASTIC-LU) for evaluating groundwater vulnerability in parts of central Ganga Plain, India, Arab J Geosci. [ Links ]
Aller, L., Bennet, T., Leher, J.H., Petty, R.J., Hackett, G. (1987). DRASTIC: a standardized system for evaluating groundwater pollution potential using hydro-geological settings. EPA 600/2-87-035:622. [ Links ]
Babiker, I.S., Mohamed, A.A., Hiyama, T., Kato, K. (2005). A GIS-based DRASTIC model for assessing aquifer vulnerability in Kakamigahara Heights, Gifu Prefecture, central Japan, Science of the Total Environment. 345, 127-140. [ Links ]
Chitsazan, M., Akhtari, Y. (2009). A GIS-based DRASTIC Model for Assessing Aquifer Vulnerability in Kherran Plain, Khuzestan, Iran, Water Resour Manage. 23, 1137-1155. [ Links ]
Kaliraj, S., Chandrasekar, N., Peter, T.S., Selvakumar, S., Magesh, N.S. (2015). Mapping of coastal aquifer vulnerable zone in the south west coast of Kanyakumari, South India, using GIS-based DRASTIC model, Environ Monit Assess. 187:4073, 1-27. [ Links ]
National Research Council (NRC). (1993). Groundwater vulnerability assessment: predictive relative contamination potential under conditions of uncertainty. National Academy, Washington. [ Links ]
Neshat, A., Pradhan, B., Dadras, M. (2014). Groundwater vulnerability assessment using an improved DRASTIC method in GIS. Resource, conservation and recycling. 86, 74-86. [ Links ]
Pathak, D.R., Hiratsuka, A., Awata, I., Chen, L. (2009). Groundwater vulnerability assessment in shallow aquifer of Kathmandu valley using GIS-based DRASTIC model, Environ Geol. 57, 1569-1578. [ Links ]
Prasad, R.K., Singh, V.S., Krishnamacharyulu, S.K.G., Banerjee, P. (2011). Application of drastic model and GIS: for assessing vulnerability in hard rock granitic aquifer, Environ Monit Assess. 176, 143-155. [ Links ]
Rahman, A. (2008). A GIS-based DRASTIC model for assessing groundwater vulnerability in shallow aquifer in Aligarh, India, Applied geography. 28, 32-53. [ Links ]
Saidi, S., Bouri, S., Ben Dhia, H. (2010). Groundwater vulnerability and risk mapping of the Hajeb-jelma aquifer (Central Tunisia) using a GIS-based DRASTIC model, Environ Earth Sci. 59, 1579-1588. [ Links ]
Santha Sophia, M., Syed, T.H. (2013). Assessment of vulnerability to seawater intrusion and potential remediation measures for coastal aquifers: a case study from eastern India, Environ Earth Sci. 70, 1197-1209. [ Links ]
Sinan, M., Razack, M. (2009). An extension to the DRASTIC model to assess groundwater vulnerability to pollution: application to the Haouz aquifer of Marrakech (Morocco), Environ Geol. 57, 349-363. [ Links ]
Srinivasamoorthy, K., Vijayaraghavan, K., Vasanthavigar, M., Rajivgandhi, R., Sarma, V.S. (2011). Integrated techniques to identify groundwater vulnerability to pollution in a highly industrialized terrain, Tamilnadu, India, Environ Monit Assess. 182, 47-60. [ Links ]
Voudouris, K., Kazakis, N., Polemio, M., Kareklas, K. (2010). Assessment of Intrinsic Vulnerability using the DRASTIC model and GIS in the Kiti Aquifer, Cyprus, European Water. 30, 13-24. [ Links ]
Wen, X., Wu, J., Si, J. (2009). A GIS-based DRASTIC model for assessing shallow groundwater vulnerability in the Zhangye Basin, northwestern China, Environ Geol. 57, 1435-1442. [ Links ]
Yin, L., Zhang, E., Wang, X., Wenninger, J., Dong, J., Guo, L., Huang, J. (2012). A GIS-based DRASTIC model for assessing groundwater vulnerability in the Ordos Plateau, China, Environ Earth Sci. [ Links ]

