


 English (pdf)
 Article in xml format
 Article references
 Send this article by e-mail
 Cited by SciELO
  Cited by Google
  Similars in
SciELO
Similars in
SciELO  Similars in Google
 Permalink
1. Introduction
Water is a solvent and dissolves minerals from the rocks with which it comes in contact. Groundwater may contain dissolved minerals and gases that give the taste being enjoyed by many people. However, over 97% of the water on earth is salty and most of the remaining 3% is frozen in the polar ice caps (Bhattacharya et al. 2012). The atmosphere, river, lakes, and underground stores hold less than 1% of all the fresh water needed to support the earth's population (Venkateswara Rao, 2011). The investigation and assessment of groundwater chemistry and quality is a hot topic worldwide, triggering international attention from both researchers and policy makers due to its relevant link with environmental objectives and regional development. The quality of water is of vital concern for mankind since it is directly linked with human health, protection of the environment, plant growth and sustainable development. Groundwater is one of the earth's most important resources for human life. The quality of groundwater depends on various chemical constituents and their concentration, which are mostly derived from the geological data of the particular region (Nagaraju et al. 2006; Suresh et al. 2007; Gupta and Saharan, 2009; Tripathi et al. 2012; Gnanachandrasamy, et al.2015; Nagaraju et al. 2015). Groundwater chemistry has been extensively studied, and a great deal of literature can be found in various scientific journals and databases.
Geochemical analysis is an approach for defining groundwater baseline concentrations using geochemical and statistical tools (Edmunds et al. 2003). It is of most importance for thorough examination of spatial and temporal groundwater chemistry in aquifer while interpreting other possible contributing sources and processes of groundwater. Earlier workers have applied different methodologies to assess variations of groundwater geochemistry (Panagopoulos et al. 2012). Amongst these methods are multivariate statistical analysis are important (Cloutier et al. 2008; Razmkhah et al. 2010; Nagaraju et al. 2016a, b, c).
The multivariate statistical analysis such as principal component analysis (PCA) and hierarchical cluster analysis (HCA) is an approach to classify groundwater samples and make correlation between variables (Hussain et al. 2008). PCA attempts to identify underlying variables, or factors that explain the pattern of correlations within a set of observed variables. HCA helps to identify relatively homogeneous groups of cases (or variables) based on the selected characteristics by an algorithm that starts with each case (or variable) in a separate cluster and combines clusters until only one is left (Massart and Kaufman, 1983). This technique can be used to group the commonly collected water quality data, in which each cluster indicates water with particular quality (Belkhiri et al. 2010; Nagaraju et al. 2014a, b, c). In the present study, principal component analysis (PCA) and cluster analysis (CA) techniques have been applied to study the water quality characteristics of Udayagiri area.
To identify the rock-water interaction processes and groundwater redox conditions. All the hydrogeochemical studies mentioned in this study will show that multivariate statistical analyses significantly help to classify groundwater and identify major mechanisms influencing groundwater chemistry. Hence, the main objective of this study is to enumerate the usage of factor score in identification of the hydrogeochemically active regimes represented by the major factors. Relationship among dissolved ions present in water may vary with seasons and different lithologies. This study also illustrates the usefulness of statistical analysis to improve the understanding of groundwater systems.
Study area
Location and climate
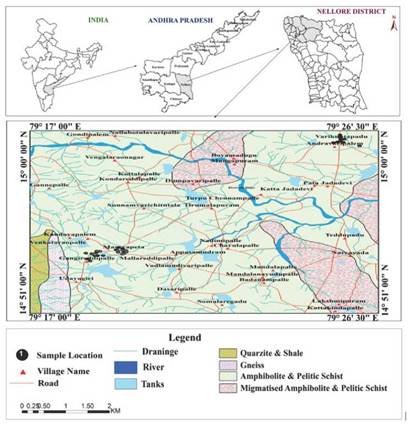
The study area is located between longitudes 79°17'00" and 79°26'30" E and latitudes 14°51'00" and 15°00'00" N (Figure 1). The climate of the area enjoys a temperature ranging from the highest mean maximum of 44°C in April to lowest mean maximum of 32°C in January. This area receives major rainfall from North-East Monsoon season starting from October and end by December-January months. This period forms the main cropping season receiving 66.7% of the annual rainfall through NE monsoon, while drought conditions generally prevail during south-west monsoon season with roughly 33.3% of the annual rainfall. Farmers take up cropping if monsoon rainfall is good in kharif season (rainy season in India, which lasts between April and October).
Geology
The study area is underlain by variety of geological formations comprising from the oldest Archaeans to recent alluvium (Figure 1). The formations include mainly garnetiferous amphibolites and pelitic schist of Nellore schist belt, granitic gneiss and Cuddapahs (quartzites and shales) of Pre-cambrian period. Among these consolidated formations, schists (amphibolites and pelitic schists) and gneisses occupy most of the study area.
Hydrogeology
Hydrogeologically this area is classified as consolidated (Hard), semi-consolidated (Soft) and unconsolidated (Soft) formations. Groundwater occurs in all most all geological formations and its potential depends upon the nature of geological formations, geographical setup, incidence of rainfall, recharge and other hydrogeological characters of the aquifer. Among the consolidated formations gneisses are relatively good aquifers. Schistose formations also form potential aquifers when the wells tapping contact zones with intrusives. Quartzites and shales of Cuddapah group are of little significance from the groundwater point of view as they are restricted to the hilly terrain. Groundwater is developed in these formations by dug wells, dug cum bore wells and bore wells tapping weathered and fractured zones. The yield of the dug wells are in the range of 15 to 35 m3/day. The depth of dug wells ranges from 5 to 12 m, while the depth of filter point wells generally varies from 6 to 11 m. The yields generally range in this aquifer between 500 to 1000m3/day.HH
Materials and Methods
Sample collection and analysis
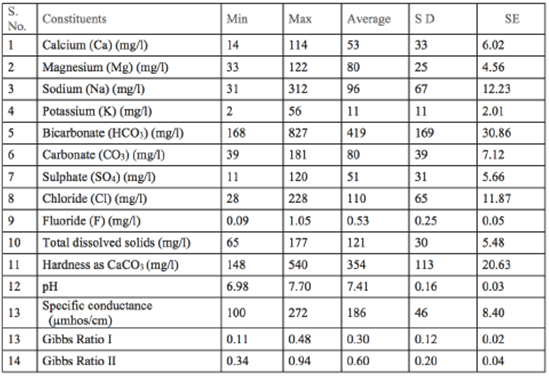
A total of 30 groundwater samples were collected from Udayagiri area during September 2014. Sampling locations were recorded using a potable GPS device and they were shown in Figure 1. The water samples were collected from bore wells after 10 minutes of pumping and transferred into precleaned polyethylene bottles. Electrical conductivity and pH were measured in the field immediately after sampling, while the determination of major cations (Na+, K+, Ca2+, Mg2+ and anions (F-, Cl-,SO42- HCO3 -) were carried out in the laboratory using the standard analytical procedures recommended by APHA (2005).Minimum, maximum, average values and SE values are presented in Table 1.
Multivariate techniques
Multivariate techniques such as principal component analysis (PCA) and hierarchical cluster analysis (HCA) were useful in analyzing hydrochemical data (Wu et al. 2014). In this study, the IBM® SPSS v.20 software was used to analyze the dimensional groundwater quality data of the samples including EC, pH, TDS, Ca2+, Mg2+, Na+, K+, HCO3 -, CO3 2-, F-, SO4 2-, Cl-, hardness, alkalinity. PCA can determine the principal factors corresponding to both natural and anthropogenic processes that may have significant influences on the chemical composition of groundwater, while HCA can determine the number of groups that the hydrochemical data can be classified (Voutsis et al. 2015).
Two types of hierarchical cluster analysis (HCA) are usually used: Q mode HCA and R mode HCA. Q mode HCA can be used to highlight the spatial relationships among the sample points, while R mode HCA is usually applied to analyse the parameters by clustering them into groups or facies based on their similarity (Wu et al. 2014). In this study, Q mode HCA was adopted. Before clustering, raw data was standardized using the Z score approach. A combina tion of the squared Euclidean as a similarity measure and the Ward's agglom eration scheme to link clusters was determined to yield optimal results in the HCA. Determining the number of principal components is important in PCA. It can be determined either by the total variance for which the total variance explained by the principal components should be higher than 85% or by the Kaiser criterion for which only the components with eigenvalues greater than one can be retained(Cloutier et al. 2006; Wu et al. 2014). In this study, the Kai ser criterion was adopted to determine the number of components.
Results and Discussion
From the geochemical analyses of groundwater samples as depicted in Table 1, the pH is in range of 6.98 to 7.70 indicates its suitability for irrigation.The EC is ranging from 100 to 272 |imhos/cm. Ca is varying from 14 to 144 mg/L and Mg is ranging from 33 to 122 mg/L; Na is between 31 to 312 mg/L and K is varying from 2 to 56 mg/L. The fluoride concentration is ranging from 0.09 to 1.05 mg/L. The total dissolved solids lie between 65 to 177 mg/L, in which most of the samples are within desirable limit. The concentration of sulphate varies between 11 to 120 mg/L. The HCO3 and CO3 concentrations in groundwater range from 168 to 827 mg/L and 39 to 181 mg/L, respectively. The chloride content varies from 28 to 228 mg/L/. The alkalinity varies from 567 to 1771 mg/L and the hardness varies from 148 to 540 mg/L. The abundance of the major ions in groundwater is in following order:
Na >Mg >Ca >K > and Cl> HCO3 - > CO3 2- > SO4 2-
Multivariate statistical analyses
Multivariate statistical analyses are useful tool solving multivariate problems (Wu et al. 2014). In this study, Pearson correlation analysis was first conducted to reveal the hidden relationship between each pair of the physiochemical parameters, and then principal component analysis (PCA) and hierarchical cluster analysis (HCA) were carried out in SPSS 20 to analyse the hydrogeochemical data for a better understanding of the origin and evolution of groundwater chemistry.
Pearson correlation analysis
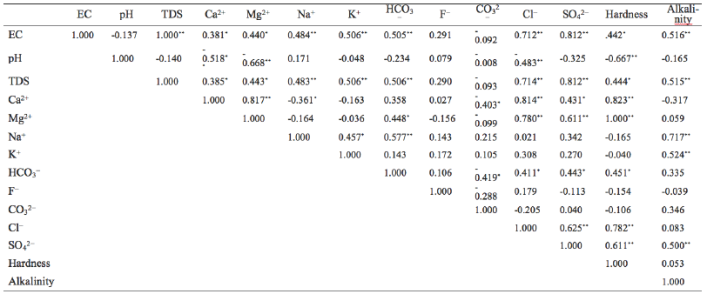
Correlation analysis is useful in understanding the chemical reactions occurring in groundwater system (Wu et al. 2015). In this study, Pearson correlation coefficients were calculated using SPSS 20 and were shown in Table 2. EC is positively correlation with TDS (r=1.000, p<0.01), because both EC and TDS represent the salinity of groundwater due to dissolved ions. Furthermore, these two parameters are positively correlated with major ions except F- and CO3 2-, indicating that the dissolved ions are the major factors influencing the values of EC and TDS. Both Ca2+ and Mg2+ show significantly negative correlations with pH (r=-0.518, p<0.01 and r=-0.668, p<0.01, respectively), which suggests that low pH value favours the occurrence of Ca2+ and Mg2+. Considering the significantly positive correlation between Ca2+ and Mg2+, it is reasonable to conclude that the dissolution of dolomite is a possible origin of Ca2+ and Mg2+ (R1), as these two minerals are prevalent in shale and the Quaternary formations. The positive correlation between Mg2+ and HCO3,- is an additional evidence of this conclusion.

CO32-is negatively correlated withCa2+ and HCO3- (r=-0.403, p<0.05 and r=-0.419, p<0.05, respectively), which can be explained as follows: In a balanced CO3 2--HCO3- system, the addition of Ca2+ in this system will incur the decrease of HCO3- (the reverse reaction of R1), which will further promote the reaction of R2, resulting in the decrease of CO3 2-.
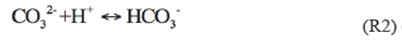
Table 2 Pearson correlation coefficients of physiochemical parameters
** Correlation is significant at the 0.01 level (2-tailed).
* Correlation is significant at the 0.05 level (2-tailed).
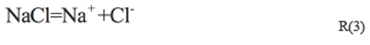
Hardness shows significantly positive correlations with Ca2+ and Mg2+ (r=0.823, p<0.01, and r=1.000, p<0.01, respectively), because hardness is an approximate measure of Ca2+ and Mg2+ (Li et al. 2013). Cl- and Na+ usually show a positive correlation if they originate merely from the weathering of halite R3 (Li et al. 2011, 2014a). But some other reactions such as cation exchange and weathering of silicate may change their relationship (Li et al. 2014b). In the present study, the cation exchange and sea water intrusion may be reasonable explanations to this. As the study area is located near the sea, sea water intrusion will alter the Na-Ca balance in the fresh water system, promoting cation exchange (R4). The negative correlation between Ca2+ and Na+ (r=-0.361, P<0.05) can be indicative of the cation exchange.
Correlation analysis is helpful to provide a preliminary understanding of the processes controlling groundwater chemistry. However, it should be noted that these reactions induced by correlation analysis are with great uncertainty (Li et al. 2011). Geological and hydrogeological conditions must be taken fully into consideration and other techniques must be applied to verify its results.
Principal component analysis
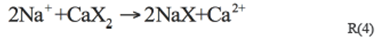
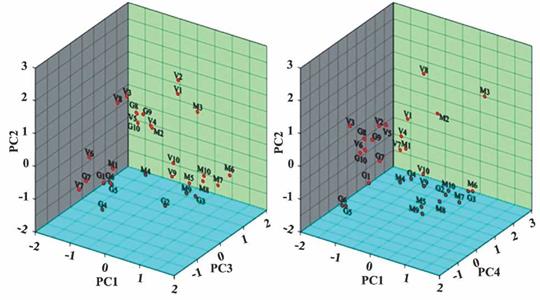
According to the Kaiser criterion, the first four principal components (PCs) which represent 84.531 % of the total variance in the hydrochemistry were extracted (Table 3). The component loadings which represent the importance of the variables for the components (values greater than ±0.532 are in bold) (Table 4).
PC1 explains the greatest of the variance (41.654%) and has significantly positive loadings by Cl-, TDS, EC, SO4 2-, Hardness, Mg2+, Ca2+, and a negative loading by pH (Table 3), which may represent the primary impacts from the dissolution/precipitation processes of minerals such as dolomite, calcite, silicates and gypsum. Considering the origin of Cl-and SO4 2-, as well as the location of samples, it is reasonable to guess that intensive evaporation is also responsible for this component. Therefore, PC1 represents a mixed origin of these parameters from natural processes including mineral weathering and groundwater evaporations, and it is the major factors influencing the characteristics of groundwater chemistry. PC2 explains 23.209% of the variance and has positive loadings in Na+, Alkalinity and K+, which is indicative of cation exchange triggered by salt water intrusion to a great degree. This is also an important process regulating the evolution of groundwater chemistry (Wu et al. 2014, 2015). PC3 and PC4 explain 12.127 and 7.541% of the variance, respectively, which shows that they are relatively more local or specific effects than PC1 and PC2. PC3 is negatively correlated with CO3 2- and has a positive loading in F-, indicating the dissolution of fluorite that introduces more F- into the groundwater but constrains the dissolution of carbonate minerals such as dolomite and calcite. PC4 has negative loading in HCO3 -, which may be explained by the transformation between HCO3 - and CO3 2- (carbonate balance).
Factor scores of each sample have been calculated and illustrated in Figure 2. From this diagram it is clear that samples V1, V2 and M3 are governed by factors represented by PC1, PC2 and PC3, i.e. influenced by natural water-rock interactions, seawater intrusion and some local fluorite dissolution. M3 is also influenced by carbonate balance represented by PC4. Samples V3, V4 and V5 are influenced by PC2 and PC3, indicating the impacts from seawater intrusion and local fluorite dissolution. Samples G8, G9, G10, M6, M7, M8 and M10 have positive loading on PC3 and PC4, indicating that these samples are governed mainly by local fluorite dissolution and carbonate balance. M2 is governed by PC1 and PC2, while V8 is influenced by PC2 and PC4. Actually, most of the samples are associated with PC1, PC2 and/or PC3, indicating that natural processes such as mineral weathering and ion exchange are responsible for the groundwater chemsitry in the study area, although PC1 represents some effects of local groundwater evaporation. Therefore, the results from correlation analysis can be regarded logical evidenced by PCA analysis.
Hierarchical Cluster Analysis (HCA)
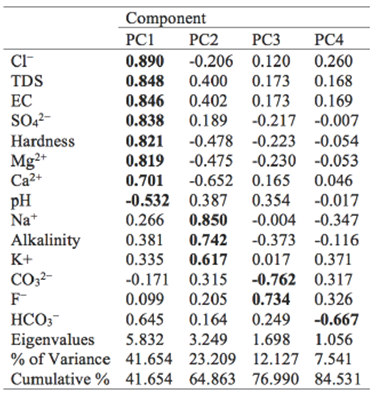
Figure 3 shows the dendrogram of Q mode HCA. Three distinct clusters can be divided by hierarchical cluster analysis as shown in (Figure 3).C1 includes 11 samples (M4, M5, M6, M7, M8, M9, M10, V9, V10, G2 and G3), C2 and C3 with a lower linkage distance, indicating that they have greater similarity.C2 includes 8 samples (V1, V2, V3, V4, V5, V8, M2 and M3) and C3 consists of 11 samples (G1, G4, G5, G6, G7, G8, G9, G10, M1, V6 and V7). The mean values of geochemical and physical data were presented in Table 4 to describe the characteristics of each cluster of samples.
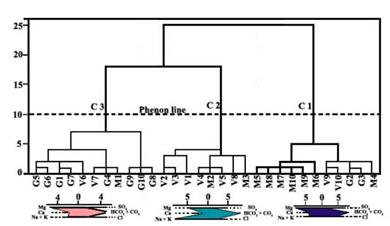
The stiff diagrams (Figure 3) and the data (Table 4) indicate that the three clusters are geochemically independent groups.C1 is represented by high concentrations of HCO3 -+CO3 2- and Cl- for anion and Mg2+ for cation, C2 is characterized by high levels of HCO3 -+CO3 2-for anion and high concentrations of Na++K+ and Mg2+ for cation, and C3 is characterized by high concentrations of HCO3-+CO3 2- for anion and Mg2+ for cation (Figure 3). C1, indicated by Table 3, is characterized by highest salinity and hardness and medium F- and alkalinity among the three clusters, while C3 possesses the lowest salinity, F- and alkalinity, and medium hardness, and C2 has medium salinity and hardness, highest alkalinity and F-
The distinct geochemical characteristics of the clusters indicate that they have undergone geochemical evolution of different types and intensities. Samples from the three clusters are all characterized by high concentration of HCO3 -+CO3 2-, but samples in C2 have more Na++K+ than those from C1 and C3. Considering that most of the samples in C2 are located closer to the sea than those from C1 and C3, it is possible that seawater intrusion may be a significant factor impacting the groundwater chemistry. The geochemistry of water samples in C3 are more likely to originate from rock weathering, but rock weathering is of different intensities for different samples in this cluster. Samples in C1 are also characterized by high C1-, which may be due to intensive evaporation.
Mechanism controlling the groundwater geochemistry
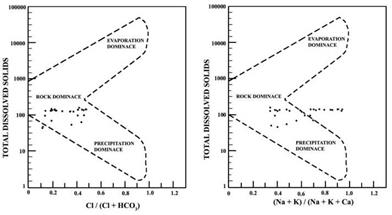
The Gibbs diagram can evaluate the hydrochemistry of groundwater in the study area. Mechanism controlling groundwater geochemistry a reaction between groundwater and aquifer minerals has a significant role in water quality which is useful to understand the genesis of water (Gibbs 1970; Subramani et al. 2009; Vasanthavigar et al. 2012). The chemical data of water samples of the area are plotted in Gibbs diagrams (Figure 4).In the present study, the Gibbs ratio 1 values vary from 0.11 to 0.48 and Gibbs ratio 2 values ranges from 0.34 to 0.94. The majority of the samples irrespective of the formation are falling in the rock weathering region. This is due to the chemical weathering with the dissolution with rock forming minerals.
Conclusions
The Gibbs diagram revealed that the hydrochemistry of groundwater falls in the rock weathering region and is due to dissolution with rock forming minerals. Pearson correlation analysis reveals that natural processes such as mineral dissolution/precipitation and cation exchange are dominant factors influencing the groundwater chemistry. Four components are extracted by the PCA. PC1 which explains the greatest of the variance represent a mixed influence of the dissolution/precipitation processes and salt water intrusion on the groundwater chemistry.PC2 is indicative of cation exchange triggered by salt water intrusion. PC3 and PC4 indicate relatively more local or specific effects such as the dissolution of fluorite and carbonate balance.
Three distinct clusters (C1-C3) are obtained through cluster analysis. Samples from C1 contain high level of Cl- that may be due to intensive evaporation and contamination from landfill leachate. Most of the samples from C2 are located closer to the sea and the high level of Na++K+ in these samples may be attributed to seawater intrusion. The geochemistry of water samples in C3 are more likely to originate from rock weathering.

