


 English (pdf)
 Article in xml format
 Article references
 Send this article by e-mail
 Cited by SciELO
  Cited by Google
  Similars in
SciELO
Similars in
SciELO  Similars in Google
 Permalink
1. Introduction
The space-time assessment of earthquake activity is an important tool in seismicity studies and some valuable results have been provided to the literature by different authors. Many researchers prefer to use different tools in practical applications of seismicity analyses, such as physical models, scaling laws and several different seismic parameters such as seismic b-value, fractal dimension, precursory seismic quiescence, annual probability, recurrence time, moment and energy releases. The magnitude-frequency distribution, known as the b-value of Gutenberg-Richter relation (Gutenberg and Richter, 1944), is one of the most commonly used as the power-law distribution of earthquakes. Estimating the variations of b-value may supply some useful relations between the frequency of earthquakes, seismic moment or energy. The b-value reflects the relative numbers of both large and small earthquakes, and is related to the properties of the seismotectonic structures, and stress distributions in time and space (Scholz, 1968). When b-value shows a decrease for a given region, one can make an assessment that there is a possibility of an earthquake occurrence. In addition to the b-value, the evaluation of the seismicity rate changes by considering the precursory seismic quiescence may supply remarkable outcomes. Wyss and Habermann (1988) made a definition of seismic quiescence phenomenon in the following way: "The seismic quiescence means that an important decrease in the average earthquake activity rate as compared to declustered background activity rate in the same crustal volume may be observed before the occurrences of some main shocks. This decrease in earthquake activity may occur within part, or all of the source volume of the subsequent main shock. Also, this decreasing trend may continue to the main shock time, or may be separated from it by a relatively short period of increasing trend in earthquake activity". Since the duration of quiescence depends strongly on tectonic structure and probably on the loading rate, the measurement of earthquake activity rate may be important to reveal the future earthquake potential. These types of parameters have been used in many seismicity studies for different parts of the world and also Turkey (e.g., Katsumata and Kasahara, 1999; Cao and Gao, 2002; Öztürk et al. 2008; Polat et al. 2008; Joseph et al. 2011; Öztürk, 2011; 2015a; Öztürk and Bayrak, 2012; Rehman et al. 2015; Negi and Paul, 2015; Yadav et al. 2015; Singh, 2016; Tsapanos et al. 2014; 2016).
2. Seismic and Tectonic Structures of the Eastern Anatolia Region
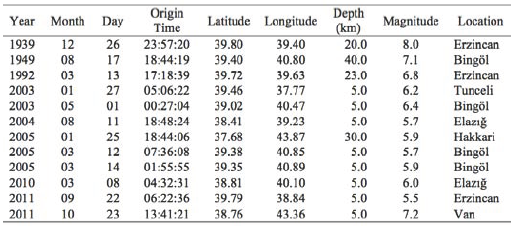
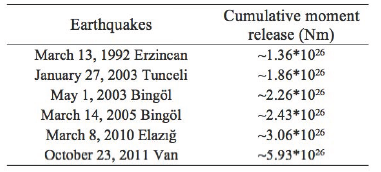
It is well-known that the Eastern Anatolia (EA) area is one of the most seismically active regions in Turkey, since many strong and destructive earthquakes have occurred in the past, such as on December, 26 1939 in Erzincan (M8.0), August 17, 1949 in Elmalidere-Bingöl (M7.1), March 13, 1992 in Erzincan (M6.8), January 27, 2003 in Tunceli (M6.1), May 1, 2003 in Bingöl (M6.4), August 11, 2004 in Elaziğ (M5.7), January 25, 2005 in Hakkari (M5.9), March 12, and 14, 2005 in Bingöl (M5.7 and M5.9). In addition, because of the occurrence of three recent earthquakes - "MW = 6.0 in Elaziğ, March 8, 2010; MW = 5.5 in Erzincan, September 22, 2011; and MW = 7.2 in Lake Van, October 23, 2011" -, studies of earthquake hazard potential for this region have become more important. Some details of these mentioned earthquakes are also given in Table 1.
Table 1 A list of some great and destructive earthquakes occurred in the Eastern Anatolia region of Turkey.
The EA part of Turkey has tectonically a very complex structure. The main tectonic regimes in this part of Turkey are the Eastern Anatolia Fault Zone (EAFZ), the Dead Sea Fault Zone (DSFZ), the Bitlis Thrust Zone (BTZ) and the Karliova Triple Junction (KTJ). The EAFZ is a transform fault forming parts of the boundaries between the Arabian and African plates, and between the Anatolian and the Eurasian plates (Westeway, 1994). This zone is a sinistral strike-slip fault zone and is about 550 km long. The EAFZ is thought to be a conjugate structure to the North Anatolian Fault Zone (NAFZ). It meets and forms triple junctions with the NAFZ and the Dead Sea Fault Zone (DSFZ), respectively (Bozkurt 2001). The DSFZ is a sinistral intraplate strike-slip fault zone, approximately north-south direction, and measures approximately 1000 km in length. It separates the Arabian Plate to the east and the African Plate to the west, and it is considered as a plate boundary of transform type (Şengör and Yilmaz, 1981). The African plate moves northward slower than the Arabian Plate and the DSFZ takes up this dissimilar motion between these plates. Thus, the DSFZ and EAFZ meet in a triple junction between the Anatolian, African and Arabian plates. The BZTZ is a complex collisional boundary of continent-ocean and continent-continent. The Eurasian and Arabian plates come into collision along the BZTZ and this clash results in the uplift of mountains along the suture zone. This boundary reaches to the north of fold-and-thrust belt of the Arabian platform and it extends from southeastern Turkey to the Zagros Mountains in Iran (Şengör and Yilmaz, 1981). A north-south compressional tectonic regime is dominant in the area to the east of the KTJ. This region is characterized by two combined strike-slip faults of sinistral and dextral character which is parallel to the NAFZ and EAFZ (Bozkurt, 2001). Compressional basins with east-west trending give shape to the most spectacular structures in the region. However, the major tectonics of EA are formed by the conjugate strike-slip fault systems.
Figure 1a shows the principal faults in the EA. A large detail on the tectonic structure of the EA can be found in some studies such as Şengör and Yılmaz (1981), Hempton (1987) and Bozkurt (2001). Also, there are several studies (e.g., Sayıl 2005; Bayrak et al. 2008; Öztürk, 2009; Öztürk and Bayrak, 2012; Tsapanos et al. 2014; Öztürk 2015b; Maden and Öztürk, 2015) for Turkey including the EA. These studies generally consider the regional and temporal variations of seismotectonic b-value, seismic quiescence Z-value, and some other statistical parameters for the analysis of earthquake behaviors, and their possible usage as precursors. For this reason, seismic and tectonic assessments of temporal changes in b and Z-values, cumulative seismic moment, annual probability and recurrence time of the earthquakes are evaluated in this study and it is aimed to present some useful clues for the future earthquake potential in the EA.
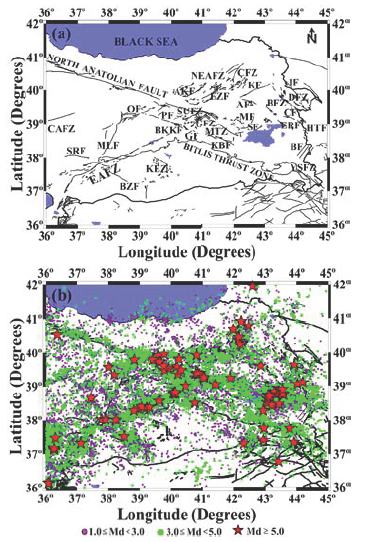
Figure 1 a) Main tectonic structures from Şaroğlu et al. (1992) and Bozkurt (2001). Names of the faults: EAFZ: Eastern Anatolia Fault Zone, NEAFZ: North East Anatolia Fault Zone, ÇFZ: Çobandede Fault Zone, AKF: Aşkale fault, EZF: Erzurum fault, KF: Kağızman fault, AF: Ağrı fault, IF: Iğdır fault, DFZ: Doğubeyazıt Fault Zone, BFZ: Balıklıgölü Fault Zone, ÇF: Çaldıran fault, ERF: Erciş fault, HTF: Hasan-Timur Fault, BF: BAşkale fault, YSFZ: Yüksekova-Şemdinli Fault Zone, SF: Süphan fault, MF: Malazgirt fault, SUFZ: Sancak-Uzunpınar Fault Zone, GFZ: Göynük Fault Zone, PF: Pülümür fault, BKKF: Bingöl-Karakoçan Fault Zone, GF: Genç Fault, MTZ: Muş Thrust Zone, KBF: Kavakbaşı Fault, KEZ: Karacadağ Extension Zone, BZF: Bozova fault, SRF: Sürgü fault, MLF: Malatya fault, OF: Ovacık fault, CAFZ: Central Anatolia Fault Zone. b) Epicenter distributions of whole catalog including 33,865 shallow earthquakes with MD≥1.0 between 1970 and 2015 for the Eastern Anatolia part of Turkey. Magnitude distribution of earthquakes are represented with different symbols.
3. Earthquake Database and Brief Description of Methods of Analysis
The earthquake database used in the scope of this analysis is obtained from Bayrak et al. (2009) for the time interval of January 6, 1970 to December 31, 2005. In addition, the catalog from January 1, 2006 to December 31, 2014 is prepared using the database of Bogazici University and Kandilli Observatory and Research Institute (KOERI). In total, a catalog of 33,865 earthquakes (original catalog) whose magnitude is equal to or greater than 1.0 with a depth <70 km is prepared between the coordinates 36°N and 42°N latitude, and 36°E and 45°E longitude. Duration magnitude, MD, is used in analysis and epicenter distributions of all 33,865 earthquakes with main tectonics drawn from Şaroğlu et al., (1992) and Bozkurt (2001) are plotted in Figure 1b.
In order to decluster the earthquake catalog into main and secondary events, Reasenberg's (1985) algorithm is used in this study because the exclusion of dependent events from the catalog is an important part of an earthquake hazard analysis. All dependent events are separated from independent ones, and these dependent events are substituted with a unique event by removing each cluster. In all, 9,515 events (nearly 28 %) were removed by the declustering method, and the declustered catalog of 24,350 earthquakes is obtained. Also, completeness magnitude, Mc, is also a very important parameter for many seismicity studies, and temporal changes in Mc-value can affect the results of the seismicity parameters, especially in b-value. Thus, the maximum number of earthquakes in the catalog is tried to be used for high-quality results for the analysis of all statistical parameters. Average Mc-value for the earthquake catalog from 1970 to 2015 is estimated as 2.9. There are totally 33,865 shallow earthquakes with magnitudes larger than or equal to 1.0 in the catalog. As stated above, the Reasenberg's declustering algorithm eliminated 9515 earthquakes. After the estimation of Mc-value as 2.9, the earthquakes with MD<2.9 are removed from the original catalog and the number of earthquakes with MD<2.9 is 13,793. Totally, about 68.83% of all events are subtracted from the original catalog and the number of events for Z-test is reduced to 10,557.
3.1. Gutenberg-Richter Relation, b-value
Gutenberg and Richter (1944) proposed an empirical relation for the frequency-magnitude distribution of earthquake occurrences. This power-law for the size distribution of earthquakes was given in the following form:

where N(M) is the expected number of events in a specific time interval with magnitudes greater than or equal to M, and a and b are constants. The a-value is proportional to the seismic activity rate, and variations in a-value depend on the length of the study area, observation period, and also number of events. The b-value is the slope of the magnitude-frequency distribution and b-value can be thought as one of the most important parameters for geotectonic and rheological characteristics in a given region. According to the results of laboratory experiments for rock fracture, a decrease in the confining pressure and an increase in the applied shear stress cause a reduction in b-value (Scholz, 1968). However, an increase in the thermal gradient, fracture density, or material heterogeneity in the geological complexity (Mogi, 1962) is related to high b-values. Many studies show that b-value of G-R is a scale invariant and it is related to the clustering and spacing properties of epicenters or distribution of fault segments.
One of the most fundamental observations in earthquake physics is the Gutenberg-Richter (G-R) relation. Ishimoto and Iida (1939) and Gutenberg and Richter (1944) suggested the linear equation (1) and this equation is also called as frequency-magnitude relation. It plays an important role in the formulation of realistic design earthquakes for a given region. In many cases, G-R relation for one and the same region or time interval follows the different regimes for small and large events (Olsson, 1999). An estimation of the maximum b-value in G-R relation was carried out by Olsson (1999) and the deduced maximum b-value was given as 1.5 (or with the error limits, between 1.30 and 1.64). However, Utsu (1971) suggested that b-value varies from 0.3 to 2.0 from place to place in each seismic region in the world.
The choice of the statistical method used for to estimate the b-value is an important and a critical point. Several algorithms can be used to estimate the b-value, but the maximum likelihood method by Aki (1965) is the most widely used and the most robust method to estimate the b-value. Traditionally, the b-value was estimated graphically, but more efficient estimation is carried out by the maximum likelihood method. It was derived from the quality of the first order moment, and later Aki (1965) showed that the maximum likelihood estimate maximize the likelihood function. Thus, it is given as in the following form:
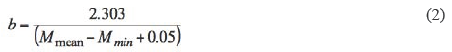
where Mmean is the mean magnitude of the earthquakes, and Mmin is the minimum magnitude of completeness in the earthquake catalog. A numerical value of 0.05 is a correction constant. Correct estimates of local variations in Mmin can be done if relatively large numbers (100 or so) of local observations are available for analysis. Confidence limits of 95 % on the calculations of b-value are, ,where n is the number of events used to make the estimation. This calculation gives the confidence limits of ±0.1-0.2 concerning b-value for a characteristic sample of n=100 earthquakes. Thus, the number of earthquakes in this work was 24,350 and the value of n=100 events is an ordinary sample for calculations and represent a specific calculation.
3.2. Precursory Seismic Quiescence, Z-value
The phenomenon of precursory seismic quiescence was originally committed by Wyss and Habermann (1988). Wiemer and Wyss (1994) introduced a methodology that can be performed in ZMAP software (Wiemer, 2001) and the recognizing of the seismic quiescence for different parts of the world has been reported in many papers. So, a brief description of the method will be given here.
A continuous image of rate changes in the earthquake activity and plotting the areas showing seismic quiescence in space and time can be provided by ZMAP by plotting in geographical coordinates. The standard normal deviate Z-test is one of the most common technique generally used for detecting of precursory seismic quiescence. In this study, Z-test is applied to detect the anomaly regions of precursory quiescence and Log Term Average (LTA) function is generated for the statistical assessment of confidence level in standard deviation units:
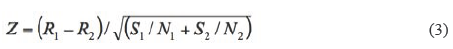
Where R1 is the mean rate in the overall background period, R2 is the average earthquake activity rate in the foreground window, S1 and S2 are the standard deviations in these periods, and N1 and N2 are the number of samples with a measured earthquake activity rate. Z-value is estimated as a function of time and named LTA.
4. Results
The cumulative number of earthquakes with time both the original catalog including all shallow earthquakes with MD≥1.0 (33,865 events) and declustered data including the earthquakes with MD≥2.9 (10,557 events) is shown in Figure 2. Any significant seismic activity is not observed from 1970 to 1995 and there is a little variation between 1995 and 2000. Conversely, there is a significant earthquake activity after 2000. However, it can be said that the database is separately homogeneous between 1970 and 1995, between 1995 and 2002, and between 2002 and 2015. KOERI and the other observatories have provided the real time data, especially after the construction of many stations in this area in recent years. Since this analysis focuses on the recent earthquake activity, completeness magnitude can be taken as 2.9 for all catalog as given in Öztürk and Bayrak (2012). Some authors such as Katsumata and Kasahara (1999), and Joseph et al. (2011) made detailed analysis on earthquake behaviors and they pointed out that the selection of the completeness magnitude and declustering of the catalog are an important stage for the analysis of earthquake occurrences. Katsumata and Kasahara (1999) made a seismic quiescence analysis for the 1994 Kurile earthquake. They made a completeness analysis and they used the declustered the catalog for their statistical estimations. Joseph et al. (2011) stated that just the main earthquakes must be considered in the recurrence analysis of earthquakes and all dependent events such as foreshocks and aftershocks must be excluded from the catalog before starting any calculations. As shown in Figure 2, the slope of cumulative number curve of the declustered data is smoother than that of the original catalog. It is a remarkable fact that these two processes removed the dependent events from the original data set. As an important result, after completing of the declustering process and completeness analysis, a more reliable, homogeneous and robust earthquake data is provided for the statistical estimations.
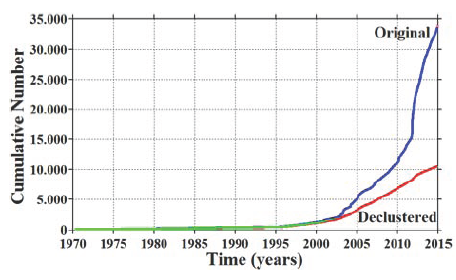
Figure 2 Temporal changes of the cumulative number of earthquakes for the original catalog including all Md≥1.0 earthquakes (33,865 events) and for the declustered data set with MD≥2.9 (10,557 events).
Magnitude and time histograms of the study region are given in Figure 3. As stated above, magnitudes of the earthquakes are between 1.0 and 6.6 and show an exponential decay in their numbers from the smaller to larger magnitudes. As shown in Figure 3a, the size of the many earthquakes varies from 2.0 to 4.0 and a maximum is observed for MD=2.8. The number of earthquakes with 2.0≤MD<4.0 are 30,591. However, there are 2119 evens with 1.0≤MD<2.0, 20,149 events with 2.0≤MD<3.0, 10,442 events with 3.0≤MD<4.0, 1074 events with 4.0≤MD<5.0, and 81 events with 5.0≤MD. Thus, the earthquake occurrences with magnitudes between 2.0 and 4.0 are more dominant than those of the others in the study region. It is clear that this increasing tendency in the number of relatively small events may be a sign of increasing stress in recent years in the EA. Also, time histogram from 1970 to 2015 is given in Figure 3b. There is a little change in the earthquake activity between 1970 and 2002, and the number of earthquakes including all magnitude levels in this time interval is 2191. There is also a stableness between 2003 and 2009, and the number of earthquakes in this period is 8879. However, an increasing trend in the number of earthquakes have started after 2010 and it has continued until 2012. The number of earthquakes between 2010 and 2012 is 15,128 and the maximum increasing is reported in 2012. The systematic increase in seismic activity shows a decreasing trend after 2012, and the number of earthquakes between 2012 and 2015 is 7667. As a remarkable fact, such kind of analyses can supply a useful perspective for the evaluation of seismicity rate changes which is associated with the temporal variations of precursory seismic quiescence in the EA.
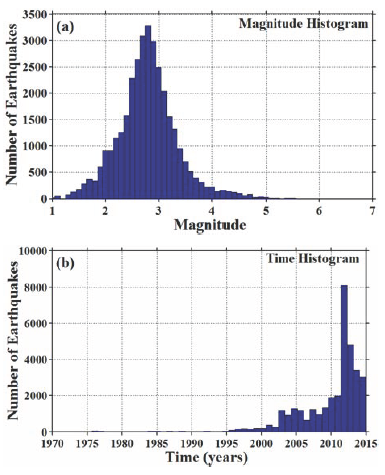
Figure 3 a) Magnitude histogram and b) Time histogram of the earthquake activity between 1970 and 2015.
Figure 4 shows the annual probabilities and recurrence times for different magnitude levels. Annual probabilities of earthquake occurrences for different sizes show relatively higher (30 and above) values between 3.5 and 4.0 magnitude levels, intermediate values (between 1 and 10) from 4.5 to 5.5 magnitude levels, and quite smaller values (<1.0) between 5.5 and 7.0 magnitude levels. Recurrence times of earthquake occurrences for different magnitude levels are also shown in Figure 4b. It is observed quite smaller (<1.0) years for magnitudes from 3.5 to 5.5. For magnitude level of 6.0, the values between 2.0 and 3.0 years are estimated while the values between 6.0 and 7.0 years are estimated for magnitude level of 6.5. It can be concluded that the occurrences of earthquakes between 3.5 and 4.0 magnitude level are more likely than those of the others, and an earthquake occurrence for a magnitude size larger than 6.0 can be expected in every seven years. These results can also be seen from Table 1 and the results of the recurrence times analysis support the existing earthquake potential in the EA. Consequently, such kind of analyses on the probabilities and recurrence times of earthquake occurrences for specific magnitude levels show that the EA has an earthquake risk potential for the possibility of strong earthquake occurrence.
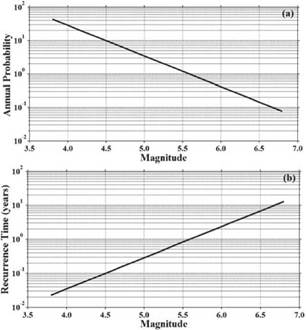
Figure 4 a) Annual probability and b) Recurrence time of the earthquakes for different magnitude levels in the EA region.
As stated above, the maximum likelihood method is preferred to estimate the b-value since this algorithm gives a more robust estimate than the least-square regression method (Aki, 1965). Figure 5 shows the cumulative number of events versus the magnitude of earthquakes. As shown in Figure 5, average Mc for the whole catalog from 1970 to 2015 is taken as 2.9 and b-value is estimated as 1.02±0.01. On global scale, b-value varies from 0.3 to 2.0 depending on region (Utsu, 1971) and is equal to 1.0 on average (Frohlich and Davis, 1993). As a result, both the Mc and b-value estimations in this study are similar to the results of the analysis by Öztürk and Bayrak (2012), and the magnitude-frequency distribution of the earthquakes in the EA is well represented by the G-R power law distribution with the b-value close to 1.0.
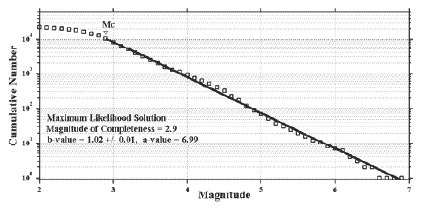
Figure 5 Gutenberg-Richter relation and b-value with its standard deviation. Declustered catalog is used for calculations and Mc-value is also given.
Changes in b-value as a function of time are plotted in Figure 6. Temporal variations of b-value are estimated for overlapping samples of 350 earthquakes per window. A systematic decrease can be seen until 1996, and the average b-value from 1970 to 1995 (464 earthquakes) is calculated as 1.28±0.1 with Mc=4.3. The b-value does not show any significant changes between 1996 and 2001 (1,168 earthquakes), and the average b-value is found to be 0.99±0.04, a lower value compared to that of the previous period, with Mc=3.4 for this period. However, there are great fluctuations and a clear increase in b-value between 2002 and 2010 (9,067 earthquakes), and the average b-value is computed as 1.25±0.02 with Mc=2.9 for this time interval, a larger value that that of the previous period. For the last time interval of 2011-2015 (13,651 earthquakes), there is a clear decrease in b-value and the average b-value is estimated as 1.08±0.01 with Mc=2.5. As seen in Figure 6, there is a clear increase from 2002 to 2011, whereas there is a clear decrease after 2011. In addition, one can see many fluctuations which are related to the period before the occurrence of large earthquakes between 2002 and 2015. There are 81 events whose magnitude is larger than or equal to 5.0 (Figure 1b), and the b-value shows a clear tendency of decrease before some of these strong main shocks in this time interval. Öztürk (2011) observed these types of decrease before some major earthquakes, such as the 1999 Izmit, 2003 Tunceli and 2003 Bingöl earthquakes. As mentioned above, many variables can affect the variations of b-value. It is thought that the decrease in b-value before the main shocks may be the result of increasing shear stress, and thus this tendency of decrease in b-value may be interpreted as an indicator of a possible earthquake in the EA.
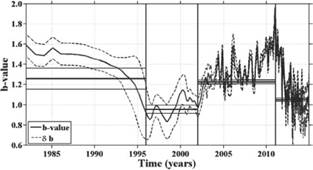
Figure 6 Changes in b-value and its standard deviation (dashed line, 5b) as a function of time, from 1970 to 2015. Thick horizontal lines show the average b-values, and the upper and lower thin horizontal lines shows their standard deviations. Declustered catalog is used for analysis.
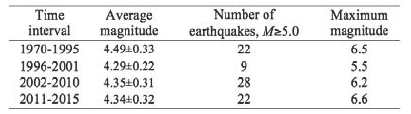
Figure 7 shows the magnitude variations of earthquakes as a function of time. In order to see the fluctuations in magnitude levels in the EA from 1970 to 2015, temporal distribution of earthquakes with MD≥4.0 is plotted. As shown in Table 2, the average magnitude is 4.49±0.33 for the time interval between 1970 and 1995, 4.29±0.22 between 1996 and 2001, 4.35±0.31 from 2002 to 2010, and 4.34±0.32 from 2011 until 2015. There are 22 events whose magnitude is equal to or larger than 5.0 (the largest magnitude among them is 6.5) between 1970 and 1995; 9 events from 1996 to 2001 (the largest among them is 5.5); 28 events from 2002 until 2010 (the largest has a magnitude of 6.2); and 22 earthquakes between 2011 and 2015 (the largest magnitude is 6.6). Magnitude-time histogram shows significant variations in the number of large events from 1995 but further on especially after 2002. The earthquake activity which is related to the clustering characteristics is obviously observable and it may correspond to a main earthquake in study region. Also, temporal clustering properties of the earthquake activity related to the earthquakes with MD≥5.5 is strong enough for many earthquakes which occurred in 1975, 1976, 1983, 1992, 1995, 1997, 2001, 2002, 2003, 2004, 2005, 2007, 2010, 2011.
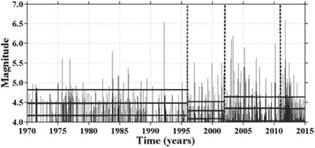
Figure 7 Temporal changes in earthquake magnitudes with Md≥4.0 including 1155 events between 1970 and 2015. Whole earthquake catalog is used for plotting. Thick horizontal lines show the average magnitude and the upper and lower thin horizontal lines shows standard deviations for these periods.
Cumulative moment variations (CMV) versus time from the declustered catalog are plotted in Figure 8. CMV is calculated as about 1.36*1026 Nm for the 1992 Erzincan, CMV~1.86*1026 Nm for the 2003 Tunceli, CMV~2.26*1026 for the 2003 Bingöl, CMV~2.43*1026 for the 2005 Bingöl, CMV~3.06*1026 for the 2010 Elaziğ, and CMV~5.93*1026 for the 2011 Lake Van earthquakes (Table 3). High values of moment release represent a high seismic energy release, and consequently the occurrence of strong earthquakes. It can be interpreted that temporal and regional changes in seismic moment are partly due to the variations in tectonic stress. The stress conditions in a given region after the occurrence of a strong earthquake will change, so the cumulative moment is expected to increase in proportion to the great energy released as the consequence of stress modification produced by the dynamic ruptures of the main shock. The total stress drop and cumulative moment depending on these conditions are associated with the seismicity of the focal region (Marcellini, 1995). As shown in Figure 8, sudden and high increases in cumulative moment are observed at the time when the main shocks occur. These large variations in cumulative moment are also in accordance with the temporal variations of magnitude as given in Figure 7, and there are clear uniformities in moment variations before the occurrence of great earthquakes as seen in Figure 8. This means that there are constant moment values in the period in which seismic activity is stationary, so it can be said that variations in cumulative moment are related to the changes of seismic activity. It can be seen from Figure 8 that there is a clear quiescence in the temporal variation of seismic moment after 2011, and thus if these kinds of behavior in the seismic moment can be described as a reliable indicator of future earthquakes, then these variations can give us significant evidence about the forthcoming earthquake hazard potential in the EA.
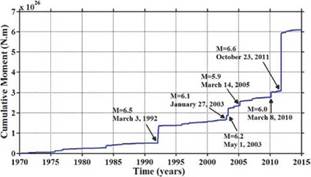
Figure 8 Cumulative moment release as a function of time from 1970 to 2015. Arrows indicate the occurrence of large earthquakes in study region. Whole earthquake catalog is used for analysis.
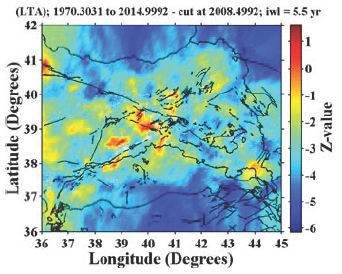
Regional variations in b-value as a function of time in the EA are given in Figure 9. This figure shows the changes of b-value between 2002-2010 and 2011-2015. In order to map these variations, the study region is divided into spatial grids of points with a size of 0.1° in latitude and longitude. There are six regions exhibiting large decrease (between -0.4 and -1.0 units) in b-value. These regions are centered at 39.03°N-37.19°E (region A, covering the CAFZ, MLF and OF), at 39.46°N-41.80°E (region B, the southwest of AF and KF), at 38.96°N-42.50°E (region C, the north ofLake Van, including MF), at 36.85°N-38.64°E (region D, the south of BZF), at 36.84°N-37.72°E (region E, the southeast part of the EAFZ), and at 36.35°N-36.29°E (region F, in the junction of the EAFZ and DSFZ). Regional variations in Z-value in the EA are shown in Figure 10. This demonstration supplies the spatial image of Z-value estimation at the beginning of 2015. In order to establish the distribution of precursory seismic quiescence, the study region is divided into spatial grids of points with a size of 0.1° in longitude and latitude. There are several areas exhibiting seismic quiescence at the beginning of 2015. These anomaly areas are observed on the north western part of the NAFZ, between AKF and EZF, on the PF, BKKF, SUFZ and GFZ, in and around the GF, between BF and YSFZ, on a part of the EAFZ, in the eastern and western parts of the MLF, in the southeastern part of the EAFZ, in the junction of the EAFZ and DSFZ, and in the southern part of the CAFZ. As shown in Figures 9 and 10, there are clear decreases in b-value and seismic activity rate Z-value in the several same areas: the CAFZ, MF, OF, the southeastern part of the EAFZ, and the junction of the EAFZ and DSFZ. As a remarkable fact, such kind of combination of these seismotectonic parameters may supply significant clues to reveal the seismic potential in the EA and thus, special interest needs to be paid to these anomaly regions.
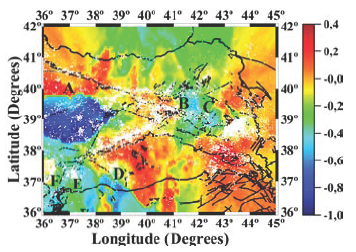
Figure 9 Regional variations of temporal b-value changes between 2002-2010 and 2011-2015 in the Eastern Anatolia region of Turkey. White dots show the declustered earthquakes used in the analysis. Main tectonics are also given.
5. Discussions
The EA has many important tectonic faults and fault systems and also is one of the most seismically active parts of Turkey. Many large and destructive main shocks have occurred in the last five years in the EA and so, the statistically analysis of earthquake behaviors would be important. In recent years, the space-time assessments of different statistical parameters have been made in order to put forth the earthquake hazard potential in the EA (Öztürk et al. 2008; Bayrak et al. 2008; Öztürk, 2009; Öztürk and Bayrak, 2012; Tsapanos et al. 2014; Öztürk 2015b; Maden and Öztürk, 2015). Also, several valuable investigations which are focused on the such kind of assessments, especially on b-value and seismic quiescence analysis, have been achieved by different authors for different parts of the world (e.g., Cao and Gao, 2002; Polat et al. 2008; Öztürk, 2011; 2015a; Rehman et al. 2015; Negi and Paul, 2015; Yadav et al. 2015; Singh, 2016; Tsapanos et al. 2016).
Polat et al. (2008) made a statistical analysis for the Aegean extension part of Turkey in order to evaluate the earthquake potential by using the seismotectonic b-value, fractal dimension Dc-value and standard normal deviate Z-value. Their results show that the regions with smaller b-values and larger Z-values may be interpreted as the possible areas for the large earthquakes. Öztürk (2011) and Öztürk (2015a) made a similar study on the space-time relationships between several seismotectonic parameters such as b-value, Dc-value and Z-value for the North Anatolia Fault Zone and the western Anatolia region of Turkey, respectively. In these studies, it is suggested that the correlations between these three seismic and tectonic parameters (for example, the regions with the lower b-value, larger Dc-value and higher Z-value) may give significant evidences for the future earthquake potential. Rehman et al. (2015) made an analysis on the spatial and temporal changes of b-value in and around the north Pakistan. They used different histograms, time series distribution of earthquakes and b-value map in order to characterize the seismic behaviors of different parts of Pakistan. Their results on the temporal distribution of b-value for Hazara region show a remarkable decrease before the occurrence of October 8, 2005 Kashmir earthquake. Negi and Paul (2015) made a comprehensive study for the spatial and temporal analysis of earthquake activity for Garhwal-Kumaun Himalaya region. They used b-value and Dc-value in order to explain the spatio-temporal characteristic of seismicity. They stated that the lowest b-value for the south east Garhwal indicates high stress conditions and also means that the number of small earthquakes in this region decreases relatively due to the stress accumulation. As a remarkable fact that, they suggested a temporal observation of b-value is necessary for the possible earthquake risk assessment. Yadav et al. (2015) achieved a probabilistic estimation for the most perceptible earthquake magnitudes in and around the NW Himalaya. They used two earthquake recurrence models of Kijko and Sellevoll and Gumbel's third asymptotic distribution for different 28 subregions. They stated that spatial distribution of these parameters presents a good relation with high seismic hazard regions in previously reported hazard maps, the maximum expected magnitudes and acceleration. They suggested that such kinds of maps may give useful information in the selection of preparing earthquake criteria for the antiseismic design of non-critical structures. Singh (2016) made a spatial analysis of seismic b-value for all NW Himalaya segment between 1964 and 2010 in order to understand the tectonic implications. Their results show that Garhwal-Kumaun segment with small b-value has a large seismic potential and indicates a high stress distribution. They suggested that b-value is a one of the most significant parameters for the seismic hazard assessment in a given region since the b-value is directly related to the changes of stress accumulation in the crust. Tsapanos et al. (2016) made an assessment of the relative largest earthquake hazard level in 28 subregions in and around the NW Himalaya. They used the Gumbel's third asymptotic distribution for the estimation of the largest earthquake in their study region. They suggested that spatial variations of their parameters such as b-value (upper bound magnitude) and K-index (relative seismic hazard level) may give useful clues for scientific goals along with the designation of priority areas for earthquake resistant design.
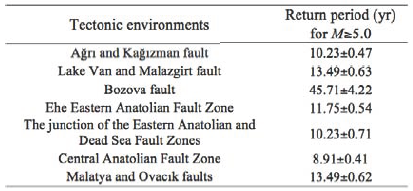
As mentioned above, some authors used different parameters to make an earthquake risk assessment in the EA. An estimation of the earthquake hazard parameters for different parts of Turkey is made based on Gumbel's I distribution by Öztürk et al. (2008). In their study, a few parameters such as the mean return period, the probable maximum magnitude and the probability of a great earthquake occurrence for some magnitudes and periods are estimated for different 24 regions in and around Turkey (Table 4). Their results show that the mean return period for Ms≥5.0 is calculated as 10.23±0.47 years in their region 2 including AF and KF in this study. The last earthquake greater than 5.0 was occurred in 2007 in this region. The mean return period for Ms≥5.0 was obtained as 13.49±0.63 years for their region 3 covering the Lake Van, and MF in this study. The last earthquake larger than 5.0 in this area was occurred in 2011. The mean return period for Ms≥5.0 was found as 45.71±4.22 years for their region 5 covering the BZF in this study. The last earthquake larger than 5.0 was occurred in 2012 in this zone. For their region 6, covering the EAFZ in this study, the mean return period for Ms≥5.0 was estimated as 11.75±0.54 years. The last earthquake larger than 5.0 in this zone was occurred in 2012. The mean return period for Ms≥5.0 was obtained as 10.23±0.71 years for their region 7 covering the junction of the EA and DSFZ in this study. The last earthquake larger than 5.0 was occurred in 2002 in this region. The mean return period for Ms≥5.0 was calculated as 8.91±0.41 years for their region 22 covering CAFZ in this study. For their region 23, including MLF and OF in this study the mean return period for Ms≥5.0 was estimated as 13.49±0.62 years. The last earthquake larger than 5.0 was occurred in 2012 in regions of 22 and 23. The mean return period for Ms≥5.5 was found as 7.50±0.09 years for their region 24 including the eastern part of the NAFZ in this study. The last earthquake with magnitude 5.5 was occurred in 2011 in this zone. Taking into consideration the mean return period values for strong events whose magnitudes are larger or equal to 5.0 from Öztürk et al. (2008), the areas covering AF and KF may have a next earthquake potential between 2017 and 2018. For the other anomaly regions, however, the future time of a strong earthquake can be expected after 2020.
Table 4 Return periods for some regions of EA part of Turkey. These values are taken from Öztürk et al. (2008).
Bayrak et al. (2008) made a seismicity analysis for different 24 seismogenic zones using Gumbel first asymptotic distribution and Gutenberg-Richter relation. They stated that their estimations of b-values with the maximum likelihood method for the Gutenberg-Richter relation have a good consistency with the tectonics. They calculated similar b-values for their region 1 (b=0.74, in NEAFZ), region 2 (b=0.76, in AF and KF), region 3 (b=0.78, including Lake Van, and MF) and region 7 (b=0.79, in a part of DSFZ). As given in Bayrak et al. (2008), these regions include the earthquakes such as 1924 Pasinler, 1983 Horasan, 1976 Çaldiran and 1903 Patnos, and these authors stated that these low b-values are related to the low heterogeneity degree and great faults causing destructive earthquakes. They also calculated b-values smaller than 1.0 in their region 4 (b=0.96, in Bitlis Thrust zone), region 5 (b=0.94, including BZF and KEZ), region 6 (b=0.91, in EAFZ). According to the GPS (Global Positioning System) data, there is a total shortening of 10±2 mm/yr between the strike slip faults in eastern Turkey and thrusting along the Caucasus (McClusky et al. 2000). Also, sinistral motion in the EAFZ is given as 9±1 mm/yr (McClusky et al. 2000). Because of the seismic activity rate and the fault slip rate, the b-values in regions 1, 2, 3 and 7 are smaller than those of regions 4, 5 and 6 (Bayrak et al. 2008). The b-values are estimated as 0.62 for their region 22 (including CAFZ, 0.58 for their region 23 (covering MLF and OF), and 0.68 for their region 24 (including the eastern part of the NAFZ), respectively. These resulting values show that these areas are not multifractal regions and have a large homogeneity degree (Bayrak et al. 2008). Also, many researchers such as Öztürk (2011) and Öztürk (2015a) observed a decreasing trend in the b-value before the occurrence of a large earthquakes. Consequently, as seen from the results, the regions with small b-values in their study and the regions showing great decrease in b-value in this study cover the same regions: CAFZ, MLF, OF, AF, KF, Lake Van, MF, BZF, EAFZ and the junction of the EAFZ and DSFZ. As a remarkable fact that, the data, estimations and anomaly regions in this study are more up-to-date and the similar with those of Bayrak et al. (2008).
An earthquake hazard evaluation in the EA in terms of seismic quiescence Z-value was made by Öztürk (2009). In this study, he aimed to estimate the duration of precursory quiescence for the strong earthquakes occurred in EA and used a few strong earthquakes greater than 5.0 between 1970 and 2005. In Öztürk (2009), average precursory quiescence duration before a strong earthquake in the EA is estimated about 5.0±1.5 years. Then, regional distribution of precursory seismic quiescence in the EA at the beginning of 2009 is analyzed by Öztürk and Bayrak (2012). They observed four anomaly regions around Aşkale (Erzurum), Ovacık (Tunceli), Elaziğ and Bingöl and, Van Lake. In two of these areas, 2010 Elaziğ and 2011 Lake Van earthquakes are occurred, but not Aşkale and Ovacık. However, a similar anomaly is observed in Ovacık region. As a result, this common area in which both seismic quiescence and low b-value are observed may be considered as a potential earthquake zone. Therefore, these kinds of seismic behaviors can be an important clue for the region of next earthquake occurrences. Öztürk and Bayrak (2012), Tsapanos et al. (2014), Maden and Öztürk (2015), and Öztürk (2015b) made a detailed evaluation of earthquake hazard potential for including the EA by using different statistical parameters. Öztürk and Bayrak (2012) achieved a statistical analysis for the eastern part of Turkey by using the Gutenberg-Richter b-value and by applying the standard normal deviate Z-test. The b-value is calculated as 1.07±0.09 with a completeness magnitude of 3.0. Their results indicate four quiescence regions (with high Z-value) at the beginning of 2009 and these anomaly regions are observed around Erzurum (Aşkale), Tunceli (Ovacık), Elaziğ, Bingöl and Lake Van. The b-value estimated in this study (b=1.02 with Mc=2.9) is smaller than that of Öztürk and Bayrak (2012). Also, several seismic quiescence anomalies estimated in this study are the same regions with Öztürk and Bayrak (2012) and these regions cover Erzurum, Tunceli, Elaziğ, Bingöl cities including AKF, PF, BKKF, SUFZ, GFZ, in and around the GF, between BF and YSFZ. A significant result of Öztürk and Bayrak (2012) is that March 8, 2010 Elaziğ, September 22, 2011 Erzincan and October 23, 2011 Lake Van earthquakes occurred in the seismic quiescence areas which are detected by them. When compared the results in both studies, it is clear that b-value is in a decreasing trend in recent years and this decrease can be also seen in Figure 6 in this study. Also, such kinds of assessments which is made on the seismicity rate changes can play an important role in the estimation of possible location of next earthquakes and in the earthquake hazard potential.
Tsapanos et al. (2014) made a study including regional changes of seismicity parameters in and around Turkey. For this purpose, they used the Gumbel's third asymptotic distribution of extreme values in order to define the seismicity pattern. They suggested that there is a good relation between their seismicity parameters and the tectonic structures for Turkey and surrounding area. They calculated a high value of upper bound magnitude w-value in the eastern part of Turkey. According to their earthquake hazard maps (Figures 2 and 3 in their study), the larger w-values greater than 7.0 can be seen from the geographical distribution of the parameter of the 50-years mode in the NAFZ, in the EA and in the western part of Turkey. They related these large and very large values with the seismotectonically active zones and, they stated that large values in the eastern part of Turkey are related to the BTZ. Consequently, the higher w-values estimated by Tsapanos et al. (2014) in the EA cover the anomaly areas of b-value and Z-value found in this study.
Spatial distribution of b-value for the EA is also mapped by Maden and Öztürk (2015). They searched the relations between b-value, Bouger gravity and heat flow data for tectonic implications. They calculated the b-value as 1.11±0.08 with a completeness magnitude of 2.8. one can clearly see that calculated b-value in this study (b=1.02 with Mc=2.9) is smaller than that of Maden and Öztürk (2015). So, it can be said that b-value decreases at the beginning of 2015 (see Figure 6). According to their spatial results, low b-values are shown in and around ÇFZ, AF, KF, the north, south and east of Lake Van, the west of AKF, on the EAFZ and BTZ, between MLF-SF-BZF, between MTZ and KEZ, in the south east part of the EAFZ, and in the junction of the EAFZ and DSFZ. Thus, the areas having small b-value estimated by Maden and Öztürk (2015) and the areas exhibiting great decrease in b-value in this study include several same regions: AF, KF, the north of Lake Van, in the south east part of the EAFZ, and in the junction of the EAFZ and DSFZ. Such decreases can imply an increase in stress relaxation in the mentioned parts of the EA. By contrast, relatively small variations in b-value during the post-2011 epoch may be related to a relatively small stress distribution in which energy can be spent along with time during the earthquakes. Thus, the earthquake dataset and anomaly regions of b-value in this study are more up-to-date and the similar with those of Maden and Öztürk (2015).
Öztürk (2015b) made a comprehensive statistical analysis for the EA. For this purpose, a modelling on the fractal dimension of earthquakes and intermediate-term forecasting for the location of expected earthquakes were achieved. The EA was divided into 19 seismogenic zones for a detailed evaluation. For each region, b-values and Dc-values were estimated and a relationship between seismotectonic b-value and fractal dimension Dc-value was determined by comparing different regression methods. It is also generated a composite forecast map based on the relative intensities (RI method) and pattern informatics (PI method). According to the results of Öztürk (2015b), small b-values and large Dc-values are observed in the NEAFZ, AF, KF, DFZ, BFZ, ÇF, BF, ERF, SF, BTZ, BKKF, SUFZ and the eastern part of the NAFZ. According to the composite forecast map by Öztürk (2015b), several hazardous regions were identified for the possible locations of the next earthquake occurrences: in and around AKF, the west part of the Lake Van (between SF and ERF), around YSFZ, around and in the north part of OF, on the EAFZ, on a part of NAFZ (between MTZ and PF). When compared the results of this study and Öztürk (2015b), it can be clearly seen that the results of spatial distributions of b-value and Z-value in this study are suitable with the results of Öztürk (2015b).
6. Conclusions
A space-time assessing in the Eastern Anatolia part of Turkey is achieved by evaluating several seismotectonic parameters. Seismic activity in this region show an important increase in recent years and 50 earthquakes with MD35.0 occurred after 2002. Average value of completeness magnitude is calculated as 2.9 and the b-value is estimated as 1.02±0.01. Important fluctuations and increases are observed in b-value (1.25±0.02) between 2002 and 2010. However, a clear decrease is observed in b-value from 2011 to 2015 and the b-value is calculated as 1.08±0.01. Cumulative moment releases are estimated as about 1.36*1026 Nm after the 1992 Erzincan, ~1.86*1026 Nm after the 2003 Tunceli, ~2.26*1026 after the 2003 Bingöl, ~2.43*1026 after the 2005 Bingöl, ~3.06*1026 after the 2010 Elaziğ, and ~5.93*1026 after the 2011 Lake Van earthquakes. However, a quite clear quiescence in temporal changes of cumulative seismic moment is detected after 2011.
An increasing trend in the number of earthquakes until 2012 tends to decrease after 2012. Analyses of probability and recurrence time of the earthquakes suggested that the Eastern Anatolia region of Turkey has an earthquake risk potential for the probability of large earthquake occurrence in the future. An important decrease is observed in temporal variations of b-values for the time interval of 2011 to 2015 in comparison with those for the time period of 2002 to 2010. Also, there are several regions exhibiting seismic quiescence at the beginning of 2015. The regions having remarkable decreases in b-value and Z-value at the beginning of 2015 cover the Central Anatolia Fault Zone, Malatya and Ovacık faults, the southeastern part of the Eastern Anatolia Fault Zone, and the junction of the Eastern Anatolia and Dead Sea Fault Zones. As a remarkable fact, the decreases in the number of earthquakes after 2012 support the temporal variations of b-value and seismic quiescence Z-value. Consequently, a decrease in the b-value, seismic quiescence anomalies, recurrence times of earthquakes and seismic moment variation may be an indicator of high stress release, and these changes may be interpreted as an evidence of strong earthquake occurrences in the next future in the Eastern Anatolia region of Turkey.

