


 English (pdf)
 Article in xml format
 Article references
 Send this article by e-mail
 Cited by SciELO
  Cited by Google
  Similars in
SciELO
Similars in
SciELO  Similars in Google
 Permalink
Introduction
The Loess Plateau, located in Northwest China, is a key agricultural area for the country. However, it is also susceptible to some of the most severe soil and water losses on the slope in the world (Bo et al., 2011; Chen et al., 2007; Li et al., 2015; Mi et al., 2014). As a result, numerous studies have investigated the soil and water losses on the hillslope from the Plateau (She et al., 2010; El-Jakee et al., 2016). These studies have mainly focused on ecosystem management.
to reduce the soil and water losses by optimizing land use structure, which could involve steep terracing slopes, converting cultivated steep slopes to forests and grasslands, banning grazing, constructing reservoirs and check dams, etc. Therefore, there is an urgent need for developing novel and effective measures to improve soil structure at the Loess Plateau. The implementation of these measures facilitated vegetation restoration and ecological conservation. However, even though the soil layer on the Plateau is very thick, its weak structure and/or coarse texture often leads to a low soil water holding capacity. Furthermore, surface runoff generated during rainstorms, which can be intense, can still reduce the effectiveness of local soil erosion and water controls.
In the past decade, there has been a rapid growth in the manufacture and use of soil amendment in helping with the soil water capacity, such as biochar and charcoal. But high rates of this amendment, always 100 and 200 t/ha, which is not practically feasible at farmer level (Zhou, 2006; Liu and Liu, 2010).
Nanomaterials have been used in a wide range of industrial and agricultural fields (Kammann et al., 2013; Nayak et al., 2013). Nanocarbon has been found to improve plant growth. Khodakovskaya et al. (2009) found that nanocarbon was able to penetrate the thick coat of tomato seeds and enhance water uptake into the seed, which improved seed germination and the growth of the tomato seedlings in water culture experiments. Subsequently, Kammann et al. (2013) reported that tomatoes produced two times more flowers and fruit when grown in soil containing carbon nanotubes than when grown in soil without carbon nanotubes. Fan et al. (2012) concluded that the application of different levels of nitrogen fertilizer and nanocarbon significantly affected nitrogen use in a rice paddy field with a saline-alkali soil, and that yield increased when nitrogen was added with nanocarbon. When Wu (2013) applied nanocarbon contained within two slow-released fertilizers, rice yields and nitrogen use efficiency both increased while nitrogen losses in the surface water runoff from the paddy soil for both slow-released fertilizers decreased when compared to the fertilizers alone.
The capacity of nanocarbon to adsorb other elements is also of importance. Liu and Cheng (2012) found that Cu2+ and Cd2+ were better adsorbed onto a modified oxidized nano-carbon black sorbent. Wang et al. (2009) applied nanocarbon near the roots of ryegrass and found that there were reductions in the Cu and Zn concentrations in the ryegrass and that the ryegrass biomass increased. Khaydarov et al. (2012) reported that nanocarbon-polymer compositions were effective in removing metal ions from contaminated groundwater and soil.
There have been many studies about uses of nanocarbon in agriculture. However, most of them focused on the ability of nanocarbon to adsorb heavy metals and improve crop yields. There is a scarcity of published studies on the effects of nanocarbon on soil water holding capacity, especially in sandy soils. Soil water holding capacity is a major factor that can affect soil erosion by water, as well as plant growth (Heathman et al., 2003; She et al., 2014).Tan et al. (2014) found that nano carbon could increase the water contents effectively in columns of the disturbed soil column. These findings are important since they imply that nanocarbon would also reduce water losses due to percolation to deeper soil layers and that soil layers containing nanocarbon can hold more water for a longer time, for example, in soil near to plant roots. One of the advantages of nanocarbon made of coconut shell, when compared to metallic nanomaterials, is that carbon naturally exists which is also good for controlling carbon emission (Nair, 2010). Consequently, the use of nano-carbon materials in agriculture is more acceptable and has been widely propagated.
Therefore, in this paper, the effects of different nano-carbon contents of layers containing nanocarbon-soil mixtures on soil water infiltration and soil water characteristic curves (SWCC), as well as on soil water content distributions in the soil profile after infiltration ceases were examined. Since nanocarbons are expensive, we also investigated the effect of reducing the thickness of the soil-nanocarbon layers, which would, in turn, reduce the costs, on these soil water properties.
Soil and nano carbon
The soil used in the study was an aeolian sandy soil, typical of soils on the Loess Plateau. It developed from loessial parent material and was characterized by a loose structure and high erodibility. The soil was collected from the Shenmu Soil Water Conservation Field Station, the Chinese Academy of Sciences (110°11'-110°23Ε, 109°19'23"E, 38°46'-38°50E), Yulin County, Shaanxi Province. The collection site has a semiarid area climate with a mean annual rainfall of 437 mm, of which about 70% falls in intense storms between June and September that can cause high soil and water losses. To reduce the influence of organic matter found in the topsoil, the upper 10 cm soil layer was removed first, and only soil from the 10~25 cm layer of the profile was collected. Debris, which included dead leaves and animals, was removed, and the soil was air-dried and passed through a 2-mm sieve. Particle size analysis was determined by sieving and the pipette method (Lv, 1992).the particle size distribution is as follows, sand content, 0.482 kg kg-1; silt content, 0.255 kg kg-1, which belong to the Aeolian sandy soil according to the USDA soil system (Hillel, 1982). The nanocarbon used in this study was supplied by the Hainuo Nano Material Company (Shanghai), China and the mean specifications of the particles were: 40 nm diameter; 0.99 g cm-3 density; purity 99%.
Infiltration experiment
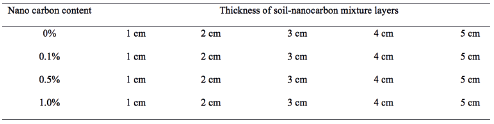
In this part, the effect of nanocarbon contents and thicknesses of soil-nanocarbon mixture layer on infiltration was studied. The nanocarbon was mixed well with the air-dried soil samples to give four different gravimetric contents (0%, 0.1%, 0.5%, and 1.0%). Then the mixtures with different thickness (1 cm, 2 cm, 3 cm, 4 cm and 5 cm) were applied to the packed soil columns (10 cm in diameter, 50 cm in length) 20 cm below the surface where is near most of the plant roots (shown in Figure 1).
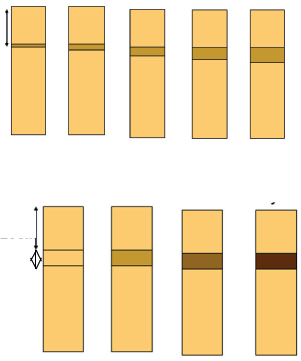
Figure 1 Columns of sandy soil with soil-nanocarbon mixture at different nanocarbon contents and thicknesses.
The bases of all of the columns were perforated and were covered by a coarse filter paper, to permit water to drain and prevent air entrapment while retaining the soil. The surfaces of the soil mixtures were also covered with a circle of filter paper to reduce disturbance from the inflowing water.
Infiltration experiments were carried out by rapidly establishing and then maintaining a constant 2 cm head of deionized water on the surface of the soil using a Mariotte bottle. The cumulative infiltration rate was initially determined from the volume of water supplied from the Mariotte bottle measured at timed intervals. The infiltration experiments were carried out in three replications in a laboratory where the mean temperature was 28±3 °C. Relative humidity was not controlled but remained at 40%±10%. The top 40cm of the soil columns at every 3cm depth increment was sampled just after the infiltration process, and the gravimetric soil water content was determined by mass loss during ovendrying at 105 °C.
Soil water characteristic curve (SWCC)
To understand the effect of nanocarbon on SWCC, the air-dried sandy soil was thoroughly mixed well with the nanocarbon with five different gravimetric contents (0%, 0.1%, 0.5%, 0.7% and 1%). All the mixtures were packed into a cutting ring (100 cm3 in volume) to give a bulk density of 1.4 g cm-3. The rings with the combinations were placed in distilled water to become slowly saturated within about 12 hours. Each saturated mixture was placed in a centrifuge tube. The tubes were centrifuged in a state make and model of centrifuge. To measure the water contents of the mixtures at different pressure heads, centrifugation was carried out at specific rotation speeds corresponding to known pressure heads. After attaining equilibrium at each given pressure head, the tubes were removed from the centrifuge to determine the gravimetric water content of the mixture. Excess water was poured off, and the mass of the mixture was measured using an electronic balance (precision of 0.01 g). The procedure was repeated sequentially as the pressure head was increased to the highest level of 10200 cm. Centrifugation was carried out at 20. At the end of the experiment, the gravimetric water content of the mixture samples was put into the oven-drying at 105°C for 24 hours. Subsequently, the volumetric water contents of the different mixtures at each pressure head were determined from the dry bulk density and gravimetric water content. The SWCC was then obtained by plotting the pressure head (cm) against the volumetric water content (cm●cm-3).
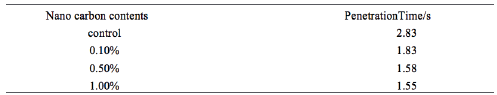
Water repellency of the tested nano carbon-soil mixture samples.
The soil samples were mixed well with Nanocarbon contents at five different gravimetric contents (0%, 0.1%, 0.5%, 0.7% and 1%). A WDPT test (water droplet penetration test) was also used to measure water repellency (King, 19981 in this study to understand the effect of Nanocarbon contents on water repellency. The penetrate time was recorded. Each treatment has ten replicates. And the results are shown as follows with the mean values (in Table 1).
Brooks-Corey model (BC)
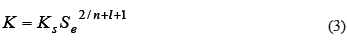
According to Brooks and Corey (1964), SWCC functions are given by:
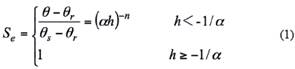
where Se is the degree of saturation; θ is the volumetric water content (cm3 cm-3); qs is the saturated volumetric water content (cm3 cm-3); θr is the residual volumetric water content (cm3 cm-3); α is an empirical parameter (cm-1) whose inverse is often referred to as the air entry value or bubbling pressure; h is the soil water pressure head (cm); and n is a pore-size distribution parameter affecting the slope of the retention curve.
Van Genuchten Model (VG)
Van Genuchten (1980) found relatively simple functions could describe the SWCC well:
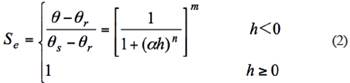
Where Se, θ, θs, θr, α, h, n, and Ks are the same as in Equation (1), and m is an empirical parameter. According to the statistical pore-size distribution model of Mualem (1976), the parameter m is expressed as m=1-1/n (n>1).
Burdine's Model
Burdine (1953) proposed a model that described the hydraulic conductivity (K). When the BC is used in Burdine's model, the hydraulic function is given by the expression:
where, l is a pore-connectivity parameter, which was assumed to be 2.0 in the original study of Brooks and Corey (1964); Se and n are the same as in Equation (1), and Ks is the same as in Equation (3).
Mualem's Model
Mualem (1976) described a new model for predicting the hydraulic conductivity. Combined with VG, the hydraulic conductivity is given by:
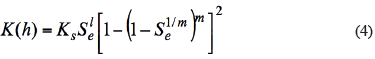
Where Ks, l, and Se are the same as in Equation (4), and m is the same as in Equation (2). The pore-connectivity parameter, l, in the hydraulic conductivity function was estimated to be about 0.5 and was considered as a mean value that could be valid for many soils (Mualem et al., 1976).
To analyze the cumulative infiltration data, we fitted the experimental data with Philip's infiltration equation (Equation (5)), the parameters of which are presented in Table 2:
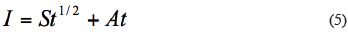
(5)where I is the cumulative infiltration (L), t is the time (T), and S is the sorptivity (L T-1/2), A is the steady-state infiltration rate (L T-1).
Results and discussion
Effect of soil-nano carbon mixture layers on soil water infiltration processes
Effect of different nano carbon contents on cumulative infiltration
Figure 2 presents the effect of nanocarbon contents on the soil water infiltration process. Smooth cumulative infiltration curves were obtained for all nanocarbon contents and followed a similar pattern to those typical for homogeneous soils without nanocarbon. This indicated that the fine soil matrix was continuous in all cases. During the early stage of the infiltration process, there was no noticeable effect of nanocarbon content on cumulative infiltration since the wetting front had not yet entered the soil-nanocarbon mixture. When the wetting front reached the soil-nanocarbon mixtures, 20 cm below the soil surface, the nanocarbon content had significant effects on the infiltration rates of all four soil-nanocarbon mixtures in each of the five-layer thicknesses. The cumulative infiltration increased with increasing nanocarbon content. This was the opposite effect of that reported by Tan et al. (2014) for various mixture compositions in different soil columns that were each filled by a particular homogenous soil-nanocarbon mixture. Cumulative infiltration increased at significantly faster rates when nanocarbon was present than when it was not present. This indicated that the presence of a soil-nanocarbon layer at a depth of 20 cm within the soil profile could accelerate infiltration. There was no noticeable difference between the effects of the 1% and 0.5% nanocarbon contents on cumulative infiltration.
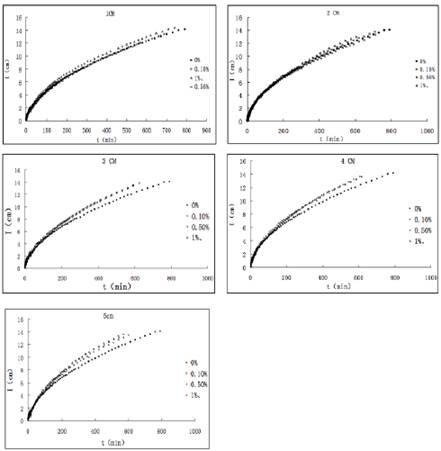
Figure 2 Effect of nanocarbon contents on soil water infiltration for 5 soil-nano carbon layer thicknesses.
Soil water infiltration could be affected greatly by hydrophobic materials which are either intermixed with the soil or coat the mineral soil particles. The infiltration curves for wettable and water repellent soils presented earlier reflect this effect (Figure 2). The practical implications of water relations in these hard-to-wet soils (such as the effects on plants, runoff, and erosion) have led to numerous studies on water movement. The effect of hydrophobic substances on water movement in soils provides a basis for characterizing water repellency.
Effect of different thicknesses of nano carbon-soil layers on soil water infiltration
Incorporating nanocarbon into the soil profile at depth incurs high costs and requires more labor. Therefore, it is desirable to apply the most cost-effective amount of nanocarbon possible to reduce the expense of the treatment. This raises the important question as to how much nanocarbon is needed in the sandy soil. Therefore, we investigated the effect of changing the thicknesses of the soil-nano carbon layers on soil water infiltration (Figure 3). Smooth cumulative infiltration curves were obtained for all soil-nanocarbon layer thicknesses, which followed a pattern similar to those typical for homogeneous soils without nanocarbon. This indicated that the fine soil matrix was continuous in all cases. Cumulative infiltration increased at a significantly faster rate when the thickness of the soil-nanocarbon mixture increased. This also indicated that the presence of soil-nanocarbon at 20 cm depth within the soil column could accelerate infiltration of all the layer thicknesses investigated.
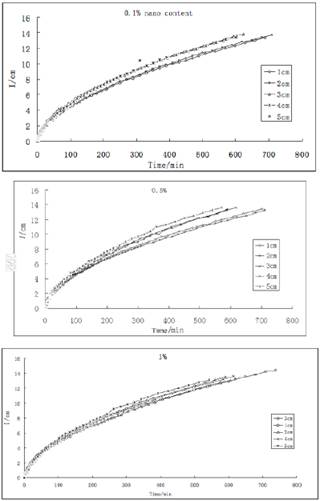
Figure 3 Effect of soil-nanocarbon layer thickness on soil wáter infiltration for three nanocarbon contents.
The effect of the three thicker soil-nano carbon layers (3, 4, and 5 cm) on cumulative infiltration was considerably greater than that of the two thinner layers (1 and 2 cm). Statistically, there were no significant differences for cumulative infiltration among the mixture layers with thicknesses of 3, 4 and 5 cm. This would suggest that a layer of the soil-nanocarbon mixture that was 3 cm thick would be sufficient to improve cumulative infiltration and that increasing the thickness of the layer would not result in further improvement.
To analyze the cumulative infiltration data, we fitted the experimental data with Philip's infiltration equation, the values of the fitted parameters for each of the 20 treatments are presented in Table 3.
Table 3 Parameters for the Philip infiltration equation determined for columns with soil-nanocarbon mixture layers having various nanocarbon contents and layer thicknesses.
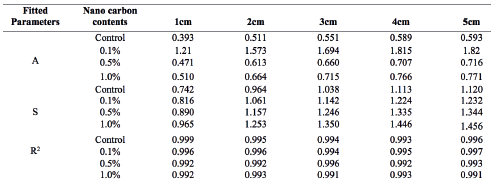
Note: R2 is the coefficient of determination for the fit of I = St 1/2 to the experimental data, where I is the cumulative infiltration, t is the time, S is the sorptivity, and A is the steady-state infiltration rate, with the experimental data
Philip's infiltration equation considers both the downward movement of water, due to gravity, and advection due to matric forces. The coefficient of determination, R2, values were all above 0.99, which indicated that the equation effectively described the relation between cumulative infiltration and time during the course of our experiment. Both the sorptivity and the steady state infiltration were affected similar by either increasing the nanocarbon contents or the thicknesses of the soil-nanocarbon mixture layer (Table 3).
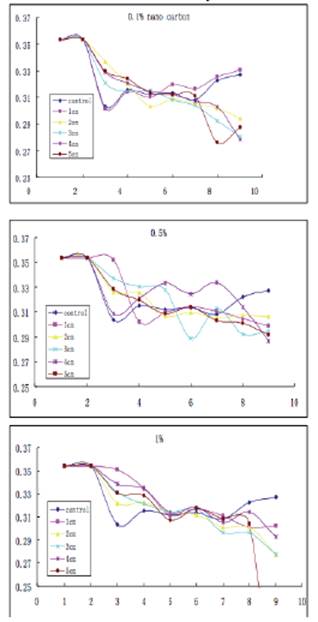
Figure 4 Effect of nanocarbon layer content and thickness on soil water contents at ten 3-cm depth increments in the soil profile
The main effect of the presence of the nanocarbon is to act as a strong absorptive for water transmission. The values of sorptivity determined by Philip’s equation were higher for nanocontents of 0.5% and 1% than for the soil alone and may be an indication of this increased soil water infiltration ability.
During the initial stage of the infiltration process, water movement into the dry soil was faster due to the presence of the matrix potential that existed at the wetting front between the wet and dry soils. The presence of the soil-nanocarbon layer might be expected to represent a discontinuity in the soil pore system.
However, the matrix potential might also be expected to increase with increasing nanocarbon contents when the wetting front reached the soil-nanocarbon layer.
However, from our data, it appears that there was a critical nanocarbon content of about 0.5%, for the 3-cm thick soil-nanocarbon layer. We attributed this to a greater degree of special characteristic of nanocarbon in the soil profile.
Effect of different thicknesses of soil-nano carbon layers and nano carbon contents on soil water contents in the soil profile
The findings of this study presented above have shown that the soilnanocarbon could increase soil water infiltration rates. This might help reduce the amount of runoff considerably from the slopes on the Loess Plateau. This suggestion should be investigated further in rainfall simulation experiments.
However, it is not clear that the nanocarbon layer could hold sufficient soil wáter for crop growth on the semi-arid Loess Plateau. After the infiltration experiments ended, the soil in the column was sampled at every 3-cm depth increment to find out where the infiltration water was stored. The measured soil water contents of these soil samples are shown in Figure 5. The soil water content in the control soil column varied little with depth, and the soil water content was relatively high even at the lower end of the soil column; this distribution of soil water contents was similar to that of the column containing the layer with a nanocarbon content of 0.1%. With the increases in the nanocarbon content and in the thickness of the soil-nanocarbon mixture layer, the soil water contents below 20 cm were considerably reduced. This was especially the case when the thickness of the soil-nanocarbon mixture was 3-5 cm.
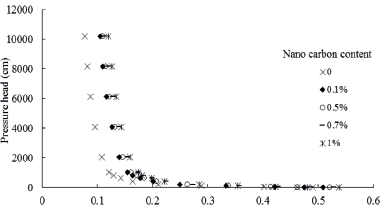
Figure 5 Soil water characteristic curves for a disturbed sandy soil with different contents of nanocarbon.
These results showed that the sandy soil with nanocarbon could hold more available water for plant growth as well as reducing runoff. A positive correlation between applied nanocarbon contents and mixture thickness was obtained. Therefore, nanocarbon has the potential to serve as a soil amendment that could increase the plant available soil water reservoir.
Effect of nano carbon contents on SWCC in the disturbed sandy soil
The SWCC represents the relationship between the matric potential and the water content or the degree of saturation. It is related to pore-size distribution, structure, and the nature and extent of the soil surfaces.
As the matric potential is less than zero, the soil energy state was better expressed by the pressure head (the negative value of the metric potential) to give a more readily interpreted illustration of the SWCC. Figure 5 presents volumetric water content-pressure head equilibrium data points. Smooth SWCCs were obtained for the five nanocarbon contents, which followed similar patterns to that of the homogenous sandy soil without nanocarbon. At the lower pressure heads (0-102 cm), since most of the drainage water was due to gravitational forces, the differences in volumetric water content changes for soil containing the various nanocarbon contents were not evident. Changes began to exhibit differences in the high-pressure head section (>102 cm) of the SWCC. The volumetric water content for all treatments presented a sudden reduction, but the ranges were different. In this study, the slope dh/dq at 102 cm pressure head was used to describe the intervals. The slopes for the five nanocarbon contents between 0% and 1% were -2.23χ10-3, -1.73χ10-3, -1.49χ10-3, -1.40x10⁻³, and -1.34χ10-3, respectively. Similarly, with increasing pressure head, reductions in volumetric water content for soils containing nanocarbon were less than those for the disturbed sandy soil alone. The phenomenon manifested itself in that the slope increased with increasing nanocarbon content and when the soil contained nanocarbon the slope became steeper. Furthermore, these data points in Figure 5 indicated that the range of pore sizes was greater for the soil samples that contained nanocarbon than for the soil without nanocarbon and increased with the nanocarbon content.
Due to its large specific surface area and ultrafine size, nanocarbon tended to increase the fine pores between soil particles by partially filling those spaces. This caused a shift in the pore-size distribution by decreasing the number of larger pores and increasing the number of smaller pores in the system. At low-pressure heads, water tended to pass through larger pores. As the pressure head increased (>100 cm), water in the macropores was emptied and only remained in the smaller pores. There were larger suctions in the finer pores. Thus, water discharge for soil with nanocarbon was less than for the homogeneous soil without nanocarbon. Consequently, nano carbon could improve soil water retention capability to some extent.
Table 4 Parameters of the soil water characteristic curve for a disturbed sandy soil with various nanocarbon contents fitted by the Brooks-Corey (BC) and van Genuchten (VG) models.
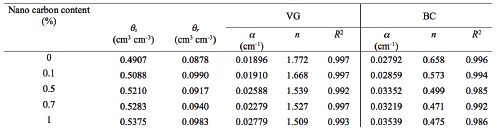
Note: R2 is the coefficient of determination for the fit of the VG or BC model to the experimental data; θs , saturated water content; θr , residual wáter content; α, empirical parameter; n, pore-size distribution parameter
The minimum data requirement for SWCC generation is at least five θ - h pairs (Nimmo and Akstin, 1988). Thus, to determine the effect of nanocarbon on the SWCC shape and related physical properties of the disturbed sandy soil, this study used the Brooks-Corey (BC) (Equation (2)) and van Genuchten model (VG) (Equation (4)) to describe the dehydration process of the SWCC occurring under centrifugation. The fitted parameters of these two models are given in Table 3. The R2 values for the VG and BC models relating the predicted values to the measured data values were above 0.99 and 0.98, respectively. This indicated that, as with the homogenous sandy soil alone, the SWCCs for the sandy soil with different nanocarbon contents could be described well by both models although the VG was slightly better fitted. From Table 4, it was clear that both θs and θr were affected in a similarly increasing manner by the increases in nanocarbon contents. Moreover, the increased available water contents due to nanocarbon in the soil could be calculated by θs-θr, which further indicated that nanocarbon could improve the water capacity.
Table 5 The relationship between nano carbon content and parameters of the Brooks-Corey (BC) and van Genuchten (VG) models.
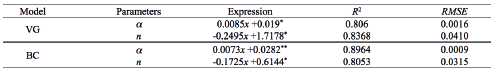
Note: * P<0.05; ** P<0.01; α, empirical parameter; n, pore-size distribution parameter
Comparing the two models, a and n in VG were about 1.5 and 3 times larger than in BC, respectively. In both the VG and BC models, the value of a increased, except for the 0.7% nanocarbon content, and n decreased with growing nanocarbon contents. The value of a expresses the inverse of the air entry value. The increasing values of a suggested that air entry values decreased and soil water capacity increased with the increases in nanocarbon content. This further confirmed that sandy soil containing nanocarbon had more available water for plant growth. The parameter n is related to pore-size distribution. The values of n decreased with increasing nanocarbon content which indicated that the fine pores increased (Table 4). Due to the special characteristics of nanocarbon (i.e., the large specific surface area and high adsorption capacity), adding nanocarbon to the soil could reduce the proportion of larger pores while increasing that of the small pores. Consequently, the saturated water volumetric content increased with the increases in nanocarbon content. Also, it was clear that the parameters of the two models were linearly related to the nanocarbon content.
Conclusions
This study investigated the effects of infiltration and the soil water holding capacity of adding nanocarbon to a sandy soil. The addition of nanocarbon to the sandy soil had a significant effect on soil water holding capacity, as well as on infiltration. Based on the analysis of SWCCs, the presence of nanocarbon enhanced water retention and increased the proportion of fine pores. Both the Brooks-Corey and van Genuchten models could well describe the SWCCs for the disturbed sandy soil with different nanocarbon contents. In general, qs, qr and a increased with increases in nanocarbon content, while n decreased. Nano carbon content was linearly related to the parameters of the VG and BC models.
Infiltration experiments investigated four different nanocarbon contents of a soil layer with five different thicknesses within a soil profile. Cumulative infiltration increased with increasing nanocarbon contents and with the thickness of the soil-nanocarbon mixture layer. This was especially evident when the nanocarbon content was higher than 0.5%, and the thickness of the mixture layer was between 3 and 5 cm. Storage of infiltrated water increased, which indicated that nanocarbon could be beneficial for plant growth and could reduce losses of water due to percolation to deep soil layers.
This study provides some basic information about the effects of nanocarbon on the water holding capacity of a sandy soil on the Loess Plateau. It suggests that nanocarbon may provide a means by which to improve the poor structure of Loess Plateau soils. However, more detailed and systematic research is required to determine optimal levels of nanocarbon and in what manner it is added to the soil, as well as the effectiveness ofnano carbon over time.

