


 Inglês (pdf)
 Artigo em XML
 Referências do artigo
 Enviar este artigo por email
 Citado por SciELO
  Citado por Google
  Similares em
SciELO
Similares em
SciELO  Similares em Google
 Permalink
Introduction
In hydrological studies, soil moisture is a critical component that controls the infiltration and runoff rates. The wetness of the soil controls the evapotranspiration rate. Although only a small percentage (~ 1%) of the total fresh water budget is contained in the soil layers of the earth surface, it acts as a key parameter in the exchange of mass and energy at the soil-atmospheric layer and also in hydrological processes. The soil surface conditions, soil moisture content, and roughness are important parameters in agriculture and vegetation growth monitoring. Technological advancements in satellite remote sensing provide various techniques for measuring the soil moisture across a wider area (Anguela 2010). Remote sensing is an advanced technology that provides accurate and repetitive spatial data; microwave remote sensing synthetic aperture radar (SAR) is particularly useful as they have a tendency to measure the soil parameters under any weather condition (Mirmazloumi 2016; Radar 2016). For bare agricultural soils, the backscattered radar signals depend strongly on the geometric characteristics (roughness) and dielectric properties (moisture content and soil composition) of the soil (Singh 2007; Tiwari 2014; Gharechelou 2015). The dynamic relationship between the radar signal and surface roughness is stronger in the L, C, and X bands. Moreover, SAR data is more sensitive to soil roughness at high incidence angles (Baghdadi 2006). Since the microwave radiation can penetrate through clouds, it aids the acquisition of images in all weather conditions, and also penetrates into the soil for at least 1-5 cm and often upto 15 cm of the root zone level of soil moisture for volumetric analysis. The large variation in the dielectric constant, which depends on the radar backscattering coefficient, has a linear relation with the soil moisture if the roughness condition is absent (Terrain 2007). Previously, many attempts have been made for the development of semi-empirical algorithms (Radar 2016; Khabazan 2013; Oh 2004; Dubois 1995). Semi-empirical models have the advantages of both empirical and theoretical models. According to the research carried out by many researchers in barely and sparsely vegetatedareas (Capodici et al., 2013), soil moisture predicted by the Dubois Model is better than the Integrated Equation Model (IEM). Till date, the Dubois Model is one of the most successful soil moisture prediction models, with some limitations because it requires quad pole data (HH, HV, VH, and VV). In this study, the RISAT CRS image (spatial resolution of 36 m) acquired at HH & HV polarization have been used for the retrieval of soil moisture in and around the Theni district of southern Tamil Nadu. RISAT-1 measures the volumetric soil moisture content in all weather conditions. The Soil Moisture content was derived using Modified Dubois Model for RISAT-1 data. Thus, the overall aim of the study explains the RISAT SAR retrieval of soil moisture both spatially and temporally to improve our understanding of the hydrological behavior of soil.
Materials and Methods
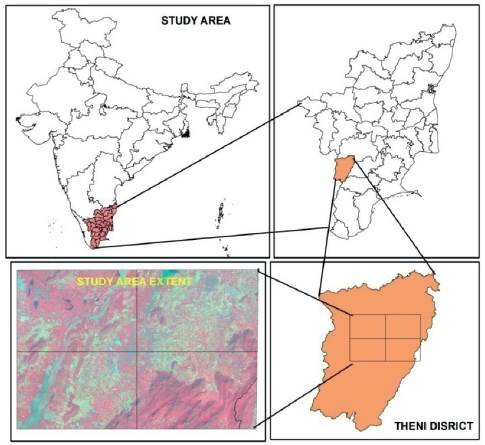
A. Study Area
The study area (Theni district of Tamil Nadu) is geographically located from latitudes 9°39'N to 10°30'N and from longitudes 77°00'E to 78°30'E. It is a part of the Western Ghats, mostly consisting of hilly area with intermittent plains. In Theni, agriculture is the primary occupation and 67% of the population lives in rural areas. The part of Theni district that has been taken into consideration for this study lies within 10°1'38.22"N and 77°20'18.70"E 9°49'37.12"N and 77°38'43.79"E (Fig.1) Parts of villages, namely, Andipatti, Virapandi, Odapatti, and Chinamanur lie within the geographical extension being studied. It is a semi-arid region with an annual maximum temperature of 38.5°C and minimum temperature of 26.3°C. The average normal rainfall is about 829.8 mm (Tamil Nadu Agriculture University). The soil, however, is sandy and clayey according to IS 2720: Part 4 (1985). The district falls within the southwest monsoon region, accounting for 21% of the total annual rainfall; northeast monsoon accounts for 46%, winter 6%, and summer 27% of the total annual rainfall. The district depends on the northeast monsoon rains, which are brought by the troughs of low pressure established in the southern part of the Bay of Bengal between October and December. The maximum amount of water is supplied by Periyar River.
B. SAR data
RISAT-1 is India's first microwave remote sensing satellite carrying a SAR payload operating in the C-band (5.35 GHz). RISAT-1 was successfully launched by PSLV-C19 on April 26, 2012. It started imaging on May 1, 2012. In RISAT-1, quad pole data is available only for High-Resolution SPOT Light (HRS) and Fine-Resolution StripMap (FRS). However, HRS and FRS imaging modes have very small swaths, 10 m and 25 m, respectively, which cover a very small area. The C-band frequency of operation and RISAT-1 SAR capability of imaging in HH, VV, HV, VH, and circular polarization has ensured its wide applicability. In this study, RISAT -1 datasets were acquired with HH, HV polarization in a CRS mode with a standard Geo-referenced product. The product was purchased from NRSC Data Centre. The project system used for this image is WGS_1984_UTM_Zone_43N and Datum: WGS_84. The acquisition data of pass was obtained on March 1st, 2016, with an incidence angle of 27.394. Majority of the area covers terrain and agricultural lands. Data analysis and processing were carried out using ENVI 4.8 software. Land use/cover classes have been prepared by digitizing the image with Resourcesat 2 LISS IV satellite sensor with a resolution of 5.8 m to identify the different Land Use and Land Cover classes for field sample collections.
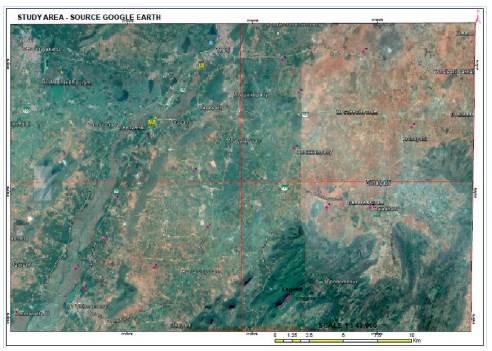
C. Field Measurements
A field visit was carried out for this study from March 1 to 4, 2016. A total of 15 field sites were selected for sampling using Land Use and Land Cover classes (Fig.2). Soil samples were collected at 0-15 cm depths using the core cutter sampling method as per civil engineering standards (IS 2720 Part 29, 1975). The ground control points (GCP) for each of the 15 locations were collected using Handheld GPS. During the time of field data collection, the humidity of that area was very low. No rainfall was recorded in Theni district from March 1 to 5, 2016.
D. Surface Roughness Derivation
The surface roughness model helps to describe the surface height variations with respect to the ground surface level. Surface roughness and soil moisture are two important factors that affect SAR backscattering from a bare agricultural field (Dobson 1981; Ulaby 1979; CASB 2000). In order to quantatively compare the profiles and measure the spatial characteristics the spatial wave number (k) and spatial scale (2π) is used for estimating the surface roughness from soil moisture data using backscatter SAR (Evans 1992; Wang 2011; Fresnel 2005). The radar return pulse at different times shows that the effect of surface roughness is considerable enough to study the soil moisture retrieval (Baghdadi 2002; Terrain 2007). Thus, surface roughness is one of the most crucial and sensitive parameters in the analysis of hydrological parameters (Y. Oh 2002). Meanwhile, the measurement of surface roughness was carried out in all 15 sampling locations using transect-hull method. The roughness profiles taken across the direction of tillage and opposite to the look direction of the satellite pass for each sample training site. The statistical approach of measuring the surface roughness is derived by using the root mean square height (r.m.s -vertical variations).
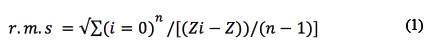
Where, - Estimated pixel; - Total Pixels; - Number of counts
E. Soil Moisture Measurement & Descriptions
Gravimetric soil moisture (mg) value was obtained from laboratory analysis using civil engineering standards (IS 2720 Part 2, 1973), which was converted to volumetric soil moisture (Mv) by multiplying the dry density( ).
).

Soil is an important factor for vegetation and agriculture as well as for drought assessment. Soil texture has been grouped into five types on the basis of analysis of collected samples from 15 sampling sites. The most abundant type of soil texture is sandy clay (69%) and clay (31%) as per IS 1498-1970.
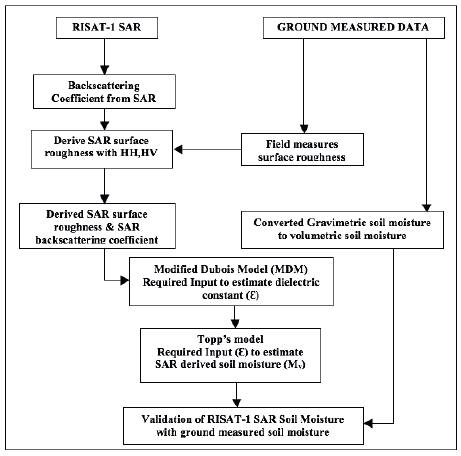
F. Modified Dubois Model
The Dubois model (1995) is a semi-empirical model, which is studied for soil moisture estimation in Indian context (Srinivasa Rao 2013). The model was used to extract the dielectric constant from the backscattering coefficient of RISAT SAR data. The parameters such as incidence angle, wavelength and frequency of SAR data, and field surface roughness is used. The model consists of two equations (HH, HV) having independent parameter as surface roughness (say root mean square height). The model was applied for HH polarization to derive dielectric constant (8)
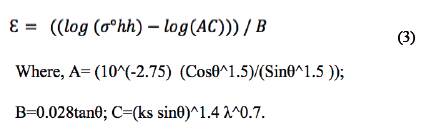
F. Conversion of Dielectric constant to SAR Soil Moisture
The dielectric constant was derived using Eq. (3). Soil moisture can be derived from the dielectric constant using Topp's model (Khedikar 2014). This model has been effective for soil moisture estimation for a very prolonged period (Oh 1992; Song 2009). This model does not require any prior knowledge about the soil texture, but needs the dielectric constant. The relative soil moisture (θv) related with the dielectric constant (ε) is shown in the following equation (4).
The methods are clearly shown in (Fig.3).
Results and Discussion
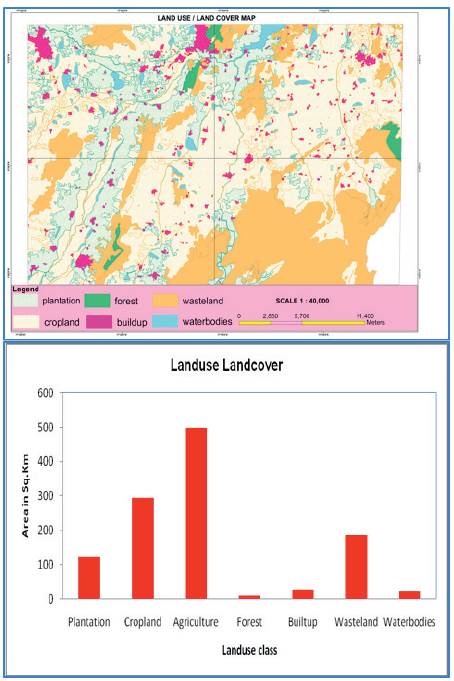
A. Landuse/Landcover Map
Land Use and Land Cover maps were prepared by digitizing the object using Resourcesat 2 LISS IV. Simple first level of classification was used for the land use and cover maps. The classification is based on the NRSC LULC level 1 classification system. The classification results show plantation (10.40%), cropland (25.47%), agricultural land (43.23%), forest (0.75%), built-up area (2.20%), water bodies (1.94%), and wasteland (15.98%). The agricultural land with respect to the total geographical area is about 28%. Figure 4 shows the land use/cover classification.
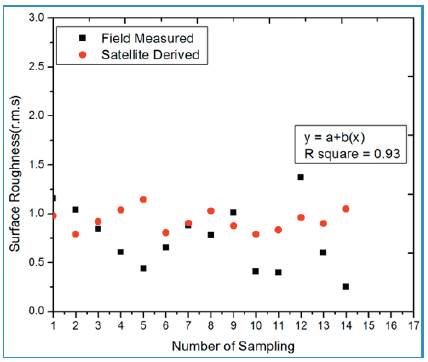
B. Surface Roughness Derivations
A Linear regression is performed by comparing the field measured roughness of 15 samples having roughness for smooth to very roughness (Shaohua Zhao, 2016). The ratio HV/HH derived polarization showing the trend analysis with positive effect in the study site. The results thus obtained are well correlated and the coefficient of determination (r2) = 0.93 is shown in (Fig. 4 & 5). The roughness measurement is relatively depending upon wavelength k = 2π/λ and frequency. In real field the propagation of the electromagnetic wave, the surface appears rougher than in the far field, which can be compared with reflection of the sunset (Reflectivity 2005) of was done for the last image as it was assumed that there was no variation in the roughness.
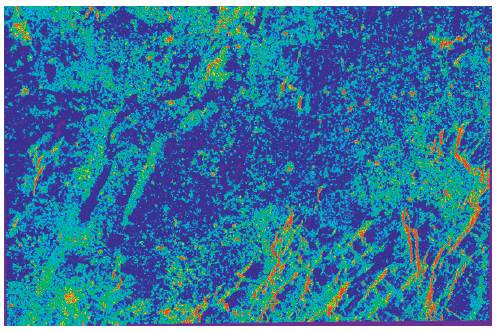
C. Retrieval of Soil Moisture
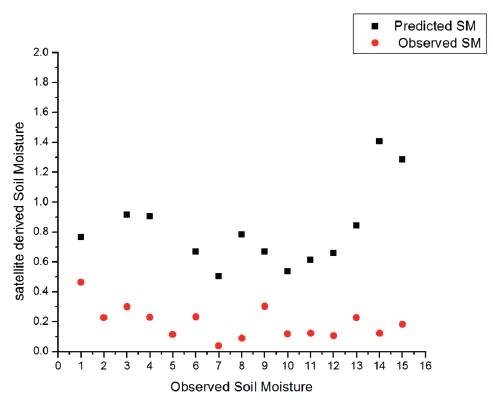
The soil moisture was derived from MDM in combination with Topp's model. The study site comprises Land Use and Land Cover Classifications such as (cropland, plantation, wasteland, forest and buildup). The derived soil moisture extracted from RISAT-1 SAR shows the cropland ranges from (0.4 to 0.67), plantation ranges from (0.69 to 1.87), wasteland ranges from (0.45 to 0.59). The cropland and wasteland shows similar range of dB values extracted from RISAT-1 SAR data. The date of pass is acquired on 1* March 2016. This is post-harvested period, therefore some field would have been harvested. This is mixing up with open lands. So, the Agricultural area is masked to identify the changes in landuse classes. Other than the ancillary parameters such as seasonal rainfall helps to understand the water availability during the crop sown period. However, this also can be taken as indicator pertaining to dryness of the agricultural area, measuring the indicator of the soil moisture condition within the Agricultural area. When superimposed with the land use map having Agri/open land, decision regarding Agricultural Management may be derived. This can be achieved by varying with HH, HV cross polarization combination, that can be an indirect method for irrigation management practice ii) crop condition assessment iii) also a direct indicator of drought. The incorrect estimation of backscattering amount and distribution will affect the retrieval of soil moisture. This effect is more severe in the cropland, as the date of pass comprises during rabizaid seasons. According to the Indian cropping season are classified into two main seasons i) Kharif for pre-monsoon period (June - September) and ii) Rabi for post-monsoon period (October - February), when Rabi sowing area is also over some of the irrigation practice follows during (March - June) are called as Zaid seasons. The plantation is the annual crops, which is having very good soil moisture profile. The observed soil moisture derived from RISAT-1 SAR is found to be well correlated with ground measured soil moisture are described in (Fig: 6 & 7). This validation is mainly to compare the soil moisture derived from RISAT-1 SAR data. The performance of the algorithms were evaluated on the basis of a standard evaluation criterion suggested mainly for RMSE calculation (Nagamani 2008; Sikdar 2004) which states that coefficient of determination r2 = 0.63 was obtained from the MDM - Topp's model. The overestimation of predicted soil moisture values is due to the mixed landuse classes particularly the settlement/built-up area gives high back scattering values, which is reflect in comparison with barren field. Otherwise the retrieval of soil moisture over agricultural field is highly correlated with other field measured values which can be clearly seen in (Fig 7) The previous research finding explains that the dielectric constant of the soil-water ratio is related to the microwave brightness, temperature, and emissivity or reflectivity of the soil (Jackson 1981; Mekonnen 2009; Su 2015). The horizontal (HH) and vertical (HV) distributions of soil moisture control the partitioning of the incident radiant energy into latent and sensible heat fluxes via evapotranspiration. The near-surface soil moisture distribution helps to determine the status and trend in agricultural drought monitoring. Moreover, it helps to understand the behavior of the top 5 cm of soil characterized by near-surface level soil moisture (Engman 2000). The classification accuracy was better identified in the C band dual polarization and incidence angles (Ponnurangam 2011). Hence RISAT-1 SAR data gives better results on soil moisture studies in the study site. The comparison and validation of soil moisture with ground measured data is clearly positive.
The Irrespective of the field measurements, a number of inversion models have been developed to retrieve the soil moisture data using active and passive microwave remote sensing. SAR has proved its high accuracy in soil moisture estimation at a regional scale. Even though the backscattering coefficient was determined with respect to the surface features, the semi-empirical model, i.e., MDM and Topp's model were subsequently approached for more simple and realistic efforts to estimate the soil moisture. Similarly, the spectral reflectance of different land use and cover types are classified to derive the optical remote sensing parameters, such as land surface temperature (LST) and normalized difference vegetation index (NDVI). The result shows changes in the vegetative biomass at a spatial and temporal scale. The study found that the cross polarization (HV/HH) is sensitive to the surface roughness. Thus, the roughness influence can be removed inform the soil moisture estimation (2133(4). The complex permissivity of wet soil and dry soil ratio with different soil textures depends on the variations in dielectric constant and dielectric loss of various types of soil in effective measurements of sensitive hydrological parameters. The derived model (MDM and Topp's model) is efficient in soil moisture estimation with the present availability of RISAT data in HH, HV with Medium-Resolution ScanSAR (MRS) and Coarse-Resolution ScanSAR (CRS). Hence, the synergistic approach of using both optical and microwave remote sensing helps to strengthen and to assess the validation of the sigma naught (σ°) against the vegetative biomass with low and high incidence angles. The surface roughness and thermal variations are normalized for agricultural drought assessment. Furthermore, to assess the spatial and temporal patterns of soil moisture, its physical and hydrological properties need to be studied using suitable techniques of very high-resolution microwave remote sensing.

