


 English (pdf)
 Article in xml format
 Article references
 Send this article by e-mail
 Cited by SciELO
  Cited by Google
  Similars in
SciELO
Similars in
SciELO  Similars in Google
 Permalink
INTRODUCTION
A satellite navigation or SAT NAV system is a system of satellites that provide autonomous geo-spatial positioning with global coverage. It allows small electronic receivers to determine their location (longitude, latitude, and altitude) to within a few meters using time signals transmitted along a line-of-sight by radio from satellites. Receivers calculate the precise time as well as position, which can be used as a reference for scientific experiments. A satellite navigation system with global coverage may be termed a Global Navigation Satellite System (GNSS) (http://en.wikipedia.org/wiki/Satellite_navigation, 2016).
The original motivation for satellite navigation was for soldiers and military vehicles, planes, and ships in accurately determining their locations worldwide. Today, the uses of GNSS have extended to include both the commercial and scientific worlds. Commercially, GNSS is used as a navigation and positioning tool in airplanes, boats, cars, and for almost all outdoor recreational activities such as hiking, fishing, and kayaking. In the scientific community, GNSS plays an important role in the earth sciences. Meteorologists use it for weather forecasting and global climate studies (Ahmet, 2010), and geologists can use it as a highly accurate method of surveying and in earthquake studies to measure tectonic motions during and in between earthquakes. Also, GNSS is used in determination of geodetic datum (geoid determination), creating a reference system, geophysical-geodynamic studies, sea-level determination, engineering, cadastral and mining surveying, precision agriculture studies and machine control systems.
Such practices caused national cartography institutions in countries, local institutions and the private sector to set up GNSS networks created by stable GNSS stations which provide continuous and real-time observations. Particularly, for tectonic studies, GNSS based geodynamic projects were developed at a regional level. We can refer the works from (Larsen and Reilinger, 1992) in the California region, (Straub and Kahle, 1995; Reilinger et al., 1997) in the Mediterranean area, (Miyazaki et al., 1996) in Japan and (Erdogan et al., 2009; Eren et al., 2009; Gülal et al., 2013) in Turkey. In parallel, projects with a broader geographical (intercontinental) scope also started to be developed. Examples are the CASA UNO (Kellogg and Dixon, 1990) in Central and South America and the TANGO (Bastos et al., 1991 in the Azores-Gibraltar region, which were among the first GPS networks established to support geodynamic studies.
A nationwide GNSS infrastructure network known as CORS-TR was established in Turkey by Istanbul Kültür University (IKU), General Command of Mapping and General Directorate of Land Registry and Cadastre during 2006-2009. As is known, CORS stations are continuous signal receiving points. After obtaining a time series of mean daily positions derived from CORS stations observations, one can estimate the station movements as periodical movements from these data. Mostly a linear movement is thus assumed to be equal to the plate movement, also called a linear trend, on which the station is located. Furthermore, it has been observed that most GNSS position time series exhibit annual, semi-annual, seasonal and daily periodical movements with amplitude of a few millimeters (Bos et al., 2010; Scherneck et al., 2002). Blewitt and Lavallée (2002) demonstrated that an annual movement within the data deteriorates the accuracy of the estimated linear trend in time series with an observation time span of a few years, even when this annual movement is taken into account during the estimation process. Although the causes of periodical movement are not yet completely understood, the most likely explanations are a combination of atmospheric loading (Van Dam et al., 1997), hydrological loading (Van Dam et al., 2001), and thermal expansion of the GPS stations (Romagnoli et al., 2003).
In this study, 788 days of GNSS observations using 7 CORS-TR stations (1.10.2008-26.11.2010) located in the Central Anatolia Region of Turkey were processed with GAMIT/GLOBK program package. Then, trend analysis, continuous wavelet transform (CWT) and discrete wavelet transform (DWT) are applied to coordinate time series and correlations between the original time series and details obtained with DWT are investigated.
METHOD
Fast Fourier Transform (FFT) is widely used and well known method for time series analyzers. It is a mathematical technique that transform signal from time to frequency. FFT of Signal is defined with
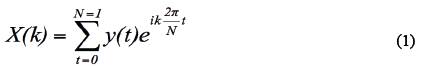
where Ν is the number of the signal y(t), t is time and / is complex unit. For 0≤k≤N-1, the calculation of X(k) in Eq. (1) requires N complex multiplications and N-1 complex sums. Computing all N of the X(k) values demands N
2
complex multiplications and N
2
-N complex additions. The FFT coefficients X(k) are in the complex plane but this representation does not aid interpretation. Therefore, the power of the FFT coefficient is calculated by power spectrum  and existing frequencies in the series are obtained by determining the density frequencies of the signal (Allen and Mills, 2004).
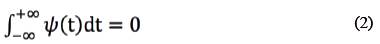
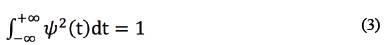
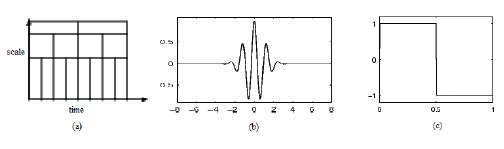
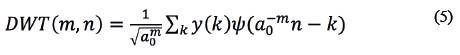
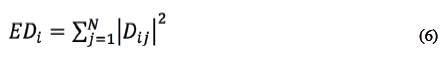
While transforming time information of the signal is lost. In addition, FFT supposes signals to be stationary. However, noisy GNSS signals are non-stationary. Thus, FFT can't detect specific event in time series. For the reasons stated above, Wavelet Transform (WT) was developed about three decades ago. WT was first applied to analyze seismic waves in geophysics studies (Morlet et al., 1982). Then, wavelet analysis has gained huge popularity among scientists and engineers who are interested in analyzing the time-frequency characteristics of signals. Dividing the signal into different frequencies and researching each component in terms of scale is the main idea of WT. The WT breaks up the signal into its "wavelets", which are scaled and shifted versions of the "mother wavelet". The two basic criteria for a function (t) to be considered a wavelet function are (2) that the average value of the wavelet must be zero and (3) that it must have unit energy. The criteria can also is written mathematically as follows:
A number of wavelet functions, which have different features, have been identified such as Haar, Daubechies, Symlets, Morlet, and Mexican Hat etc. Different wavelets may be used depending on the application. A couple of mother wavelet as shown in Fig. 1 also they were used in this study. WT use a time-scale region as shown in Fig. 1, so we can detect when specific events occur.
WT can be classified in two types: The Continuous Wavelet Transform (CWT) and The Discrete Wavelet Transform (DWT). CWT is a result of multiplication between analyzed time series and scaled and shifted versions of wavelet function at all time (Misiti et al., 2002). For the original signals y(t) and wavelet function ψ(t) CWT is defined as (Misiti et al., 2002):
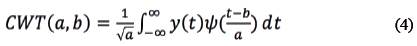
CWT (a,b) is the coefficients as a result of transition, a is the scale (dilation) parameter of the wavelet, b is the translation parameter of the wavelet, and t is time.
Scalogram is a method of using wavelet analysis to obtain spectral information. Wavelet function has an importance of detecting frequency location. It can be detect that which frequency components is in the time series and when they join the time series with scalogram.
CWT requires lots of time and memory because of calculating wavelet coefficients at every possible scale. Therefore, discrete values, which are depended on powers of two, of scale and positions are chosen in the DWT. Qiao (2005) developed an effective method, which utilizes filters, to apply this template. For the discrete signal y(k) and the wavelet function ψ(η), the DWT is defined as:
The DWT filtering process effectively separates the low and high frequency components. From the point of resolution, the low frequency components will have a large scale and the high frequency components will have smaller scale. The low frequency components called as Approximations (A) and the high frequency components called as Details (D). Approximations contain main features of the original signal. Noise is generally in detail components.
Energy of the A and D are able to be calculated with Parseval's Theorem. Through this, it is possible to compare components each other to detect which D component has a high correlation with original signal. Energy of the D components is defined as:
Energy of A components is defined as:
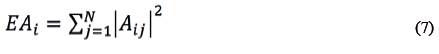
Where ED i and EA i represent energy of the i decomposition level. D ij and A ij ., are discrete wavelet transform coefficient of component at i th decomposition level and j time step. N represents the number of the coefficients (Qiao, 2005).
STUDY AREA AND DATA
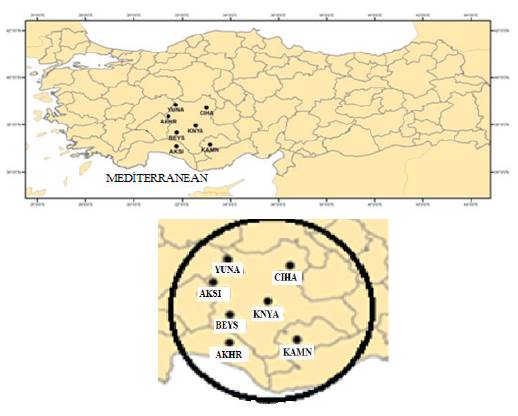
The time series analysis was carried out using the CORS positions from 7 GNSS stations including AKHR, BEYS, CIHA, KAMN, YUNA, AKSI, and KNYA of the CORS-TR network (national GNSS network), located in the Central Anatolia Region of Turkey (Fig. 2).
For the time series analysis, 788 days (1.10.2008-26.11.2010) of GNSS observations of the CORS-TR stations were first processed with GAMIT software and produced daily time series of CORS-TR stations. GAMIT is a comprehensive suite of programs for analyzing GNSS observations and developed by MIT, the Scripps Institution of Oceanography, and Harvard University with support from the National Science Foundation. The initial step in the processing of GNSS observations is the determination of the exact absolute position of the receiver. Exact positioning can be done by two methods, single point positioning and precise positioning (Pany, 2007). These two methods are pre-assessments to determine the station coordinates and clock errors. Mathematical models of GNSS pseudo range code signals for single point positioning system is given in Eq.(8).

Here, C code is the value, c is the speed of light, k index is the satellite and . index is the receiver while δtk is the clock error of the satellite at the times tr and te , δion, δtrop ,δtide, and δrel denote the ionospheric, tropospheric, tidal and relativistic effects respectively. The remaining error is denote as εc. In Eq. (8), satellite clock errors are corrected by using atomic clocks according to IGS precise orbit information and broadcast ephemeris information. After the errors are corrected, there are only four unknowns left in Eq. (8), receiver clock errors and receiver coordinates. For an acceptable solution, initial value for receiver clock error is considered as null and the Eq. (8) is made linear. This linear equation is given below.
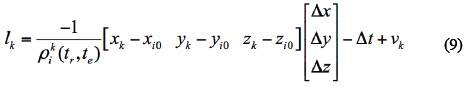
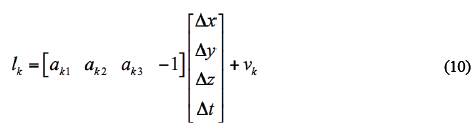
Equation (9) can be written in a more general form as below. In the above equation,  describes the coefficients in Eq.(9), [Δχ Ay Δz]T describes the differences between the coordinates, VK, the residual errors and Δt receiver clock errors. If we apply the observations made for all satellites to Eq. (10), Eq. (10) becomes a general equation and single point positioning equation system with P being the weight matrix is as follows
Here, L is the observation vector, X is unknowns vector and A is coefficient matrix. In equation (11), unknowns vector X is calculated according to least squares method (LSM) with Eq. (12).
Here, coefficient matrix is created by using initial coordinate values. However, most of the time, the initial coordinates are not exactly known. Therefore, for single point positioning problems, iterative solutions are mostly used. This means, final coordinates calculated from initially used station coordinates are again processed as initial coordinates. This process is continued until the difference between initial and final coordinates are reduced to minimum. As mentioned above, there are four unknowns in single point positioning equation. Therefore, the solution of the problem requires at least four equations. For the formulation and solution of these equations, observation values from at least four satellites are obtained for single point positioning. When receiver station coordinates are calculated, (Δχ Ay Az) T in Eq. (10) becomes null and Eq. (10) is written as Eq. (13),
and receiver clock error is calculated with Eq. (14).
Here, K indicates the total number of satellites observed in one epoch. Receiver clock errors can similarly be calculated by phase measurements (Pany,2007).
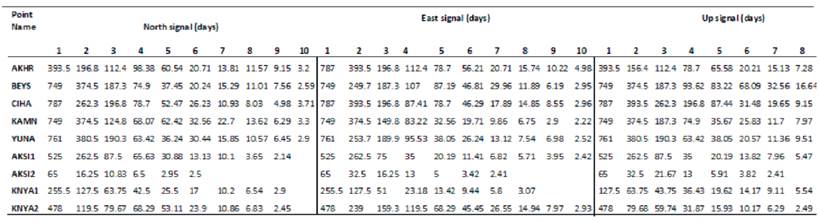
After the observations (coordinates or signals) processing, 27 time series were obtained from 7 stations. Because of data loss in AKSI and KNYA time series, they were divided into two separate time series including AKSI1, AKSI2, KNYA1, and KNYA2. Thus, 27 time series for 7 stations were obtained. These time series show the changes in the signals in the north, east, and up directions of stations according to coordinate system of the GNSS. The time series of the CIHA, AKSI1 and KNYA1 stations are shown in Fig. 3. In Fig. 3, the signal change S(t 1 ) of the time series was acquired assuming that S(t 1 ) =0 for the time initiation of t. (i. = 1). In this case, the signal change at any time point during the time series is in relation to the initiation time of the signal.
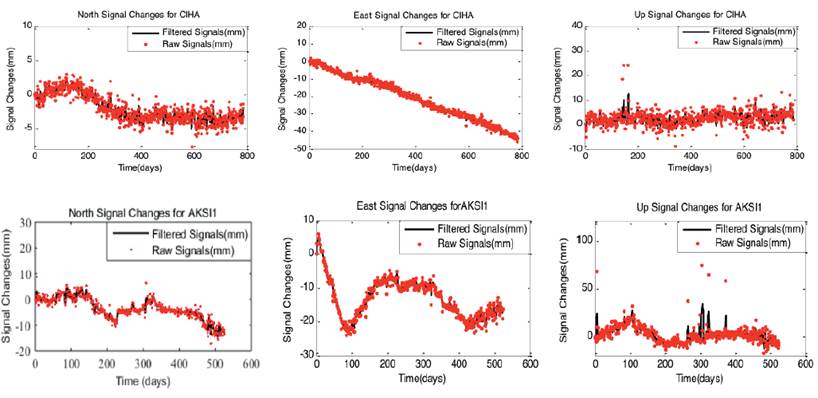
A filtering procedure, Third-order Floating Weighted Average (FWA), was applied to the series to partially eliminate the noise effect, also big outlier data in the raw time series (Gülal et al., 2013). FWA is  . This procedure also has a type of low-pass filtering. Since the number of time series is too much, just the Raw and Filtered time series of the CIHA and AKSI1 stations are shown in Fig. 3.
RESULTS AND DISCUSSION
In this study, in the time series linear changes were determined by linear functions and also periodical movements were investigated by CWT and FFT applied for Details and Approximations obtained with DWT. In addition, Approximations and Details are obtained by applying DWT to the time series and correlations between Approximations -Details and original signals were investigated.
Linear Trend Analysis
It was determined that if time series for the signal changes of GNSS stations north, east an up component contained any linear trend component by calculating a and b parameters of y=a+bt linear functions and standard deviations of these parameters by LSM. Whether the calculated parameters are significant or not is decided by t-distribution test. Test value  is calculated from parameter and standard deviation of parameter for each parameter, =parameter/standar deviation of parameter, and this value is compared with pre-determined 1-α confidence level and
  confidence limit of t-distribution dependent on the /degree of freedom. If,
  parameters are insignificant and if
  parameters are significantly different from zero at a 1-α confidence level. For this study, t-distribution table values according to the degree of freedom f at 95% confidence level; f>500,t5001-005/2=1.96) 1.96 for AKHR, BEYS, CIHA, KAMN, YUNA, and AKSI1, f>200,t2001-005/2=1.97) 1.97 for KNYA1 and KNYA2, and (f>60,t60,1-0.05/2
=2) 2 for AKSI2. For all stations, these values from the t-distribution table are compared with the calculated test values and the results showed that test values are greater than table values at 95% confidence level.
parameters are significantly different from zero at a 1-α confidence level. For this study, t-distribution table values according to the degree of freedom f at 95% confidence level; f>500,t5001-005/2=1.96) 1.96 for AKHR, BEYS, CIHA, KAMN, YUNA, and AKSI1, f>200,t2001-005/2=1.97) 1.97 for KNYA1 and KNYA2, and (f>60,t60,1-0.05/2
=2) 2 for AKSI2. For all stations, these values from the t-distribution table are compared with the calculated test values and the results showed that test values are greater than table values at 95% confidence level.
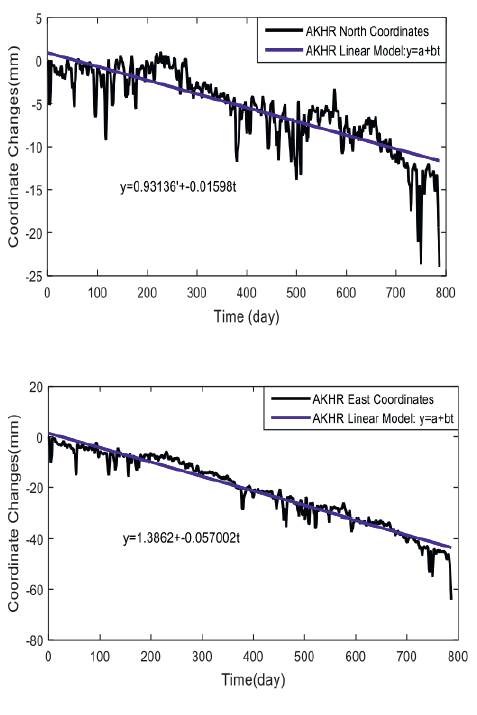
Thus, it is concluded that the time series of north, east and up coordinates of all stations have a linear trend component (there is a linear movement in the stations) and the results are given in Table 1. In addition, the north and east coordinates time series and linear trend models of the AKHR station are given in Fig.4 respectively. Statistically significant linear trend component functions (linear model) of the stations and annual linear changes calculated from this model in other words linear movements of stations are shown in Table 1. The b parameter of the trend function in Table 1 shows the linear variation of the time series of stations and "t" parameters is day. A change in (+) direction indicates increase of movement, a change in (-) direction indicates decrease of movement. Using these parameters it is possible to determine the linear changes or movements in stations together with the direction of movement. On the other hand, the change in the (+) direction shows the movements of the stations in the north and east directions, and the change in the (-) direction shows the movements in the south and west directions horizontally. Vertically, (+) change indicates that the height is higher, and (-) change indicates that the height is lower. As shown in Table 1, while the CORS-TR stations have linear movements in west and south directions, KAMN have linear movement in west and north directions (+3.65 mm / year). Linear movements of stations in horizontal position: the highest linear movement in the south direction is at the AKHR station with 5.84 mm/ year, the lowest linear movement in the south direction was observed at KNYA1 station with 0.66 mm/year.
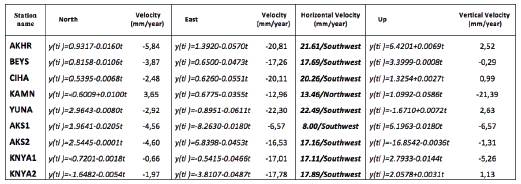
The highest linear movement in the west direction was detected at the AKHR station with 20.81 mm/year, and the lowest linear movement was detected at AKSI1 station with 6.57 mm/year. Except for KAMN station, the average resultant movement obtained from the linear movements in the west and south direction of the stations is 17.78 mm/year and the direction is southwest. Yet, the linear movement of the KAMN station is 13.46 mm/year and the direction is northwest. The results of the linear movements in the Up coordinates of the stations show that at AKHR, CIHA, YUNA and KNYA2 stations have linear movements in (+) direction, that is, vertical values increased. The highest linear movement was calculated at YUNA station with 2.63 mm/year value and the lowest linear movement was calculated at CIHA station 0.99 mm/year value. Linear movements in Up coordinates of BEYS, KAMN, AKSI1, AKSI2 and KNYA1 stations are in (-) direction. The highest linear movement was detected at KAMN station with -21.39 mm/year value and the lowest linear movement at BEYS station -0.29 mm/year.
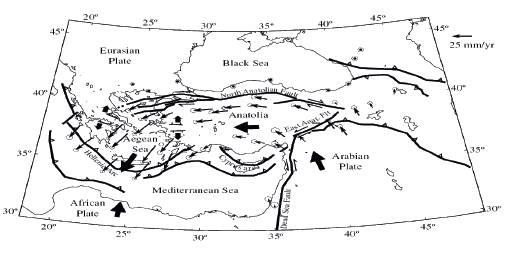
In the time series analysis of GNSS stations, linear changes or movements obtained from the trend component analysis are extremely important in terms of plate movements. The reason is that bt in the trend component is used to determine the time unit and direction dependent plate movements (or velocities). Fig. 5 shows that the majority of Turkey is located on the Anatolian plate where the Arabian, Eurasian and the African plates conjunct. The Anatolian plate is being squeezed by the movement of the Eurasian and Arabian plates. Thus, Anatolia is one of the most seismically active regions of the Mediterranean basin. Historical records of seismicity, as well as instrumental recordings of earthquakes that have occurred in the past 20 years, reveals the active tectonic features of this area. The North Anatolian, East Anatolian, Aegean (Western of Southwest Anatolia), and Burdur-Fethiye fault zones, indicate the tectonic diversity and activity of Anatolia (Gilbert et al., 1994; Kahle et al., 1996). Between 1988 and 1992, measurements were concentrated during alternate years in western and eastern Turkey, with sufficient overlap to allow the integration of the networks, but since the 1994 survey, almost all the stations were reoccupied during each survey (Reilinger 1997). In addition to these broad-scale surveys in Turkey a small and relatively dense network of stations spanning the various strands of the North Anatolian Fault in the Marmara region was observed in 1990, 1992, 1994 and 1996 (Straub et al., 1997). To aid in orbit determination and to strengthen the reference frame, (McClusky et al., 2000) analyzed data from 50 to 200 globally distributed stations from the International GPS Service (IGS) acquired between June 1992 and April 1999. Altogether, their solution included data spanning 9 years from 450 stations, included 189 in the Mediterranean region. Also, for the southern Aegean, the GPS velocity field is dominated by a southwest motion relative to Eurasia of about 30 mm/year. To better show the possible deformation in the southern Aegean (<2 mm/year), and the motion of the southern Aegean relative to the surrounding areas, they calculated an Euler vector for the Anatolia and determined the residual velocities that stations indicated increasing velocities toward the trench and counterclockwise rotation in and around the region. Also, GPS strain fields and velocity fields for the period 2003- 2006 in the southwest of Turkey were indicated by (Erdogan et al., 2009). The measurements, which were performed as periods, were evaluated using daily measures. It was found that the region is affected by a southwestern movement of 15-30 mm/year according to a Eurasia-fixed stabilization. Strain vectors show a clockwise rotation in the study area. The velocity field and strain fields are characterized by a system that indicates non- deforming and deforming regions separated by fault zones. In addition, the velocity field is in agreement with location of seismicity, earthquake focal mechanisms, and mapped fault locations. According to the GPS velocity vectors there is a shows slower movement in that south compared with the north. This movement of area is agreement with the results obtained in this study (Table 1). For the whole of Turkey, the last study was made by Eren et al., (2009) taking short term observations of the GNSS stations and the maximum estimated displacement from the 146 CORS-TR stations with respect to the Eurasian plate are 19.91 mm/year (southwest direction) and 23.16mm/year (northwest direction) at FINI and UDER stations. Also, tectonic activity inferred from velocity field of GNSS measurements for the period 2003-2010 in Southwest of Turkey were studied by Gülal et al., (2013), it was found that the Anatolian plate is moving to the southwest at a rate of 12-40 mm/yr with respect to the Eurasian reference frame. In a different study, 20 CORS-TR stations located in the southwest of Turkey for period 2008-2010 were studied by Gülal et al., (2013). The average movement of the stations with the exception of KAMN is 21.7 mm/year in southwest direction. Point velocities (vertical) of TUSAGA-Active obtained by Eren et al., (2009) support the results obtained in this study.
As reported in this paper, the results of 788 days of linear trend component analyses acquired from the GNSS stations are consistent with the results of previous short term, long term and campaign type observations based on tectonic studies on the whole of the Anatolian plate and around this region (Fig. 5 and Table 1).
Continuous Wavelet Analysis
Scalograms were obtained by applying CWT at different scales to GNSS coordinate time series of North, East, and Up coordinate components. Morlet wavelet was used to CWT. The morlet wavelet is both complex and contains more oscillations, and hence the wavelet power combines both positive and negative peaks into a single broad peak. Scalogram provides to detect periodicities in time series and this information depends on time. In scalogram, while vertical axis provides scale information, horizontal axis gives time information. Percentage of energy for wavelet coefficient increases from blue to red. Therefore, while detecting any scale, it should be maxima of energy. It cannot be explained clearly that how many times the periodicity is repeated, nevertheless we ensure the existence in this analysis. Also the number of excess periodicity should be regarded as a more important criterion than the high-energy scale.
Since we have a lot of scalograms, determined periodic movements in them are given in Table 2. The scalogram of the Up direction of station YUNA (a) and North direction of station KNYA1 (b) coordinate time series using CWT are plotted in Fig. 6.
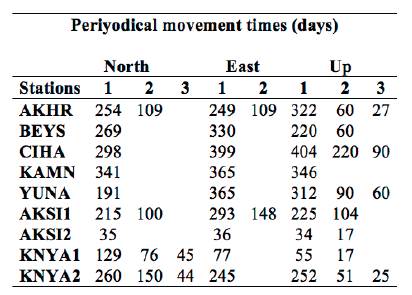
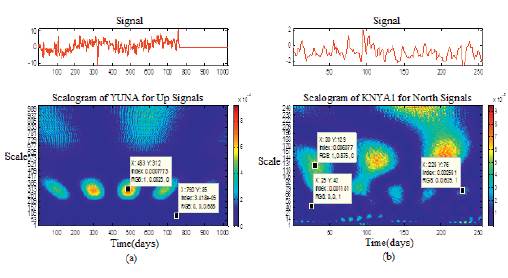
Fig. 6 shows that there are 60, 90, and 312 days of periodic movements in Up direction of station YUNA coordinate time series and 15, 42,76, and 129 days of periodic movements in North direction of station KNYA1 coordinate time series. In this way, it can be reached that when the period is active when we look at the horizontal axis of the graph. Regarding the analysis performed for all GNSS stations used in this study, Up coordinate time series have the most periodicity whereas East coordinate time series have the least periodicity.
Table 2 shows that the Up signals of the GNSS stations in the Central Anatolia Region of Turkey contain more movements in comparison with their southern and northern signals. Daily (from 2 to 28 days), monthly (28, 30, 66 days etc.), seasonal (87, 95, 112), semi-annual (150, 170, 190 days etc.), and annual (360, 380, 390 days etc.) periodic movements based on various factors related to the signals have been determined (detail information were given in section Periodical Analysis).
Discrete Wavelet Transform
When we analyze GNSS daily coordinate time series by CWT, it is not possible to examine in detail the behaviors of the GNSS stations. Therefore, studying on approximation and detail components of these series obtained from DWT make possible to get more information. Also with the help of the DWT, we are able to discuss time series in different scales separately. This process gives us positive opportunities on the analysis of nonstationary GNSS coordinate time series. For example, we are able to examine any scale-level component that we want depending on time.
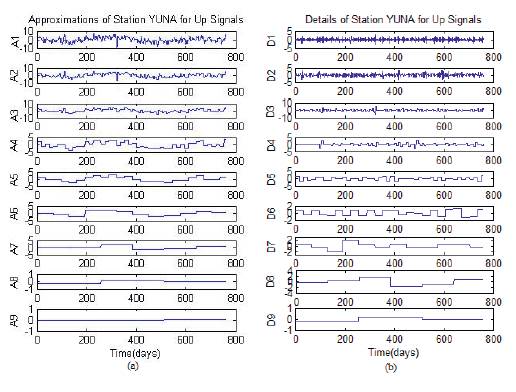
DWT was carried out to GNSS coordinate time series of North, East, and Up coordinates components of stations with multiresolutional analysis. For translation, db1 wavelet from Daubechies wavelet family was chosen because it is practicable to DWT. Considering the number of data, decomposition levels were set 9 for AKHR, BEYS, CIHA, KAMN, YUNA, and AKSI1, 6 for AKSI2, 7 for KNYA1, and 8 for KNYA2. In this way, A and D were obtained with DWT applied for all series. Approximations (a) and Details (b) of Station YUNA for Up Signals are shown in Fig. 7.
In this equation, the frequency f of signal is estimated by Eq. (1) and (2). These periodical movements were tested for statistical significance.
Fig. 7 (a) shows that A1 has a high correlation with the original signal while A9 has a low correlation. In this case correlation between the original signal and approximations is going to be weakened from A1 to A9. Besides, A8 and A9 have very low correlation with the original signals. Fig. 7 (b) shows that D1 and D2 (especially D1) have vibrations caused from noise at 0. Also, these components have the highest frequency changes of the original signal. D1 has the highest frequencies and it decreases from D1 to D9. Furthermore, it is clearly seen that D9 has low correlation with the original signal.
Periodical Analysis
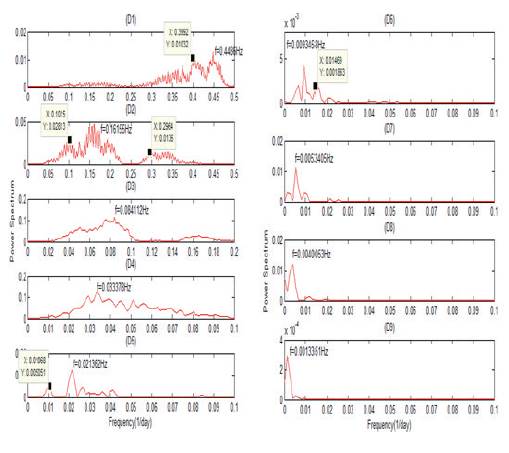
After the elimination of the linear trend component in the time series for the movements of the CORS-TR in the north, east and up directions, the periodical components in the approximation and detail series, which are obtained with DWT, were determined. The periodical components are the long-term periodical changes (low frequencies) which occur in the CORS-TR as a result of climatic events, atmospheric and hydrological loading, satellite and reference system errors effecting the stations over a period of time (hours, half a day, semi-annual and annual etc.). In order to obtain the frequencies in the signals of the stations, the series was transformed to frequency domain by FFT (Eq. 1) and the power spectrums Pxx(k) were calculated. The frequencies of the periodical movements were calculated for A and D of the north, east and up signals of stations from the power spectrum figures (peak-peaking method). For example, the power spectrum figures of D1-D9 of stations BEYS are given for the north signals in Fig. 8. The calculated frequencies of stations in the north, east and up directions indicated which CORS-TR station had many periodical changes or movements. It must be defined that whether a large number of periodic movements, which are shown in Fig. 8, is statistically significant. For this purpose, periodical component analysis can be made by modeling the SP(t) signals with the use of the trigonometric function defined as (Erdogan and Gülal, 2009).

In this equation, the frequency fs of signal is estimated by Eq. (1) and (2). These periodical movements were tested for statistical significance.
During the calculations, the frequencies were used in Eq. (15), the as and bs parameters of the periodical changes and covariance matrices of these parameters were estimated by LSM. Whether the calculated values are significant is decided by t-distribution/t-test. According to "0" expected value and degrees of freedom f at %95 confidence level, t-distribution values are; 1.96 f>500,t5001-005/2=1.96) for AKHR, BEYS, CIHA, KAMN, YUNA ve AKSI1, 1.97 (f>200,t2001-005/2=1.97) for KNYA1 and KNYA2, and 2 f>60,t601-005/2=2) for AKSI2. The parameters with larger test values than the confidence limit were considered as significant. The insignificant frequencies were excluded from Eq. (15) and this procedure was repeated until the significant frequencies were determined. The time of the periodical movements was calculated from significant frequencies and time of significant periodical movements as given in Table 3. Daily (from 2 to 28 days), monthly (28, 30, 66 days etc.), seasonal (87, 95, 112 days etc.), semiannual (150, 170, 190 days etc.), annual (360, 380, 390 days etc.) and even biennial termed periodic movements based on various factors related to the signals have been determined. It is stated that the GPS coordinate time series includes periodic changes (signals) ranging from half-day to years, due to various factors (Blewitt et al., 2002; Mao et al., 1999; Poutanen et al., 2001).
Seasonal movements are generally related to gravitational excitation, of a thermal origin coupled with hydrodynamics, sources that are indirectly due to geophysical processes or resulting from instrument, or modeling deficiency (Dong et al., 2002). Gravitational excitation consists of rotational displacements due to seasonal polar motion (UT1), and loading induced displacement caused by solid Earth, ocean and atmospheric tides, which are modeled in the raw data processing step. However, the residual ocean tide effects which are still present, and are mainly due to the use of global ocean tide models instead of higher quality local tidal models. The pole tide loading also belongs to gravitational excitation, with the spectrum of mostly annual and Chandler wobble periods (409 and 512 days or possibly ~682 days). This long time signal with a large amplitude and nearly 450 days period is described in Calais (1999). Due to this signal not being seasonal and being larger in east and west components, it is concluded that this is probably caused by errors in the reference systems or satellite orbit or ground guidance parameters according to Calais (1999). The deformation caused by pressure field variation, non-tidal sea surface fluctuation, ground water changes in both liquid and solid form, bedrock expansion beneath the GPS benchmark, and wind shear are all in the category of being of thermal origin coupled with hydrodynamics. Also, other error sources, which generate apparent seasonal variations, such as orbit modeling errors caused by an imperfect reference frame, which is defined through a set of stations that are subject to seasonal variations. There are other important phenomena that can affect the position time series through seasonal signals; these involve tectonic-induced deformation, due to possible seasonal movements in the regional fault slip or regional stress, e.g., slow earthquakes; (Miller et al., (2002).
The acquired periodical movements and their impact on GNSS stations in this region are consistent with other GNSS stations throughout the world. This indicates that the recently set up CORS-TR network for the whole country is capable of providing stable, reliable, accurate and continuous data for national and international studies that can be conducted in many fields. The results obtained in this section support periodicities acquired from scalogram in section CW Analysis.
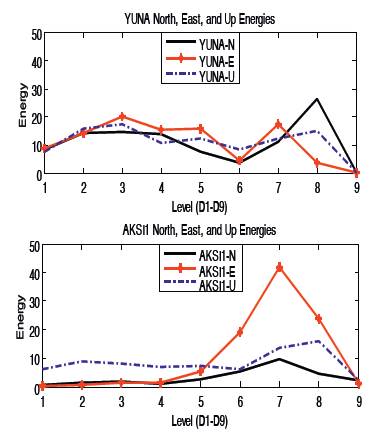
Energy Spectrums of Details and Correlations
As approximations and details obtained with DWT, there are one or several components to show the best fit to original time series. In this study, detail component, which protect the largest percentage of energy, was determined by calculating the energy spectrum. Because the latest level represents the series with the minimum coefficient, high energy at these levels was not considered. The energies of details of North, East, and Up coordinate time series of each stations are shown in the same graph. Thus, details affecting the coordinate components may be compared to each other. Because we have a lot of graphs, only results of YUNA and AKSI1 are given in Fig. 9. Fig. 9 shows that D3 has the highest energy in East and Up coordinate time series and D8 has the highest energy in North coordinate time series for YUNA stations. Considering all energy spectrum graphs, Detail component energies of North and East time series are usually similar and the highest energies are obtained in D7 and D8 components. However, the components in which the highest energy obtained have varied in Up time series. D3 has the periodicity between 8 and 16 days and D8 has the periodicity between 256 and 512 days. In this way, activities having these periods of specified components effect characteristic of North, East, and Up coordinate time series of YUNA stations. In conclusion, energies of detail components are generally similar in vertical and especially D7-D8 have the highest energy. However, the components obtained the maximum energy was varied in Up coordinate time series. D7 has the periodicity between 128 and 256 days and D8 has the periodicity between 256 and 512 days.
CONCLUSIONS
In this paper, 788 daily GNSS time series were obtained using GAMIT software to process the GNSS observations from seven stations of CORS-TR network in Turkey. Firstly, linear models of North, East and Up coordinate components of the stations are formed and the annual velocities are calculated. It was determined that the calculated linear movements were in the north-west direction (13.46 mm/year) for KAMN station and in the south-west direction (17.78 mm/year) for the other stations. Linear movements in Up coordinate time series of the stations are: in (+) direction for AKHR, CIHA, YUNA, and KNYA2 stations and in (-) direction for BEYS, KAMN, AKSI1, AKSI2, and KNYA1 stations. The linear movements obtained for these stations were found to be in agreement with the plate velocity values of the zone where these stations are located.
Then periodical movements in the time series are investigated by CWT and FFT. Although we can obtain periodic movements by both CWT and FFT, FFT provides more clear results. However, the results of both methods support each other. Furthermore, correlations between the original time series and details were investigated by using Parseval's Theorem. In DWT, different decomposition levels are applied to the time series. This provides that we can study and concentrate on which component we want. Also, in the analyses of the periodic movements, it was determined that signals of stations contained daily (from 2 days to 28 days), monthly (28, 30, 66 days etc.), seasonal (87, 95, 112 days etc.), semi-annual (150, 170, 190 days etc.), annual (~ 360 days) and even biennial termed periodic movements changing from daily to annual terms. These periodic movements acquired for the stations in this region are consistent with those found for other continuous GNSS stations in other parts of the world.
In the analyses of correlations, energies of detail components are generally similar in vertical and especially D7-D8 have the highest energy. However, the components obtained the maximum energy was varied in Up coordinate time series.
The acquired important results from CORS-TR for this region are consistent with other GNSS stations throughout the world. This indicates that the recently set up CORS-TR network for the whole country is capable of providing stable, reliable, accurate and continuous data for national and international studies that can be conducted in many fields.

