


 English (pdf)
 Article in xml format
 Article references
 Send this article by e-mail
 Cited by SciELO
  Cited by Google
  Similars in
SciELO
Similars in
SciELO  Similars in Google
 Permalink
1. Introduction
Studies on natural and medial image retrieval have achieved remarkable results. Meanwhile, there have been numerous research projects designed specifically for remote sensing image retrieval. However, both theoretical and application systems are immature and need to be further researched (Samadzadegan et al., 2012; Hejazi et al., 2017). For example, the KIM system developed by DLR explores implied semantic features of images by Bayesian networks. Nanyang Technological University conducts multi-sensor (RS)2I thoroughly research feature description and extraction, multidimensional indexing technology and system structure design (Mountrakis, 2012). The study compares existing image retrieval systems and focuses on image storage, network transmission model, feature extraction and description, segmentation algorithm, reasonable segmentation, similarity measurement and relevance feedback. The results show that studies on remote sensing image retrieval have some deficiencies, which are mainly manifested as follows: (1) Although studies on content-based image retrieval have achieved brilliant results, they are mostly focused on natural and medical images. Rarely do scholars study remote sensing images (Han, 2012; Xu, 2015; Radan et al., 2017). (2) Currently, remote sensing image retrieval systems are mainly based on texts, strip numbers, latitudes, and longitudes, rather than contents (Abdi, 2013). (3) Scholars have made great use of Bayesian networks to study semantic-based remote sensing image retrieval. Retrieval precision of existing algorithms can be further improved. (4) The retrieval precision is inversely related to time efficiency for most image retrieval algorithms. In other words, high-precision image retrieval tends to consume lots of time (Zhai, 2014; Simon et al., 2017).
This paper proposes a stepwise Bayesian network algorithm for retrieving remote sensing images, aim to address these problems; the schema combines co-occurrence region-based Bayesian network image retrieval with average high-frequency signal strength, and adopts integrated region matching for iterative retrieval, thereby efficiently improving the precision of semantic retrieval and significantly reducing the retrieval time. In the meantime, semantic-based feature vectors are introduced to enhance the precision of image retrieval.
2. Material and Methods
In content-based image retrieval, scientific and reasonable similarity measurement models are the keys to achieving the precision of the entire retrieval system (Zhong et al., 2012; Bata et al., 2017). Bayesian network image retrieval systems consist of three parts (Boser et al., 1992; Roslee et al., 2017): (1) Segment images with a simple image segmentation algorithm and extract color or texture features of each sub-image to describe image contents, which is referred to as image segmentation and feature extraction. (2) Employ unsupervised classification to classify the extracted features, generate codebooks and encode images following the codebooks, thereby producing encoded image library. (3) Obtain the final retrieval results by selecting training samples and calculating related probabilities, which is known as semantic inference. The paper proposes two concepts: code co-occurrence matrix and semantic score function to simplify the process of semantic inference.
2.1 Co-occurrence Region Based Bayesian Network Algorithms for Remote Sensing Images Retrieval
2.1.1 Features of IKONOS Images
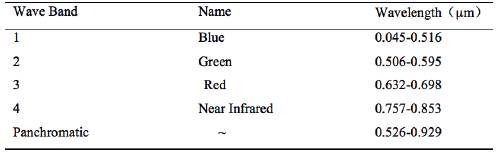
IKONOS is the world's first high-resolution commercial satellite, with an orbit altitude of 681km, a revisit period of 3 days and a nadir image swath width of 11.3km. It has one panchromatic band and four multi-spectral bands (Pedergnana, 2013; Rahman et al., 2017). Wherein, the spectral resolution of the panchromatic band and multi-spectral bands is 1m and 4m respectively. Fundamental parameters of wave bands are shown in Table 1.
Extraction
This study adopts a 256-dimensional color histogram to describe spectral features of images. In fact, Swain et al. proposed to describe color features of images with color histograms in 1991. Since color histogram, which presents the number of image pixels of each color afterimage colors is quantified, has transition invariance and strong robustness to rotation and scale changes, it is extensively used (Stumpf, 2014; Ruiz, 2014; Maleki-Ghelichi and Sharifi, 2017). Normalization processing shall be adopted, and color features shall be described by the proportion of different colors to keep the scale invariant; as shown in Formula (1).
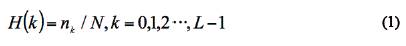
In the formula, N is the total number of image pixels; L is the dimension of the color histogram; nk is the number of image pixels in the k-th color dimension.
2.1.3 Image Segmentation
In the experiment, multi-spectral KONOS images are segmented into non-repetitive sub-images, and 256-dimensional color histograms of the sub-images are extracted and considered as their spectral features. However, the sub-images are in large quantities, and objects with similar characteristics are segmented into different sub-images, which is not conducive to image retrieval (Amiri et al., 2017). To better describe major features of images and reduce the number of feature vectors, the k-means algorithm is introduced to cluster segmented sub-images. The clustering results are deemed as the final segmentation results. Sub-image is taken as the minimum unit to judge whether image regions are spatially connected, preventing segmented regions from being spatially unconnected (Tariq et al., 2017). If not, the clustering results shall be segmented so that the images are spatially combined after segmentation.
2.2 Codebook and Image Coding
2.2.1 Codebook
Image features are accurately extracted for quantification and classified by the k-means algorithm to realize many-to-many matching between image features and semantic meanings. Assuming that all image areas in the database are expressed as  is the total number of image segmentation regions, F(D) is the region feature extraction function and F(D) represents features of all image areas in the database. F(D) is classified into L categories by the k-means algorithm, and each cluster
  is a set of features. Let C
u
be the cluster center of
is a set of features. Let C
u
be the cluster center of  , then there is a mapping relation
  . Wherein, CBi is referred to as codebook and the index number between Cu and is referred to as code. For the image It, its region code R
t
can be expressed as C
i
(R
t
). Wherein, C
i
is the code function of the region. Since codebooks generated by the k-means algorithm are all of the fixed length and appropriate codebook sizes are difficult to be identified, this paper adopts tree structured coding to solve the problem. Tree-structured codebooks are composed of different levels of
. Wherein, CBi is referred to as codebook and the index number between Cu and is referred to as code. For the image It, its region code R
t
can be expressed as C
i
(R
t
). Wherein, C
i
is the code function of the region. Since codebooks generated by the k-means algorithm are all of the fixed length and appropriate codebook sizes are difficult to be identified, this paper adopts tree structured coding to solve the problem. Tree-structured codebooks are composed of different levels of  (n represents the number of codebook levels). Figure 1 demonstrates a schematic drawing of structured tree coding.
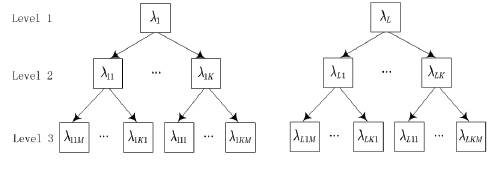
According to Figure 1, top-level codes have more regional features, which flexibly and efficiently allows users to select codebooks required at different levels of  . Based on the features of image areas, the chosen codebooks shall be used to encode images, thereby generating image library (encoded image library).
2.2.2 Image Coding
It is necessary to select proper codebooks from tree-structured codebooks to encode images. The coding function of image areas is defined as  (n represents the number of tree-structured codebook level), and the process of image coding is described as follows:
Step 1: select a m-level tree-structured codebook  for
for  in I
t
and its region features
in I
t
and its region features  , and let the optimal codebook level l be 1.
Step 2: traverse each cluster  , identify the cluster center Cu that contains clusters of regional features
  and encode the region
  as u, then,
Step 3: if  , the program stops. Otherwise, it will go to Step 2.
Step 4: encode  into a code strand (each code represents clusters of image areas at different codebook levels), encode each image area and obtain encoded images, thereby forming encoded image library.
2.3 Semantic Inference
2.3.1 Mathematical Models
 and
and  coexist in the image
  and
and  are referred to as cooccurrence regions of
  . Semantic inference is based on codes of
  and its co-occurrence regions (
 and
and  ). Spectral or texture features of the triad constituted by
  and
and  are described by corresponding code triad
  (region code). Assuming that the codebook has L codes, it may generate L
3 code combinations from the perspective of the combination. In this way, spectral or texture feature symbols of the region increased from L to L
3
, thereby improving the precision of semantic inference. When inferring semantic meanings of images, the correlation between I
t
, and
(region code). Assuming that the codebook has L codes, it may generate L
3 code combinations from the perspective of the combination. In this way, spectral or texture feature symbols of the region increased from L to L
3
, thereby improving the precision of semantic inference. When inferring semantic meanings of images, the correlation between I
t
, and  is measured by the posterior probability
  of cooccurrence region based Bayesian networks. Co-occurrence region based Bayesian networks are shown in Figure 2:
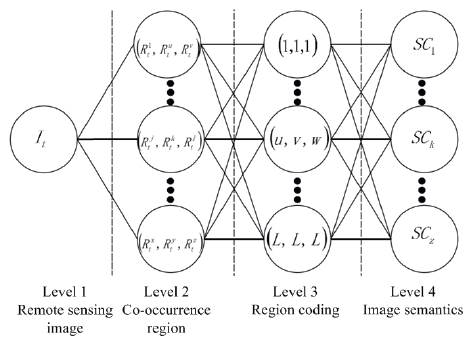
Formula (2) is the formula for calculating the posterior probability of co-occurrence region based Bayesian networks.
According to Bayesian formula,
Formula (2) can be expressed as:
Where in,  is the prior probability of
  ; the conditional probability
  reflects random links between codes and semantic concepts and can be obtained from user feedback or training samples. Assuming that the prior probability
  follows a uniform distribution, it can be ignored when calculating
  . The calculation formula is as follows:
When interpreting the image It, importance of the code triad  can be described with
  and calculated by the product of region importance function
  and co-occurrence region importance function
  . Assuming that
  and its co-occurrence regions
  are equally important to interpreting I
t
, then
are equally important to interpreting I
t
, then  . Where in, the function
  is element data in the set. If all co-occurrence regions are taken into account, the following formula is valid:
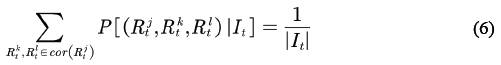
Formula (6) prevents the bias toward regions with more co-occurrence regions when calculating  . Based on Formula (5) and the calculation formula of
  Formula (4) can be simplified as:
2.3.2 Code Co-occurrence Matrix
The codes are defined to describe the importance and generate code cooccurrence matrix to simplify the calculation of 
The correlation between  and
and  is reflected by the code triad importance function
  . It is possible to determine the importance of the code triad to
  by virtue of prior probability of
  . The calculation formula is as follows:
Wherein, u, v and w are codes that jointly constitute code cooccurrence matrix Mk. Assuming that the prior probability  follows a uniform distribution, Formula (7) can be simplified as:
2.3.3 Semantic Score Function
Semantic scores can be divided into region semantic scores and semantic image scores. Region semantic score function is used to calculate the correlation between  and
and  :
:
The normalization coefficient  prevents bias of semantic scores toward regions with more co-occurrence regions. According to the region semantic score function, the image semantic score function
  can be defined as:
The image semantic score function is used to measure the correlation between  is greater than the predefined thresholds, It is deemed to contain the semantic concept
  at least. According to Formula (9) and Formula (11),
It should be noted that this is a special form of Formula (3), which indicates that the image semantic score function is consistent with cooccurrence region based Bayesian networks.
2.3.4 Learning with Bayesian Networks
The prior probability  can be obtained from a group of training samples that reflect semantic concept
  and consist of
  and its cooccurrence regions to calculate the semantic score of images. The probability of the code triad can be calculated through Formula (13):
Since  and
and  may not belong to Tk, the choice function ε is defined as:
The prior probability  can be approximately calculated through Formula (15):
If users submit a new training sample  and merge it with the original training sample Tk, the prior probability
  shall be recalculated through Formula (16):
If there are intersections between the new training sample and the original training sample, the calculation formula of the prior probability is  .
.
2.4 Stepwise Remote Sensing Image Retrieval
Traditional content-based remote sensing image retrieval systems tend to calculate the distance between low-level feature vectors. Due to semantic gaps, however, images with similar features and irrelevant semantics are always retrieved (Ali et al., 2017). In the process of image retrieval, time efficiency is also a key factor that determines the performance of the retrieval system. Users require not only high precision and recall but also demand high time efficiency.
2.4.1 Integrated Region Matching
Integrated region matching (IRM), which has the strong robustness to possible segmentation errors, determines the overall similarity of images by comprehensively calculating the similarity of all image regions. Mathematically speaking, image similarity can be determined by calculating the distance between two point sets in high-dimension space (feature space). Although there are many methods of calculating the distance, such as Euclidean distance, between points in high-dimension space, they cannot be used to calculate the distance between two point sets. The biggest problem of defining the distance between two point sets in feature space is to maximize the difference between overall similarity and people's subjective feelings of image similarity. By comprehensively considering significance and distance between image regions, integrated region matching allows one region to match multiple regions, thereby minimizing retrieval errors caused by inaccurate image segmentation (Yasin et al., 2017).
According to the research results of Wang et al.(2016), the algorithm is described as follows: Image 1 and Image 2 are represented by  , and feature vectors ofthe segmentation region i and j are represented by r¡ and
  respectively. Also, the distance between r
¡
and is
respectively. Also, the distance between r
¡
and is  .When calculating the distance between R
1
and R
2
, it is necessary to match all regions of the two images, calculate the distance between all regions and give corresponding weights to significance factors
.When calculating the distance between R
1
and R
2
, it is necessary to match all regions of the two images, calculate the distance between all regions and give corresponding weights to significance factors  . Since significance factor represents the matching degree between r¡ and
  is referred to as significance matrix.
The significance matrix S of integrated region matching is determined by significance factors si,j - the area ratio between one region and the whole image. Assuming that the area ratio of  in Image 1 and
  in Image 2 is P
i
and
in Image 2 is P
i
and  separately, then
Under standard conditions,  . A reasonable matching mechanism is required to involve all image regions and give priority to the matching of the most similar regions. Under this matching mechanism, regions in Image 1 will only match with similar regions in Image 2. In other words, the distance between the two images is 0. By distributing significance factors, integrated region matching connects the most similar regions in two images with the shortest distance, which is referred to as the most similar highest priority (MSHP).
It is assumed that d(i',j') is the minimum distance,  and
and  to obtain significance matrix with an iterative method. When
  and j', which are regions with the minimum matching distance, are successfully matched together by significance factors of i'. The significance factor of j' is calculated through
  . According to MSHP, the matching problem of
  can be solved when the following four formula requirements are met.
The iteration stops when all significant factors are calculated.
By co-occurrence region based Bayesian networks, the algorithm selects a group of candidate images that are highly correlated with the query semantics from large-scale remote sensing image database and adopts integrated region matching to reorder candidate images and return top ranking images, thereby realizing rapid image retrieval. Since co-occurrence region based Bayesian network image retrieval is characterized by low time complexity, it can retrieve a group of candidate images that are highly correlated with the query semantics within a short time (Shahzad et al., 2017; Basarían and Tahir, 2017). Integrated region matching has high time complexity. In comparison with the entire database, candidate images are small in quantities, which effectively reduce image retrieval time. Flowchart of the whole process is shown in Figure 3.
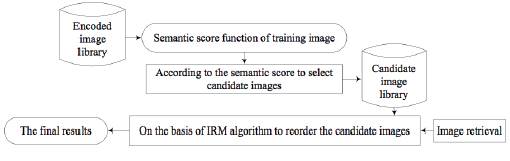
Stepwise region retrieval is mathematically described as follows: Step 1: select a group of candidate images that are highly correlated with the query semantics. There are two alternatives:
(1) Users choose candidate images by searching images by the image semantic score function trained from co-occurrence region based Bayesian networks. Let I
q
be the query image and  be the threshold of semantic image score; then the candidate images can be expressed as:
(2) Users select candidate images by searching semantic information of pictures by semantic score function. Assuming that Iq has two semantic meanings,  and
and  are the two semantic score functions, and
  and
and  are thresholds of the two functions, then the candidate images selected can be expressed as:
Under normal circumstances, the threshold shall be set to 0, to ensure the precision of image retrieval.
Step 2: adopt integrated region matching and query Iq to reorder the candidate image gallery A, return top ranking images and finish the search. The more the returned images are similar to the query images in spectral and texture features, the more top-ranked the images will be.
3. Results
This experiment involves a total of 28 multi-spectral remote sensing images photographed by IKONOS and synthesizes standard true-color images with blue, green and red wave bands. Each image is segmented into 256x256 sub-images, and the maximum repeatability between two subimages is 50%. After deleting unqualified images, the database has a total of 12,000 sub-images, covering nearly 40,000km2 earth surfaces. Images in the database are classified into six categories following semantic meanings: farmland (644), city (3,547), water body (3,243), vegetation (2,937), bare earth (1,033) and rock (1,730). Wherein, the figures in brackets represent numbers of images related to corresponding semantic concepts, and one image may be correlated with multiple semantic concepts. This paper measures performance of the retrieval system with precision and recall.
In the experiment, the author segments images into 32x32 subimages extracts color histograms of regions with spectral features and employs the k-means algorithm for image clustering. When generating encoded image library, the color feature vectors are classified into tree codes by the k-means algorithm, thereby generating codebooks (Hussin et al., 2017). Each image area is encoded into corresponding codes following its feature vectors, thereby making encoded image library. This experiment creates three-level codebooks: 150, 300 and 600.
Experiments are designed to verify the retrieval algorithm proposed, which focuses on co-occurrence region based Bayesian network stepwise remote sensing image retrieval, verifies precision and time efficiency of the algorithm.
3.1 Experiment Design and Results
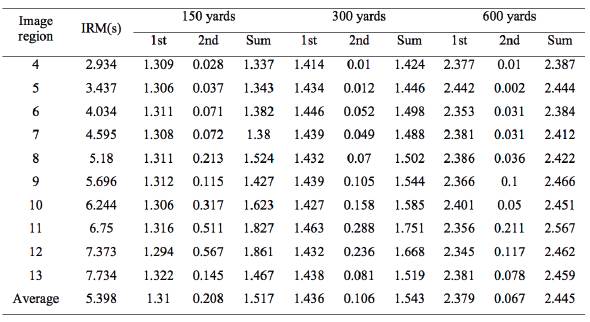
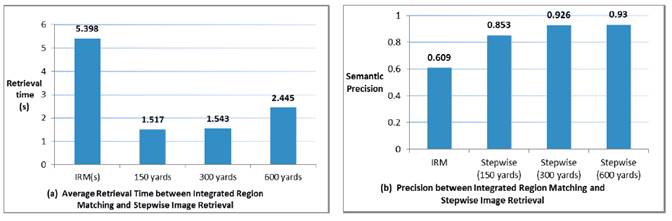
Considering that the retrieval time of integrated region matching may be influenced by the segmentation region numbers of query images, the experiment selects images with 4 to 13 image regions, with integrated region matching and stepwise image retrieval as controlled trails. Each retrieval experiment is repeated for three times, to ensure the accuracy of time, and the average of the retrieval time is deemed as the experiment result. Since stepwise image retrieval experiment records the time consumed in Step 1 and Step 2, it is possible to obtain the total retrieval time. This experiment measures performances of retrieval systems by retrieving time and precision. The retrieval time of integrated region matching and stepwise image retrieval is shown in Table 2, and the comparison results are shown in Figure 4(a). Since integrated region matching belongs to sorting algorithm, rather than classification algorithm, it selects the first 100 images for precision calculation. As for stepwise image retrieval, it will fetch the first 100 images if it retrieves more than 100 images; otherwise, it will be subject to the number of images returned. The final retrieval precision is demonstrated in Figure 4(b).
Table 2 A Comparison of Retrieval Time between Integrated Region Matching and Stepwise Image Retrieval
4. Discussion
4.1 Time Efficiency Analysis
According to Table 2, the retrieval time of integrated region matching increases gradually with the increase in region numbers, which is mainly because the number increase adds difficulties to the computation. Nevertheless, the increase in region numbers has little impact on the retrieval time of stepwise image retrieval. It fluctuates around 1.3s, 1.4s and 2.35s at 150, 300 and 600 yards respectively. With the increase of codebook numbers, however, the retrieval time increases accordingly. On average, the retrieve time rises by 0.126s from 150 yards to 300 yards and by 0.943s from 300 yards to 600 yards. Due to the increase of codebook numbers, code co-occurrence matrices appear. The codebooks at 300 yards are eight times those at 150 yards, and the codebooks at 600 yards are eight times those at 300 yards, which indicates that the ratio of retrieval time difference is 1:8. Through experiment, the ratio is proved to be 1:7.4841, which is consistent with the speculation. The retrieval time of Step 2 is related to the number of candidate images returned in Step 1. It can be seen from Figure 4(a) that the retrieval time of stepwise image retrieval is significantly shorter than that of integrated region matching, which is because co-occurrence region based remote sensing image retrieval has lower time complexity.
4.2 Recall Analysis
According to Figure 4(b), the precision of integrated region matching is 0.609, which is significantly higher than that of stepwise image retrieval (0.853, 0.926 and 0.93 at 150, 300 and 600 yards respectively). The reasons are as follows: images retrieved by integrated region matching are merely similar to each other in respect to low-level features, without considering semantic similarity. Stepwise image retrieval selects candidate images highly correlated with query images and retrieves images with similar characteristics to query images by integrated region matching, which effectively improves the precision of image retrieval.
4.3 Retrieval Cases
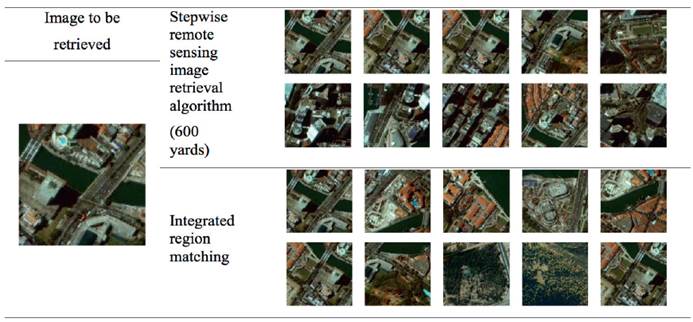
This paper selects an image of city region for retrieval analysis and 600 yards for stepwise image retrieval. The first ten images retrieved are shown in Table 3: arranged from left to right and from top to bottom.
5. Conclusions
By considering remote sensing image features and remote sensing image retrieval, the paper proposes a co-occurrence region based Bayesian network stepwise remote sensing image retrieval algorithm that takes into account both time efficiency and retrieval precision. This algorithm mainly draws reference from stepwise remote sensing image retrieval proposed by Moustakidis et al.(2012) and based on CSBN and integrated region matching. It consists of two parts: co-occurrence region based remote sensing image retrieval and integrated region matching. Select a group of candidate images that are highly correlated with query images in semantics by co-occurrence region based remote sensing image retrieval and reorder the candidate images with integrated region matching, thereby obtaining the final retrieval results. From the perspective of time efficiency, stepwise remote sensing image retrieval consumes 1.5171s, 1.5425s and 2.4454s at 150, 300 and 600 yards respectively. Regarding the precision, integrated region matching enjoys an accuracy of 0.609 while stepwise image retrieval significantly improves the precision to 0.853, 0.926 and 0.93 at 150, 300 and 600 yards respectively.

