


 English (pdf)
 Article in xml format
 Article references
 Send this article by e-mail
 Cited by SciELO
  Cited by Google
  Similars in
SciELO
Similars in
SciELO  Similars in Google
 Permalink
1. Introduction
Fragile geological conditions, frequent and intensive typhoon attacks and heavy rainfall can cause debris flows to transport large amounts of sediment, which can lead to the formation of dams on rivers in Taiwan (Chen, 1999; Kuo et al. 2011; Zhou, et al. 2012; Dong et al. 2014). Approximately 40-50% of the dams fail within 1 week, and only 10-15% remain for one year or longer (Costa and Schuster, 1988; Peng and Zhang, 2012). When a dam fails, the materials of the dam are rapidly transported by the river flow to the downstream area and can cause serious debris flow, river bank erosion and flooding hazards downstream of the catchment (Ermini and Casagli, 2003; Korup, 2004; Dong et al. 2011; Li et al. 2011; Peng and Zhang, 2012; Chen et al. 2014; Shrestha and Nakagawa, 2016).
Typhoon Morakot (2009/08/08) brought 1,911 mm of precipitation to southern Taiwan via heavy rainfall and caused serious compound disasters. The maximum hourly rainfall, 24-h rainfall, and 48-h rainfall were recorded as 94.5, 1,077.5 and 1,601 mm, respectively. Compound disasters included landslides, landslide dams, debris flows π and floods (Chen et al. 2011; Dong et al. 2011; Lee et al. 2013). The extreme continuous rainfall triggered 20 debris flows (Jan et al. 2011), the majority of which blocked main branches of rivers. Dam formations are difficult to evaluate because short-lived dams typically fail before an investigation can be conducted. Therefore, a theoretical method to evaluate dam formation is important for disaster prevention.
Three compound relations between the debris flow and the main branch of the river are typically important for dam formation: (1) the deposition volume of debris flow that crosses the river is larger than the minimum river-blocking volume; (2) the deposition thickness is greater than the water depth of the main branch of the river; and (3) the amount of sediment supplied by the debris flow is larger than the amount of erosion by the river flow (Zhou et al. 1991; Wu et al. 2005; Cheng et al. 2005). These conditions are affected by the confluence angles, the discharge ratio, the velocity ratio between the tributary and main branch of the river, the initial shear stress of the debris flow, the bulk density of the debris flow, and the grain sizes. These key factors were used to establish the blockage index or critical index based on experiment results (Cui et al. 2006; Cheng et al. 2007; Dang et al. 2009; Du et al. 2014). Although the criteria were established, some important issues were not considered, namely, (1) whether the debris flow can run across the main branch of the river and (2) whether the minimum deposition thickness of the debris flow is higher than the water depth of the main branch of the river. In addition, the discharge ratios and velocity ratios considered in previous experiments were relatively large and may not be suitable in certain regions, such as Taiwan.
This study aimed to develop an assessment method to evaluate debris flow dam formation considering the debris flow volume, velocity, deposition slope angle, possible run-out distance, and deposition depth. The assessment method can evaluate debris flows that dam rivers at different watershed scales.
2. Study area
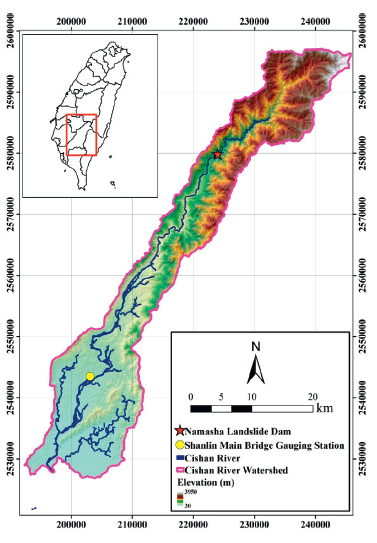
The Namasha debris flow dam is located at the upstream Cishan River in Kaohsiung County, Taiwan (Figure 1; TWD67, E: 223973 and N: 2579888). According to satellite images and field investigations, the dam area is approximately 0.27 km2, the backwater length is approximately 1.7 km, and the water storage volume is approximately 1,850,000 m3 (Figure 2). In 2009, Typhoon Morakot brought 1,911 mm of rainfall over a three-day period in southern Taiwan. The total accumulated rainfall was more than 2,000 mm, which triggered a large-scale landslide in the upstream of the Cishan River watershed. The main rainfall on Aug. 7-9 brought rainfall with a maximum peak hourly intensity of 94.5 mm/h, and the duration was 99 h (Dong et al. 2014). The debris flow from the Er River catchment flowed to the main branch of the Cishan River with a confluence angle of approximately 90° and formed a large deposition fan at the junction of the Cishan River and Er River. The debris flow fan formed the dam, and the dam height was approximately 9.3 m. When the main branch of the Cishan River was blocked by the debris flow fan, the dam was formed and the flow storage behind the dam gradually increased. The water level increased rapidly and began to flow over the top of the dam. The debris flow dam was overtopped and formed a 20-m-wide spillway. During the typhoons of Fanapi (2010), the maximum peak hourly rainfall intensity was 34 mm/h, which triggered a debris flow from the Er River and blocked the main branch of Cishan River again. The flooding caused the overtopping erosion of the debris flow dam. The Pingtung Forest District Office of the Forestry Bureau performed flow-divergent engineering treatment to divert the flow of the river back to its original direction (Taiwan Forestry Bureau, 2013).
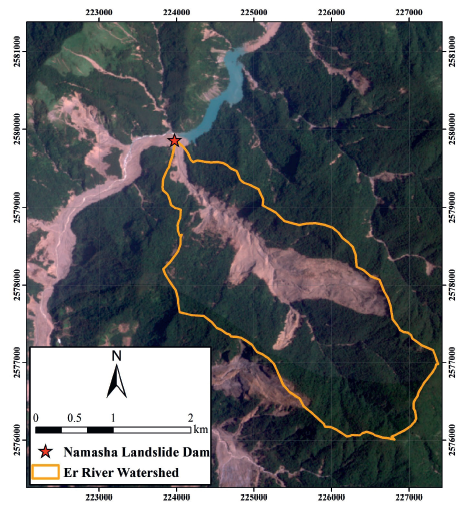
For the Namasha debris flow dam, the tributary watershed area of the Er River upstream is approximately 6.7 km2. The mean channel width, upstream slope and downstream slope of the Er River are 10 m, 17.8°, and 0°, respectively. These parameters can be evaluated using GIS. Evaluations of river blocking by debris flow using several empirical formulas (Cui et al. 2006; Cheng et al. 2007; Dang et al. 2009) indicated that damming of the river did not occur because of the confluence of the Cishan River and Er River. The results of these empirical formulas were unsatisfactory because of several reasons. First, for different watershed scales, a tributary debris flow rushes into the main branch of the river and forms a landslide dam; a smaller discharge-velocity ratio may easily form a landslide dam under a smaller watershed. Second, the initial shear stress can affect the assessment result for the debris flow dam formation and requires a precise value. The initial shear stress is not easily obtained or assumed when evaluating the formation of a debris flow dam. Third, the topographical effect plays an important role in debris flow dam formation; steep narrow valleys require relatively small volumes or discharge of debris flow to block the main branch of the river and form a dam (Costa and Schuster, 1988).
The relationships between the run-out distance and deposition thickness of a debris flow must be considered when analyzing debris flow dam formation. Du et al. (2014) proposed that if the run-out distance of a debris flow was larger than the width of the main branch of the river, the debris flow might block the river and form a landslide dam. However, this result did not consider the relationship between the deposited thickness of the debris flow and the water depth of the main branch of the river. Therefore, a more appropriate assessment methodology is necessary in this study.
3. Assessment method
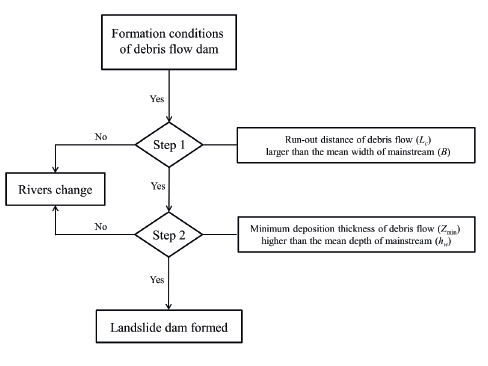
The method for evaluating the formation of a debris flow dam, based on the two characteristics of river blocking, is described in Figure 3. The potential for the formation of a debris flow dam relies on whether the run-out distance Lc is larger than the river width B and whether the deposited thickness Z min by the debris flow is larger than the in situ water depth h w To rapidly assess the debris flow dam that has not occurred, these parameters of the assessment method can be evaluated based on the satellite images, topographical maps (1/25,000), DTM and assumed conditions. Two dam formation conditions under a debris flow event were established based on these parameters.
3.1 Sediment transported by debris flow
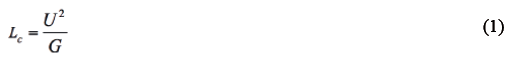
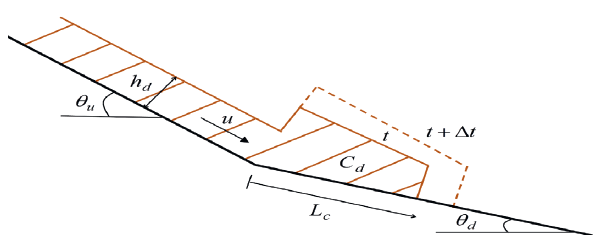
The sediment from the tributary deposits at the confluence to form a debris flow fan. The debris flow fan must reach across the river. If the confluence angle is 90°, the run-out distance of the debris flow L c must be greater than the average width B of the main branch of the river. The run-out distance was estimated by Takahashi and Yoshida (1979), as shown in Equations (1), (2) and (3). If the confluence angle is larger than 90°, Lc should be replaced by Lc sin α, where α is the confluence angle of the tributary and main branch of the river (Du et al. 2014). The momentum conservation of the debris flow is
where
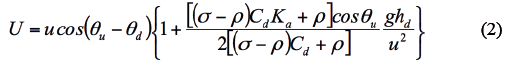
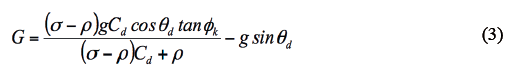
σ is the density of the particle; ρ is the density of the fluid; g is the acceleration due to gravity; θu is the upstream slope of the tributary; θ d is the downstream slope of the tributary; and Φ k is the kinematic friction angle (Tsai (1999) proposed that Φ k =31° ); Ka= tan2 (45°- ( /2) is the coefficient of active earth pressure ( ( is the internal friction angle; Tsai (1999) proposed that Φ=37°); hd is the mean depth of the debris flow; u is the mean velocity of the debris flow; and C d is the volume concentration of the debris flow, as shown in Figure 4.
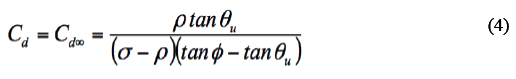
The volume concentration of the debris flow Cd can be substituted with the equilibrium concentration Cd∞. Takahashi (1977) derived the equilibrium concentration as follows:
The debris flow is assumed to be a uniform flow based on the conservation of mass of water and sediment. The debris flow discharge Q d is calculated in Eq. 5.

where B d is the mean channel width of the tributary.
Tsai (1999) derived the following relation between the debris flow discharge Q d and the rainfall intensity I in Taiwan:
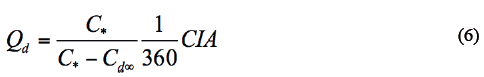
where C* is the volume concentration of the debris flow in deposition (Tsai (1999) proposed that C* = 0.67); C is the runoff coefficient (assumed to be 0.8); I is the rainfall intensity; and A is the watershed area of the tributary.
Based on the constitutive relationship (Bagnold, 1954), Takahashi (1977) evaluated the mean velocity of the debris flow u using Eq. (7).
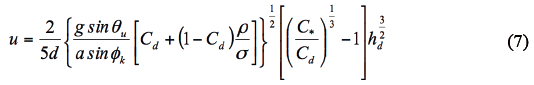
where d is the particle diameter and can be represented by the mean particle diameter d 50 ; and a is the Bagnold Number, which is equal to 0.042 (Bagnold, 1954).
Substituting Eqs. (6) and (7) into Eq. (5), we obtain the mean depth h d and mean velocity u of the debris flow. Finally, the run-out distance Lc can be estimated.
3.2 Deposition thickness by debris flow
The configurations of debris flow fans were studied in a series of experiments and field investigations (Tsai, 1999). Takahashi (1991) proposed the following equation for the deposition slope of a debris flow fan tany:
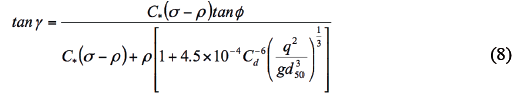
where q is the unit width discharge of the debris flow (q = uhd).
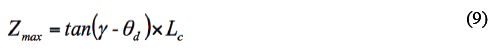
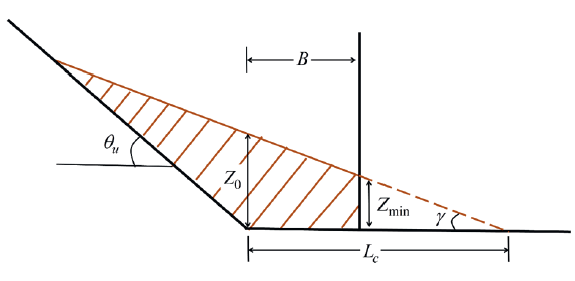
The deposition thickness of a debris flow Zmax is provided by the geometric relationship between the deposition slope of the debris flow fan tany and the run-out distance of the debris flow Lc as follows:
We suppose that the minimum deposition thickness of the debris flow Z min must be higher than the water level of the main branch of the river h w . Otherwise, the debris flow fan is submerged. In addition, the deposition gradient of the debris flow fan tany remains constant. The minimum deposition thickness of the debris flow Z min is given by the following geometric relationship (Figure 5):

To obtain the water depth h w of the main branch of the river, the discharge of the main branch of the river at the debris flow dam must be estimated. The area ratio method can be used to estimate the discharge of the main branch of the river at the debris flow dam as follows:
where Q w1 and Q w2 are the discharge of the main branch of the river at the debris flow dam and downstream gauging station, respectively. A 1 and A 2 are the upstream watershed areas of the debris flow dam and downstream gauging station, respectively.
Substituting the discharge of the main branch of the river at the debris flow dam Q w1 into Manning's formula, we obtain the mean depth of the main branch of the river h w as follows:
where A w is the cross-sectional area of the flow; u w is the mean velocity of the flow; n is Manning's coefficient; and S is the mean slope of the main branch of the river.
4. Validation of the assessment method
4.1 Parameters of the Namasha debris flow dam
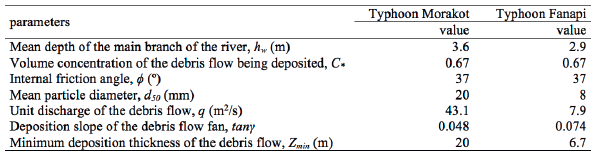
In this study, Typhoon Morakot and Typhoon Fanapi were adopted to evaluate the formation of Namasha debris flow dam. For the Namasha debris flow dam in Typhoon Morakot, the volume concentration of the debris flow Cd can be calculated using Eq. (4); the value is approximately 0.451. According to the calculation, the debris flow discharge during Typhoon Morakot approached 431 m3/s, and the mean velocity u and mean depth hd of the debris flow were 35.7 m/s and 1.21 m, respectively. From the field investigations and photographic techniques used to estimate the grain size distribution (Casagli et al. 2003), the mean particle diameter d 50 is approximately 20 mm. The density of water is 1, the density of particle is 2.65, and we assume that the internal friction angle φ, kinematic friction angle φk, and volume concentration of the debris flow being deposited C* are 37°, 31°, and 0.67, respectively.
The watershed area of the confluence upstream for the Cishan River and Er River is approximately 212 km2, and the mean river width B and the mean river slope S are approximately 40 m and 2.04°, respectively. During Typhoon Morakot, the peak discharge in the recorded data was 3,870 m3/s at the Shanlin Bridge. The area ratio method can be used to obtain the Cishan River flow discharge, which was approximately 1,630 m3/s at the Namasha landslide dam with a water depth of 3.6 m.
In Typhoon Fanapi event, the mean channel width, upstream slope and downstream slope of the Er River had been changed to 22 m, 18.3°, and 0°, respectively. Calculating by Eq. (4), the volume concentration of debris flow Cd is approximately 0.474. According to the calculation, the debris flow discharge approached 173 m3/s, and the mean velocity u and mean depth h d of the debris flow were 17.7 m/s and 0.44 m, respectively.
In the research report (Taiwan Forestry Bureau, 2013), the mean particle diameter d 50, the mean river width B, and mean river slope S of Cishan River are 8mm, 20 m, and 0.9°, respectively. The peak discharge in the recorded data was 860 m3/s at the Shanlin Bridge during Typhoon Fanapi. The area ratio method can be used to estimate the Cishan River flow discharge, which was approximately 362 m3/s at the Namasha landslide dam with a water depth of 2.93 m.
To understand the formation mechanics of the Namasha debris flow dam in the events of Typhoon Morakot and Typhoon Fanapi, the criteria of debris flow dam formation must be calculated using the assessment method.
4.2 Evaluation of the run-out distance and minimum deposited thickness of debris flow
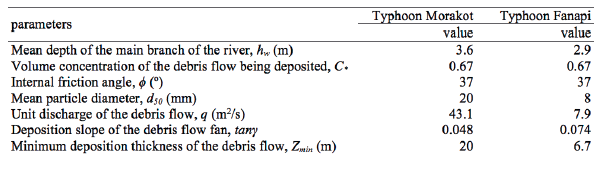
The run-out distance of the debris flow L c for Typhoon Morakot and Typhoon Fanapi events, which can be estimated by Eq. (1) for the Er River, is approximately 463 m and 111 m, respectively. And the mean river width of Cishan River B is approximately 40 m and 20 m, respectively. These values satisfy the Lc>B condition, which indicates that the debris flow from Er River can reach across the main branch of the Cishan River in Typhoon Morakot and Typhoon Fanapi events (Table 1). In addition, the deposition slope of the debris flow fan tany and the minimum deposition thickness of the debris flow Zmin must be estimated. The deposition slope of the debris flow fan from the Er River tany is approximately 0.048 and 0.074. And the minimum deposition thickness of the debris flow Z min is 20 m and 8 m, respectively. The estimated mean water depth of the Cishan River hw is approximately 3.6 m and 2.9 m in Typhoon Morakot and Typhoon Fanapi events by means of Manning's formula. These results indicate that the deposition thickness are higher than the water depth (Z min > hw ) and will thus form the landslide dam in Typhoon Morakot and Typhoon Fanapi events. All of the parameters are listed in Table 2.
5. Discussion
The formation conditions of debris flow dams must be considered to ensure that the evaluation method is applicable. The assessment method results show that our prediction method can be applied in our study area. Indeed, some parameters cannot be obtained, such as the initial shear stress, the volume concentration of the debris flow in deposition, and the internal friction angle; thus, the appropriate assumptions are necessary.
Notably, we use two evaluation conditions to predict the formation of the landslide dam resulting from the debris flow based on debris flow theory, at least in the debris flow that had not occurred. The debris flow theory parameters can be estimated from historical data in our study; therefore, the prediction method is more useful for pre-event prediction. For the accurate pre-event prediction of landslide dam formation, the in situ landslide dam parameters are hard to obtain. Therefore, the parameter sensitivity need to be scrutinized for finding out the most sensitive parameters (Alejano et al. 2010; González-Ollauri and Mickovski, 2014). The prediction result of Typhoon Morakot case is used to illustrate the sensitivity of input parameters. One parameter will be varied at a time while holding the others fixed. Base on debris flow discharge is about 431 m3/s in Typhoon Morakot event, the sensitivity analysis of the density of the particle σ, the kinematic friction angle φk, the volume concentration of the debris flow in deposition C* and the internal friction angle φ were
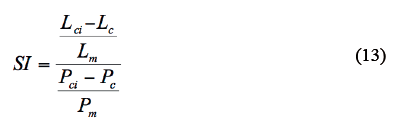
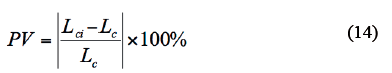
assessed by the sensitivity index SI and the percentage of variation PV (Daniel, 1973) and changing the parameter's base value by ± 10 %.
where L c is run-out distance of the debris flow in Typhoon Morakot event; L ci is run-out distance of the debris flow at changed value; L m is average between L c and Lci; P c is parameter's base value; P ci is parameter's changed value; Pm is average between P c and P ci .
Table 3 and Figure 6 present the parameter sensitivity analysis results. The internal friction angle φ is a most sensitive parameter for the assessment method. The base value of 10% change gets a percentage of variation of 62%. This range of change is considerably more than other parameter. It should be cautiously used for accurate estimation of internal friction angle φ in assessment method.
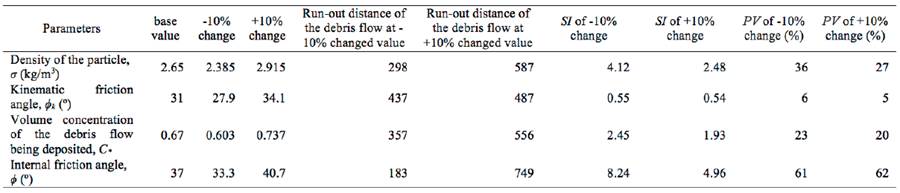

Figure 6 Sensitivity analysis of parameters by the sensitivity index SI and the percentage of variation PV
The assessment method to evaluate the formation of debris flow dams has limitations. This method cannot react to the effects of the water flow action to form a dam, such as the water static pressure, drag force and buoyancy. We will continue to develop and improve the assessment method in future studies.
6. Conclusions
This study presents an assessment method to evaluate the formation of debris flow dams, which can be described under two conditions: (1) the sediment transported by the debris flow must reach across the river; and (2) the thickness deposited by the debris flow must be greater than the in situ water depth. Obviously, the evaluation result of two typhoon events is consistent with the Namasha landslide dam cases. The run-out distance and minimum deposition thickness of the debris flow from the Er River were calculated, and the results satisfy the formation conditions of a debris flow dam. The competitive relationship between the debris flow and river flow are necessary conditions for the formation of a debris flow dam. However, the mechanism is highly complex for the debris flow and river flow and affects the deposition types of tributary debris flow rushes into the main branch of the river. Subsequent studies on this topic must be performed in the near future.

