


 Inglês (pdf)
 Artigo em XML
 Referências do artigo
 Enviar este artigo por email
 Citado por SciELO
  Citado por Google
  Similares em
SciELO
Similares em
SciELO  Similares em Google
 Permalink
Introduction
The Mesozoic Era in northern Iraq are considered one of the most suitable locations for deposition carbonate rocks, due to ecumenical temperature rise the best source and reservoir rocks in the Jurassic and Cretaceous period are made (Jassim and Goff, 2006). The Cretaceous succession has been extensively studied because it contains abundant reservoir intervals (Al-Sakini, 1992). The major of discovered hydrocarbon reserves in Iraq are in Cretaceous reservoirs, although numerous oil and gas fields have been discovered recently in deeper Jurassic and Cretaceous reservoirs in the Kurdistan region, including the Shaikhan, Atrush, Swara-Tika, Bakrman, Bina-Bawi, and Mirawa oilfields (Verma et al., 2004). Most of the significant hydrocarbon discoveries in the Kurdistan region occur in compressional structures formed during the Zagros Orogeny. The subsidence in the developing Zagros foredeep induced a major phase of source rock evaluation and hydrocarbon expulsion, and it is probable that hydrocarbon charging of the Zagros anticlines occurred via relatively short-distance migration from the adjacent synclinal kitchens (Joseph et al., 2015). Reservoir rocks, where petroleum accumulations have been found, are mainly siliciclastic rock (sandstone), or carbonate rocks (limestone and dolomite). Fluid flow through heterogeneous carbonate reservoirs (limestone and dolomite) is a substantially different process from the flow through the homogeneous sandstone reservoir, this variation is largely cause to the fact that carbonate rocks tend to have a more complex pore system (i.e the interrelationships among depositional lithologies, the geometries of depositional facies, and diagenesis) than sandstone (Amin, et. al., 1987).
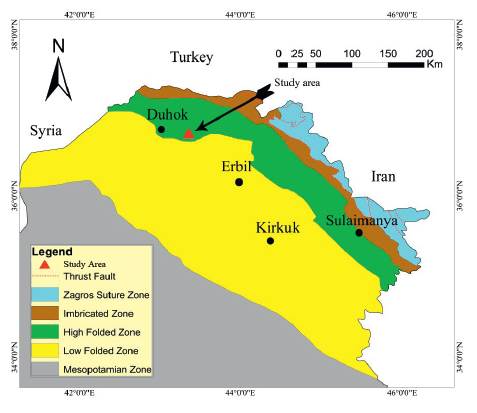
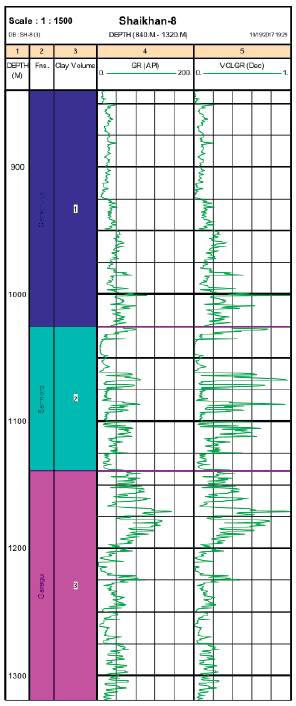
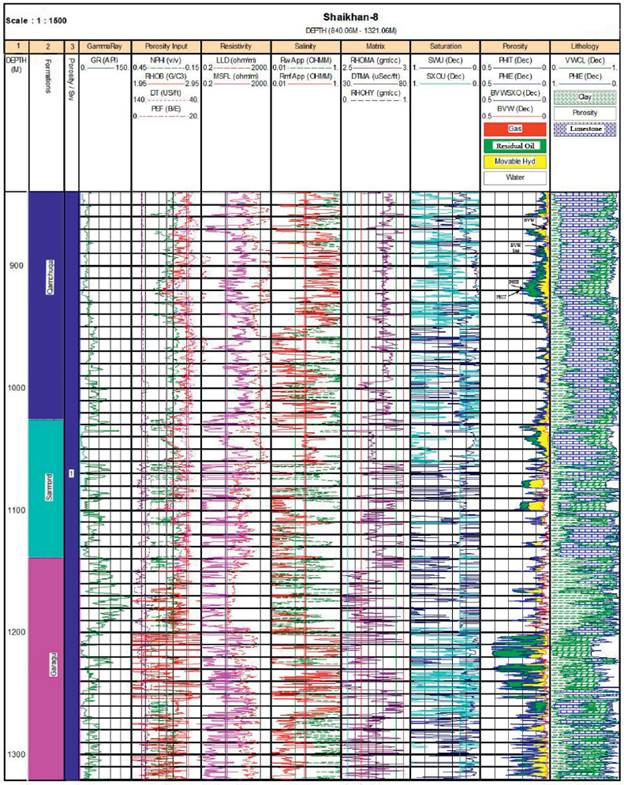
Three carbonate formations were selected in well Shaikhan-8 for this study, which is located 60 km southeast of Duhok city at the High Folded Zone (Figure 1). The Shaikhan structure is an anticline at the northwestern terminus of the Zagros Fold Belt, and affected by several faults (Gulf Keystone 2013). The studied formations that contain Qamchuqa, Sarmord and Garagu are belonging to the Late Tithonian - Early Turonian period; and defined by Wetzel, 1950 in northern of Iraq (Bellen et al., 1959). Lithologically the formations are composed of grey to greenish grey dolomite with greyish yellowish limestone and dolomitic limestone in addition to grey shale and sandstone. The thickness and intervals for three formations Qamchuqa, Sarmord and Garagu are 186m from the interval 840-1026m, 113m from the interval 1026-1139m and 181m, from the interval 1139-1320m respectively.
The main objective of this study is to determine petrophysical evaluations (porosity, water saturation, and hydrocarbon saturation) for the Early Cretaceous formations at Duhok basin.
Material and method
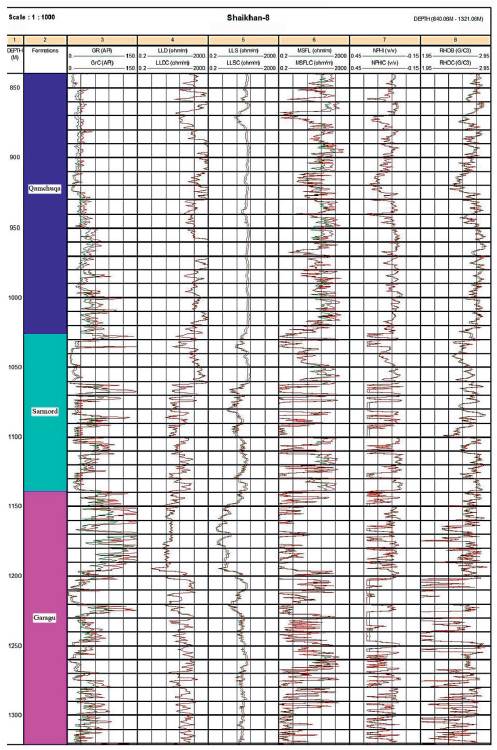
This research involves the analysis of petrophysical properties using data from the available logs such as caliper, gamma ray, density, neutron, sonic, and resistivity logs, The available open hole logs data imported into the appropriate Interactive Petrophysics software (IP- Version 3.5) for analysis and interpretation. One reading per 0.5m depth is selected for recording the input data measurements. Log data are adversely influenced by the borehole environment such as borehole size, pressure, salinity, drilling mud, filter cake. The effects of these environment conditions on the log data may be eliminated through environment correction. After the well log curves were checked and calibrated to the depth by using gamma ray log as a reference curve, all environment corrections (gamma ray, density, neutron, and resistivity logs) have been done using Schlumberger chart (SLB, 2005), which is supplied to this software program as the environmental correction module (Figure 2); then shale volume (V sh ) calculations were made, and the lithology and mineralogy discriminations were interpreted through appropriate crossplots, and porosity (Φ) estimated from neutron and density logs. The resistivity logs were utilized in order to obtain water saturation (S w ).
Results and discussion
1. Shale Volume Estimation (V sh )
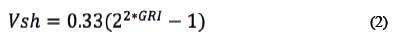
In order to calculate the volume of shale, gamma ray log is the most common indicator. The maximum gamma ray response is taken as the shale point and minimum response as the clean point. The lower shale content usually reveals a better reservoir whereas increase in volume of shale decreases the effective reservoir capacity. The volume of shale must be correct, if it is not corrected, gives erroneous during calculation volume of hydrocarbon, porosity and water saturation. To calculate the volume of shale for the Early Cretaceous formations at first gamma ray index was calculated by using the following equation:
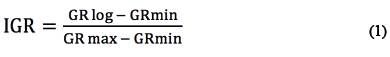
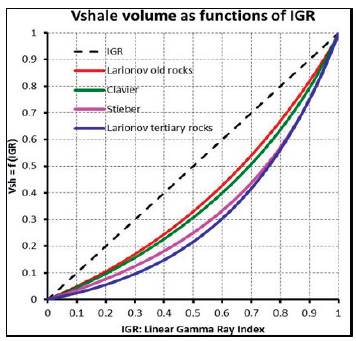
And then this gamma ray index is used to calculate the volume of shale by using the Larionov old rock equation:
Where:
IGR= Gamma ray index
GRlog= Gamma ray log reading of formation
GRman= Minimum gamma ray reading in clean zone, (clean sand or carbonate)
GRmax= Maximum gamma ray reading in shale zone
Vsh =Volume of shale
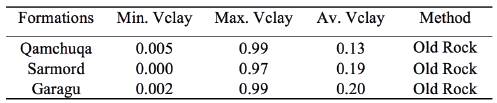
There are a lot of methods used to calculate volume of shale according to age of the formation; Larionov method is used for Mesozoic formations (Figure 3), regarding to this method the average volume of shale ranges between 1320% (Figure 4). Qamchuqa Formation contains minor volume of shale in well Shaikhan-8 (13%), while this value increase in the two other formations ranges between 19-20%, for Sarmord and Garagu formations respectively (Table 1).
2. Formation Temperature Estimation
The temperature gradient module in the software was used to create a continuous temperature curve for the well Shaikhan-8 by entering temperatures at fixed points (Table 2). The software extrapolates between the points.
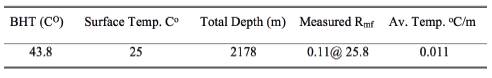
The following equation was used for formation temperature determination:
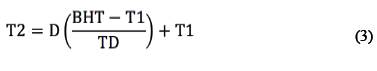
Where:
T 2 = Formation Temperature
D = Log depth
BHT = Bottom hole temperature
T 1 = Surface temperature
TD = Total depth
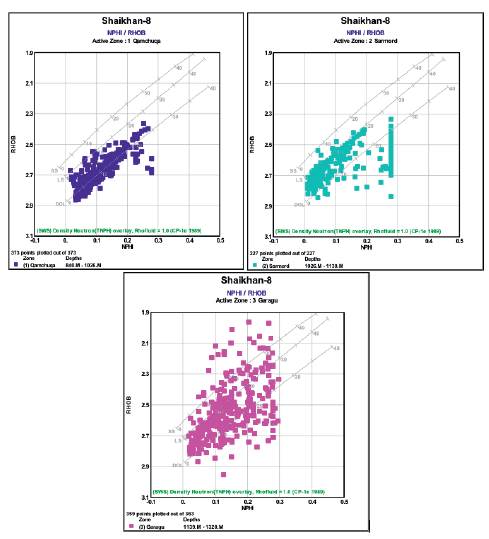
3. Determination of Lithology and Mineralogy
Determination of the lithology and mineralogy composition of the rock formation is important for the evaluation of a reservoir. Lithology often describes the solid (matrix) portion of a rock. The neutron-density crossplot is one of the oldest techniques used for determining the formation lithology. This method consists of plotting neutron porosity (ØN) versus bulk density (ρb) on a standard plot (Hughes, 1992). The neutron log is used to measure the amount of hydrogen in the formations, which is assumed to be related to porosity. The density log is used to measure electron density and from that the formation bulk density, when the two logs are used together, lithology can be determined (Asquith and Krygowski, 2004). Crossplot illustrates the separation between the sandstone, limestone and dolomite lines, the lithology lines are marked with porosity values (Wyllie 1963). According to the neutron-density crossplot, the Qamchuqa Formation in well Shaikhan-8 composed mainly of dolomite with some dolomitic limestone and the porosity ranges between 7-15%. The lower part of the formation has fair porosity, but it has good porosity in the upper part of the formation. The Sarmord Formation consists mainly of limestone, dolomitic limestone with some claystone, the porosity ranges between 5-13%, which indicates poor porosity in the lower part of the formation while fair porosity for the upper part of the formation. The Garagu Formation is mainly composed of limestone and minor dolomitic limestone, in addition to claystone and sandstone. The porosity range between 3-20% the upper part of the formation has very poor porosity (3%), whereas the lower part of the formation has enough porosity (20%) for hydrocarbon accumulation. There are some points that are scattered due to the influence of borehole enlargement and gas effective (Figure 5).
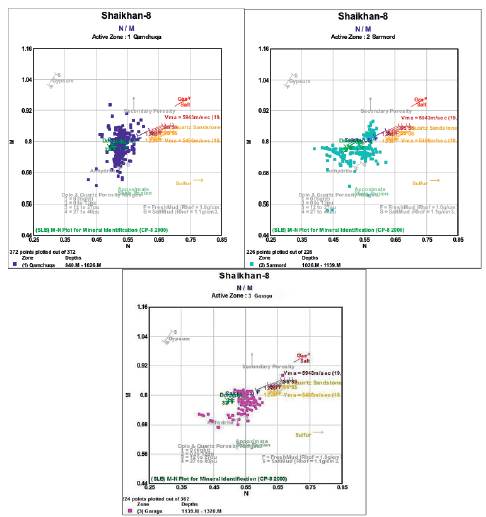
Another relationship is M-N crossplot. This technique is used when lithology of a formation is more complex. This crossplot requires the sonic log along with the neutron and density logs. The sonic log is a porosity log that measures interval transit time (Asquith and Gibson, 1982).
The terms M and N are defined as follows (Schlumberger 1972):
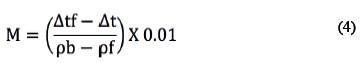
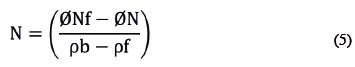
Where:
Δtf Transit time for the fluid in the formation (189 for fresh and 185 for salt water)
Δt: Transit time in the formation (from log)
Pb: Bulk density of formation (from log)
Pf: Density of fluid (1.0 for fresh water, and 1.1 for salt water)
ØNf: Neutron porosity of fluid formation (use 1.0)
ØN: Neutron porosity of formation (from log)
Based on the M-N crossplot, the main constituent of the Qamchuqa Formation is dolomite, calcite and little anhydrite, while Sarmord Formation consist of calcite with little dolomite, whereas Garagu Formation contain calcite with little dolomite and anhydrite (Figure 6).
4. Porosity
The porosity of a rock is the volume of the non-solid portion of the rock that is filled with fluids divided by the total volume of the rock (Crain, 1986). In general porosities tend to be lower in deeper and older rocks due to cementation and overburden pressure stress on the rock (Rider, 1996). Generally, porosity has two main types: total porosity and effective porosity. Total porosity is defined as the ratio of the entire pore space in a rock to its bulk volume (Nnaemeka 2010), or the porosity derived directly from the logs without correction for the clay content. Effective porosity represents the pore space that contains hydrocarbon and bound water (Nnaemeka 2010). The resultant porosity in effective porosity can be determined after removal of the effect of clay. In an interval without shale, the total porosity equals the effective porosity. The porosity from logs can be estimated from a single porosity log (density, neutron, sonic) or a combination of porosity logs.
The relationship between the total porosity (Øt) and the effective porosity (Øe) can be represented by:
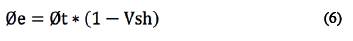
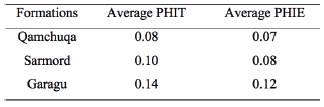
In the current study the total porosity ranges between (8%-14%), while these values decrease to (7%-12%) when calculate the effective porosity, due to influence of shale volume on the porosity (Table 3).
The porosity derived from the density log (ΦD) is defined by the following relationship (Dresser, 1979):
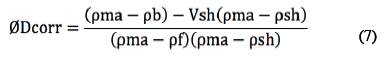
Where:
ΦD corr.= Corrected density for shale effect
ρma = matrix density (S.st = 2.65, L.st=2.71, dolomite=2.88)
ρb= log density
Vsh = Volume of shale
ρsh = Density value of adjacent shale formation
ρf= formation fluid density
For: Fresh water mud, pf= 1.0 g/cc and Salt water mud, pf= 1.1 g/cc, Gas mud, pf= 0.70g/cc
In a shaly formation, the neutron log will appear to be more porous. The effect of shale on the neutron log can be corrected by the following equation:
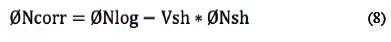
Where:
ΦNcorr = Corrected Neutron porosity
ΦNlog= Neutron log reading ofthe interval
Vsh = Volume of shale
ΦNsh = neutron log of the adjacent shale formation
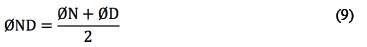
The total porosity can be determined from density and neutron porosities by the following equation:
The velocity of sound through sedimentary rocks depend on lithology and porosity, shale has the lowest sonic velocity, while limestone and dolomite have higher velocities; the velocity of sound is slower and need long travel time when travel through liquids and gas, while at compact zone this velocity is fast and need short travel time to reach receivers. The following formula can be used for calculating the sonic porosity after remove the shale effect (Dresser, 1979):
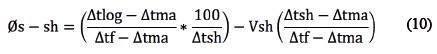
Where:
ΔtLog= is the reading on the sonic log in /ft
Δtma =is the transit time of the matrix material (S.st= 55.5, L.st= 47, Dol. = 43 μs/ft)
Δtf =is the transit time of the saturating fluid (Fresh = 189, Salt = 185 μs/ft)
Δtsh = interval transit time for adjacent shale
Vsh = Volume of shale
5. Formation Water Resistivity (Rw)
Formation water resistivity represents the resistivity value of the water which is uncontaminated by the drilling mud that saturates the porous formation.
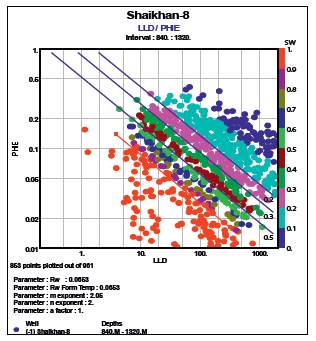
Pickett's (1966) method is a graphical solution to Archie's equation so that plotting deep resistivity (LLD) against effective porosity (PHIE) (both on logarithmic scales) will produce a linear equation:
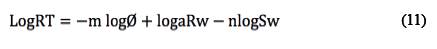
In water bearing zone, Sw = 1
In the plot of the true formation resistivity versus effective porosity, the Archie's parameters were calculated (a=1, m=2.06 and n=2). The red line that passed through points have lowest deep resistivity and highest porosity values which represent the water zone at which water saturation equals one. The slope of the line represents the porosity exponent (m) and the intercept represents the formation water resistivity (R w ) which is equal 0.065 in this well (Figure 7).
6. Reservoir Fluids and Formation Analysis
The reservoir rock fluid saturation is referred to as the percentage of the pore space filled with a particular fluid and the sum of all the fluids in the pore spaces equals one hundred percent. The saturation of water is always part of the fluids that occupy the pore spaces of reservoir rocks (Dresser, 1975). Connate water usually is in the range of 10 % to 40 % in most rocks. This means that the connate water occupies about 10 to 40 percent of the pore volume of the reservoir rock and other fluids (hydrocarbon) occupy the rest of the pore volume. Free water is the water that resides within the macro-porosity region of the interconnected pore space of a reservoir and is able to flow under an applied pressure gradient (Newman, 1987).
a. Water Saturation (S w )
It is the amount of pore volume in a rock that is occupied by formation water. Water saturation is represented as decimal fraction or as percentage (Asquith and Krygowski 2004).
Sw of the uninvaded zone of a reservoir is calculated by the Archie's (1942) formula
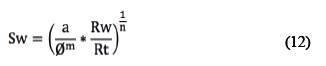
Where:
Sw = Water Saturation, fraction
Rw = Formation Water Resistivity, ohm-m
Rt = True Formation Resistivity for uninvaded zone, ohm-m
Φ=Effective Porosity, and, a, n, and m: Archie's parameters, dimensionless
Water Saturation of the formation's flushed zone (Sxo) is based on the Archie's equation, which is expressed by:
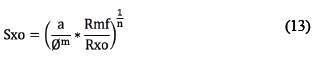
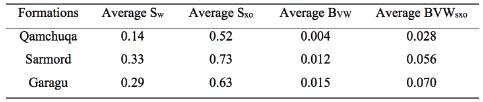
Water saturation of the flushed zone (Sxo ) can be used to indicate the movable hydrocarbon. If the value of Sxo is much higher than Sw, then hydrocarbons in the flushed zone have probably been moved or flushed out of the zone nearest the borehole by the invading drilling fluids (Asquith, and Krygowski, 2004). In the present study the values of the Sxo are greater than Sw; this indicates that the formations under study contain a good movable hydrocarbon (Table 4).
Table 4 Saturation fluid value within the studied formations in well Shaikhan-8 Table 4 Saturation fluid value within the studied formations in well Shaikhan-8
b. Bulk volume analysis (BVW)
Bulk volume analysis represents the amount of the bulk water volume that preserve in sediments during deposition and lithification before the hydrocarbon migrating to the reservoir rocks, which is known as connate water (Tiab and Donaldson, 1996)
The product of the formation water saturation (Sw) and the effective porosity gives the bulk volume of water (BVW) in the uninvaded zone, and the product of the formation water saturation (S xo ) and the effective porosity give the bulk volume of water (BV SXO ) in the flushed zone (Spain, 1992). Comparison of Sw and Sxo in the hydrocarbon zone gives the movable hydrocarbon (S xo - S w ), which is equal to the fraction of the movable hydrocarbons in the formation. The volume percentage in terms of the reservoir is given by multiplying in term of the porosity, i.e. percentage of volume of reservoir with movable hydrocarbons equal to (Rider, 1996).


The area between BVW sxo and B VW represents the movable hydrocarbon, whereas the area between BVW xo and 0 e represents the residual hydrocarbon (Figure 8).
c. Hydrocarbon Saturation (S hc )
The hydrocarbon saturation can be deduced from the water saturation by the following relationship:
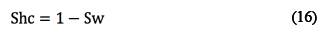
Hydrocarbon saturation is normally differentiated into the non-exploitable or residual hydrocarbon (Shr) and the exploitable or
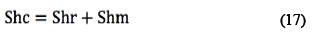
movable hydrocarbon (Shm), as follow:
Movable hydrocarbon represented by yellow color on the computer processing interpretation, (Figure 8) while residual hydrocarbon represented by green color.
7. Reservoir Cutoff
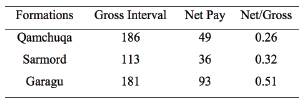
Cutoff values such as shale volume, porosity, and water saturation are very important parameters in calculation of the original oil in place (OOIP) and the reservoir net pay. The results show that the lower Cretaceous formations in the well Shaikhan-8 have more than 178m pay from a total 480m thick (Table 5).
Discussion
This study has shown the petrophysical evaluation of the Early Cretaceous reservoirs along Shaikhan block in the Duhok basin. Even some previous studies have been conducted around that area; there is not detailed published petrophysical evaluation. This study would be the first petrophysical properties calculation in that area. Therefore, it is hoped that this report would help for future explorations in the area. The Early Cretaceous formations in the studied area lithologically composed of dolomite, limestone to dolomitic limestone with some claystone and sandstone. The carbonate formations have fair to good ratio of porosity, especially in the upper part of the Qamchuqa and Sarmord formations, in addition to the lower part of the Garagu Formation that indicate to classify this period as best medium for hydrocarbon accumulation. One of the most important procedures in petrophysical evaluation is calculating the amount of shale in the formations, any formation which contains a high ratio of shale could not be considered as a good reservoir. The amount of shale is very rare in the Early Cretaceous formations, particularly in Qamchuqa Formation.
Conclusions
- Gamma ray log detected very little shale volume in the Qamchuqa Formation (13%), whereas, the shale volume increases in the Sarmord and Garagu formations (19-20%) respectively.
- Neutron-density crossplot show that the Qamchuqa reservoir consists mainly of dolomite, and some dolomitic limestone, but the Sarmord Formation consists of limestone with some dolomitic limestone, whereas the Garagu formation is limestone, dolomitic limestone in addition to claystone and sandstone.
- M-N crossplot claimed that the main constituent mineral of the Qamchuqa Formation is dolomite while calcite is the main constituent for the other formations.
- Porosity logs show that the Qamchuqa Formation has fair porosity in the lower part (7%) and good porosity in the upper part (15%). The Sarmord Formation has poor to fair porosity except some beds in the upper part of the formation that have good porosity, especially in the intervals 1030-1050m,1075-1080m and1093-1100m respectively, but the Garagu Formation has good porosity in the lower part of the formation (20%) and very poor porosity in the upper part of the formation (3%).
- According to the saturation models, good movable hydrocarbon occurs in this interval (840-1320m), Qamchuqa Formation has 49m pay zone from 186m, the Sarmord Formation has a 36m pay zone from 113m, whereas 93m pay zone from 181m in Garagu Formation.

