


 Inglês (pdf)
 Artigo em XML
 Referências do artigo
 Enviar este artigo por email
 Citado por SciELO
  Citado por Google
  Similares em
SciELO
Similares em
SciELO  Similares em Google
 Permalink
1. Introduction
The Wufeng-Longmaxi black shale in the Sichuan Basinis the first shale gas reservoir to be commercially produced in China. By 2016, four national demonstration areas of marine shale gas production (the Weiyuan, Changning, Zhaotong, and Jiaoshiba shale gas plays) had beenestablished in Sichuan, Chongqing, and Yunnan.However, the heterogeneity of black shalesconcerning the total organic carbon(TOC) content and mineral composition, which control gas generation and reservoir quality, limits thepredictability of theshale gas 'sweet spot(Chen et al., 2015; Farrooqi et al., 2017). Therefore,it is necessary to evaluate the control of shale composition on storage capabilityand shale gas content.
In this study, 14samples from Well YS8 in the southern Sichuan Basin areanalyzed to investigate the geochemistry, petrology, and methane adsorption capacityof the shale by TOC testing, XRD analysis, and methane adsorption experiments. By discussing the relationship between shale composition and methane adsorption capacity, andshale gas content, we hope to identify the main factors that influence the storage capability and gas content of shale reservoirs,which can then be applied to other shale reservoirs with a similar preservation condition to that of the Longmaxi shale.
2. Geological setting
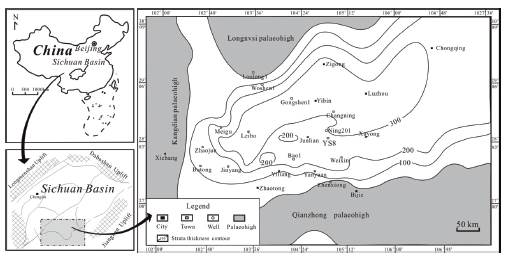
The study area is located in the Changning shale gas field in the southern Sichuan Basin (Figure 1). The Sichuan Basin is located on the northwestern Yangtze Plateand is the remnant of the lower Paleozoic Upper Yangtze cratonic basin(Lu et al., 2006; Karami et al., 2017). The Wufeng-Longmaxi formations were formed in a continental shelf sea(Zhang et al., 2012; Liang et al., 2016) during the Late Ordovician and early Silurian(Su et al., 2009; Sunny et al., 2018).The thickness of the strata varies from several meters to >300 m, with depocenters located in the southern and eastern parts of the basin(Guo et al.,2014; Nwankwo and Nkwankwoala, 2018). TheWufeng-Longmaxi shale is now mainly thermally over-mature (Liang et al.,2011).
3. Samples and methods
Fourteen shale core samples with burial depths ranging from 2382.43 to 2512.42m were selected for analysis from shale gas wellYS8 in the study area.The whole-rock mineral compositionswere determined by XRD analysis. The samples were crushed to powder, and XRD analyses were performedusing an X'Pert Pro X-ray diffractometer with a Cu anode at 40 kV, 20 mA, and 0.154 nm wavelength. The TOC was measured with a LECO CS-400 carbon-sulfur analyzer (combustion at temperatures of >800°C). Before analysis, carbonate from the samples wasremoved usinghydrochloric acid (1:1).
The methane adsorption capacity was investigated using a PCTProE & E high-pressure adsorption-desorption instrument. The samples were dried for 48 h at 110°Cand tested in asample cell with a temperature of 30°C (±0.2°C) and a pressure of 0-11MPa.The room temperature was 30°C and humiditywere 1%-2%. The methane adsorption capacity was calculated in m3/t (STP: 0°C, 101.325 kPa) using the material balance principle and the volumetric method (Krooss et al., 2002; Ali et al., 2018).
The shale gas content of core samples comprises the desorbed gas, residual gas, and lost gas. Desorbed gas and residual gas weremeasuredusingcanister desorption of the fresh cores. The lost gas was calculated using USBM methods.
4. Results
4.1 Gas content
The gas content of the 14 samples ranges from 1.49 to 3.43 m3/twith an average of 2.59 m3/t. Gas content varies with depth (Table 1),showing a decreasing upward trend. The shale samples with a gas content of>2.0 m3/t are found mainly between 2486.77 and 2512.42m depth.
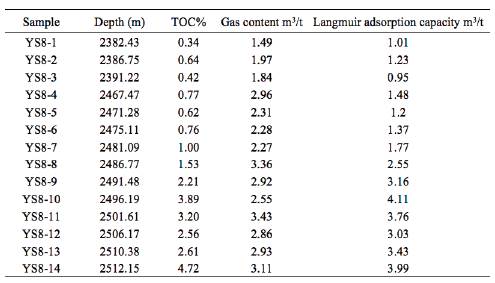
4.2 TOC content
The TOC content of the 14 samples ranges from 0.34% to 4.72% with an average of 1.81%. The maximum TOC(>2.0%) was obtained for sixshale sampleswith a burial depth between 2491.48 and 2512.15m(Table 1). The samples from depths of <2481m have TOC contents of<1.0%. A similarupward decreasingtrend in the TOC content of shalehas been reportedelsewhere in the Upper Yangtze region (e.g., Liang et al., 2011; Guo et al., 2014; Asghar et al., 2018).
4.3 Mineral composition
The XRD data show that the 14 black shale samples from well YS8 are dominated by carbonate, clay minerals, and quartz, with subordinate feldspar and pyrite (Table 2).
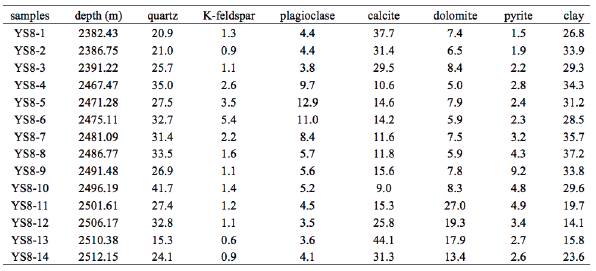
The carbonate mineral content ranges from 15.6% to 62.0%(average 32.2%), the clay mineral content ranges from 14.1% to37.2%(average 28.1%), and the quartz contentranges from 15.3% to 41.7%(average28.3%). The feldspar contentranges from 4.2% to16.4%(average 8.0%) and the pyrite content from 1.5% to 9.2%(average3.4%).
Mineral composition data show vertical variations. The three samples (YS8-1 to YS8-3) withthe minimum burial depths are characterized by high carbonate and quartz contents, moderate clay mineral contents, and low TOC contents (Hasan, 2018).The fourdeepest samples (YS8-11-YS8-14) contain high carbonate and TOC contents, and low clay contents. Theseven middle samples (YS8-4 to YS8-10) contain low carbonate, high clay, and moderate TOC contents.
Influence of Black Shale Composition on Methane Adsorption and Gas Content: Implications For Gas Storage in the Longmaxi Black Shal
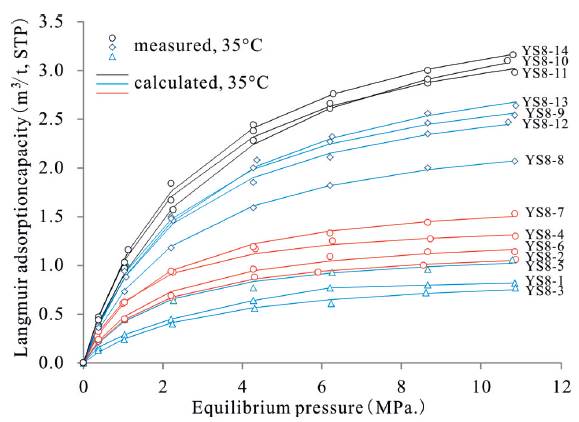
4.4 Methane adsorption
Methane adsorption isotherms are shown in Figure 2. The measured isotherms at different temperatures can be fitted well to the Langmuir function. The Langmuir maximum CH4 adsorption capacities range from 0.95 to 4.11 m3/t, with highercapabilities found for samples YS8-9 to YS8-14 (>3.1m3/t).The adsorption capacities of samples YS8-1 to YS8-7 are <1.8 m3/t.
5 Discussion
5.1 Controls on CH 4 adsorption in black shales
Figure 3 shows scatter plots of the Langmuir maximum CH4 adsorption (ΓL) versus shale composition (organic matter and minerals).ΓL shows astrong positive correlation with TOC.
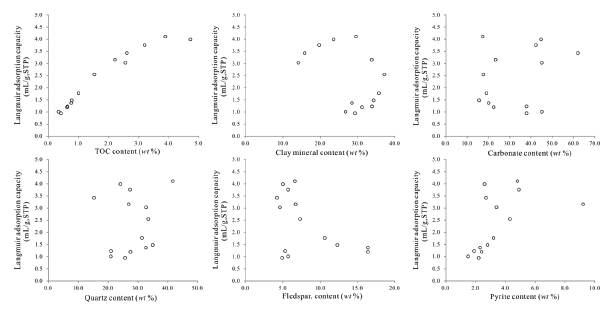
Equation (1) shows the result of linear regression between ΓL and TOC content, based on the experimental measurements of this study.

Where ΓL is in units of m3(CH4)/t rock and TOC is the total organic carbon content in units of wt%. The regression provides an empirical basis for estimatingthe Langmuir maximum CH4 adsorption capacity from TOC content in a shale reservoir. A similar correlation between gas sorption capacity and TOC content at 30°C and 6 MPa pressure has been observed in previous studies (Chalmers and Bustin, 2007a,b; Ross and Bustin, 2007, 2009; Zhang et al., 2012; Msarah and Alsier, 2018).
The strong correlation betweenrLand TOC content is due to the massive surface areaof organic matter for CH4 adsorption.Caoet al. (2015) reported thatkerogen of the Longmaxi shale in the Sichuan Basin hasa surface area of ~161.2m2/g, which is much higher than that of quartz and carbonate minerals.
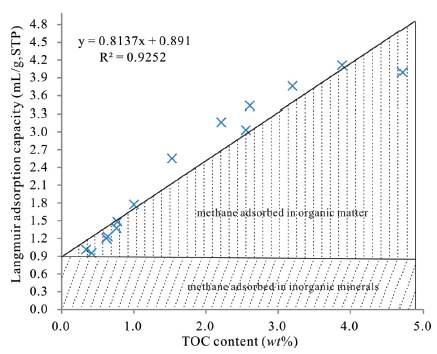
The proportion of CH4 adsorbedonto organic matter can be estimated by Equation (2).
Where Γorg is the Langmuir CH4 adsorbed onto organic matter and, Γrock , is the Langmuir CH4 adsorbed onto minerals. Mineral content is the total mineral content in wt%, TOC is the total organic carbon content in wt%, and Mineral content + TOC =100%.
In the model, we assume that i) CH4 is adsorbed onto two types of solid material (organic matter and minerals), and ii) Γrock remains constant, and the change of Γrock due to the variations in type and relative content of minerals is negligible compared with the influence of TOC content.
Base on Equation (2), when TOCis 0%all the CH4 is adsorbed onto inorganic mineral surfaces, with 0.891 m3of CH4 adsorbed for every ton of inorganic minerals. As TOC content increases and minerals content decreases, the proportion of CH4 absorbed onto organic matter increases, and when TOC is ~1.05%, ~50% of the CH4 is absorbed onto thesurface of organic matter (Figure 4).
5.2 Methane absorption capacity and shale gas content
Due to the high-to-over thermal maturity of organic matter and strong tectonic deformation, the gas content of the Longmaxi shalesis controlled by many factors, especially the preservation condition, natural matter abundance, and reservoir quality(e.g., Zou et al., 2010; Rahim et al., 2018).
In the shale samples from Well YS8,the preservation conditions and thermal evolution processes of organic matterare similar, thus enablingan evaluation of the influence of shale composition on shale gas content.
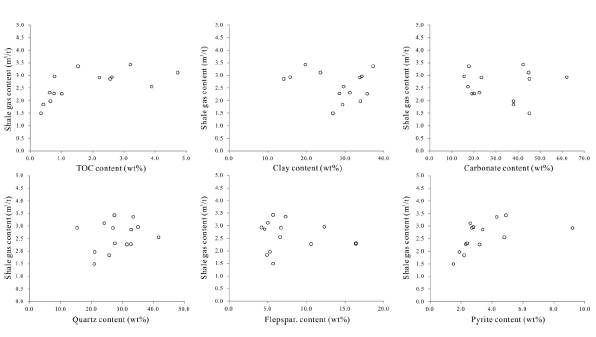
Scatter plots of gas content versus shale composition are shown in Figure 5. Poor relations are found between gas content versus mineral composition. Regular change of shale gas content with TOC content is observed. As TOC content increases, gas content first increases and then remains constant. This relationship indicates that organic matter is a significant controlon gas content when TOC content is <2.0%. When TOCis >2.0%, the adsorption surface area is sufficient, and other factors such as gas preservation condition may influence the amount of residue gas (Indan et al., 2018).A similar pattern isobtained when gas contentis plotted against pyrite content. Pyrite content is considered an indicator of redox conditionsand is usually found in larger concentrations when TOC content is high, which may explain the similar correlation of gas content versus pyrite and TOC contents.
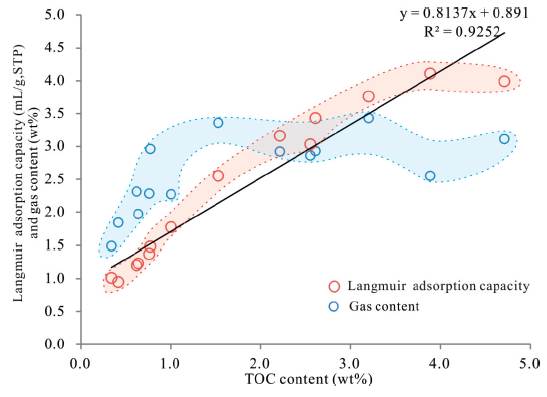
The scatter plots of TOC content versus gas content, and Langmuir adsorption capacity shows that when TOC is<2.0% the gas contents are higher than the Langmuir adsorption capacity of shale(Figure 6). Therefore, CH4 partially occurs as free gas within the macropores of the shale (Nwankwoala and Oborie, 2018; Nwankwoala and Ememu, 2018).When TOCis >2.0%, the gas contents are less than the Langmuir adsorption capacity of shale, indicating that CH4 tends to occur mainly as absorbed gas, as the surface area of organic matter is sufficient for gas absorption.
6. Conclusions
The Langmuir adsorption capacity of the Longmaxi shale is mainly a function of TOC content. The regression shows that when TOC content is 50% of the CH4 is adsorbed on to the organic matter. The mineral content has control on the adsorption capacity of the Longmaxi shales. Organic matter is a major control on gas content when TOC content is<2.0%.
When TOC is>2.0%, gas content remains constant and is a function of organic matter. Scatter plots of gas content and Langmuir adsorption capacity versus TOC content show that when TOC is<2.0%, CH4 occurs as both free and absorbed gas and that CH4 occurs mainly as absorbed gas when TOCis >2.0%.

