


 English (pdf)
 Article in xml format
 Article references
 Send this article by e-mail
 Cited by SciELO
  Cited by Google
  Similars in
SciELO
Similars in
SciELO  Similars in Google
 Permalink
1. Introduction
Since the initial description of effective stress for unsaturated soils, significant progress has been made in defining constitutive models. Most of these models are overviews of Cam clay or modified Cam clay (Alonso et al., 1990, 1999, 2013; Wheeler et al., 2003; Sheng et al., 2008). Currently, most studies attempt to link the soil microstructure to the overall soil behavior (Gens and Alonso, 1992; Alonso et al., 1999, 2010, 2013; Sanchez et al., 2005; Koliji et al., 2008; Pinyol et al., 2012; Della Vecchia et al., 2013). This trend is justified by the fact that according to Mitchell and Soga (2005), the mechanical properties of soil, including stress-deformation behavior, strength, compressibility and permeability, depend on its structure. For this reason, microstructural experimental studies have been an important tool for improving the research community's understanding of the relationship between the micro- and macroscopic behaviors of soils (Romero, 2013). Several studies (e.g., Alonso et al., 1999, 2010, 2013; Loret and Khalili, 2000; Della Vecchia et al., 2013; Romero, 2013) have followed this line of research.
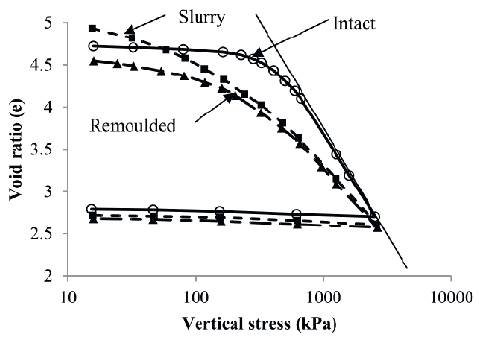
Based on constitutive laws and modeling, microstructural analysis distinguishes between variables that depend on the state of the soil, e.g., slurry, undisturbed or compacted. An example of the methodology used to distinguish between state-dependent and intrinsic soil properties is the concept of the intrinsic compression line, first presented by Burland (1990). Figure 1 shows the same soil in three different states: intact, slurry and remolded. The three curves, which represent the different soil states, tend to converge. A simple conclusion is that the initial structural state is destroyed in the presence of plastic strain and that at a certain point, no memory of the initial state remains, and the sample response is either equal or very similar.
Microstructural studies have been found to be useful in studying soils with limited bonding between particles. These studies are very useful for understanding the behavior of structured tropical soils, such as Brasília porous clay (Camapum de Carvalho and Mortari, 1994), Colombian volcanic ash (Lizcano et al., 2006) and San Juan alluvium (Zhang and Rothfuchs, 2004). These soils have a very complex structure; therefore, defining a constitutive model that extracts all the features of these materials is difficult.
In this work, we investigate the relationship between the mechanical behavior and microstructural features of Brasília clay via MIP tests. The MIP samples were in different states (slurry, undisturbed (natural) and compacted) with different void ratios following the consolidation curve. All MIP tests were modeled using the modified van Genuchten equation (Van Genutchen, 1980). Modeling analyses were conducted to better understand how mechanical loading affects the microstructural behavior. The results show that the mechanical loading erases the initial structure and leads to a convergent behavior.
Materials and Methods
The characteristics of Brasília porous clay are highlighted here. This clay contains aluminum and iron oxides, as well as bonding particles, which form clumps of particles (Figures 2 and 3), i.e., soil aggregates. These aggregates produce a bimodal soil structure that is evident in the pore size distribution (PSD) curve (Figure 4) and the soil-water retention curve (Figure 5). Figure 2 also shows how the aggregates (package) are subsequently destroyed by the dispersant and the ultrasound. Furthermore, this clay contains two dominant pore sizes (micro- and macropores), and the distance between pores is very large (approximately 3 orders of magnitude) compared to other soils. Finally, the micropores are not affected by loading or compaction processes (Figures 4 and 5).
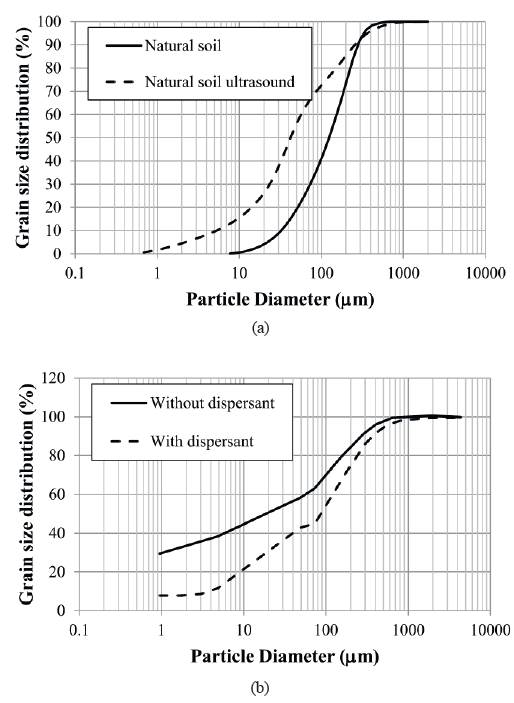
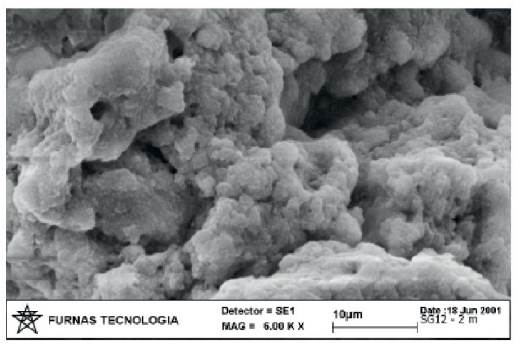
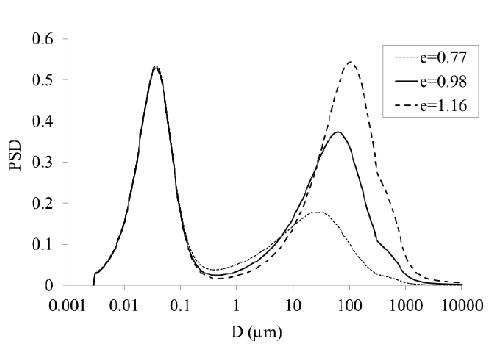
Figure 4 Pore size distribution and its evolution with loading for the Brasília porous clay (Silva, 2009).
All tests presented in this study were performed on soil samples obtained from the experimental field of the University of Brasília (UnB) (from a depth of 2 m) in Brasília City, DF, Brazil. The characteristics of this site have been investigated in detail by many researchers of the UnB geotechnical group. The first ~8 m of this site are characterized by a lateritic porous clay known as "Brasília porous clay" (Camapum de Carvalho and Mortari, 1994). This soil's high porosity and weak cementation between particles originate from two specific physicochemical geological processes: lixiviation and laterization (Camapum de Carvalho and Mortari, 1994). In general, the macrostructure of lateritic soils depends on the laterization and weathering processes (Miguel and Bonder, 2012).
This soil is characterized by a high percentage of clay aggregates, which are often described as "packages" of clay (Figure 3). Despite the clayey matrix, the soil's hydraulic behavior is similar to that of granular soil (k w =10- 5 m/s), and the air entrance value (AEV) of the water retention curve is approximately 10 kPa. Evidence of a granular nature can be seen in the grain size distribution curves measured using a laser granulometer, with and without ultrasound (Figure 2a), and in the hydrometer test results, with and without dispersant (Figure 2b). Furthermore, two other important structural components of the Brasília soil are its weak cementation (aluminum and iron oxides) and high porosity values (greater than 50% in the natural state), which give the soil a very high potential for volumetric collapse (Figure 6).
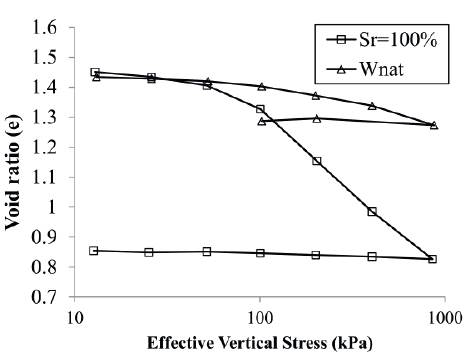
Figure 6 Consolidation curve for natural water content (wnat) and saturated (Sr=100%) conditions. Depth=2.0 m (Guimarães, 2002).
Another important characteristic of this tropical soil is the bimodal distribution of the PSD curve. Figure 4 illustrates a typical PSD curve for compacted Brasília porous clay and shows how it changes along a loading path. The same feature (i.e., bimodal distribution) is observed in the water retention curve presented in Figure 5. Despite the different states and void ratios, the micropores do not change (suction greater than 10.000 kPa), as observed in the PSD curves.
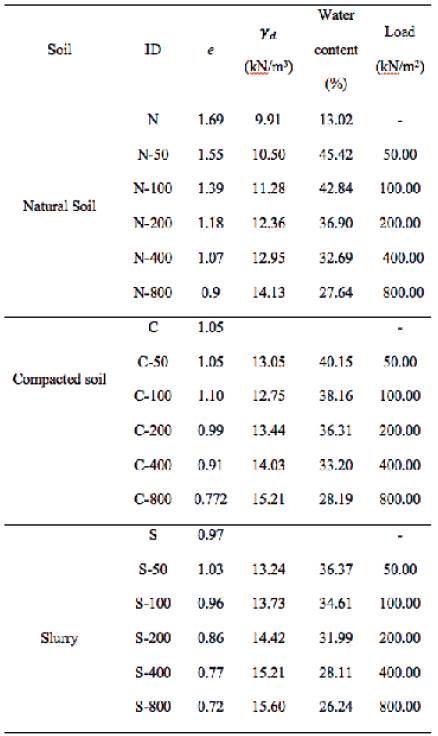
The soil samples present a liquid limit wL=36%, plastic limit wp=26% and specific solid weight Gs=2.74. Table 1 summarizes other geotechnical properties of the samples. Furthermore, the samples presented in Table 1 had different fabric consolidation states. The following nomenclature is used to describe the initial structure and consolidated states: natural soil (N) denotes an intact sample, compacted soil (C) represents soil compacted using the standard proctor procedure on the dry side (Figure 7), and slurry (S) denotes samples with water contents at the liquid limit (wL). The procedure used to produce slurry samples (S) is similar to the one used to obtain the consistency index of soils, i.e., the liquid limit and plastic limit. Table 1 also lists the effective vertical stresses applied during the consolidation tests; for instance, N-50 indicates a natural sample consolidated using a vertical effective stress equal to 50 kPa.
Results
The mercury intrusion porosimetry (MIP) technique has been used to easily and rapidly study structural PSDs in soils. Although MIP has certain limitations regarding the minimum and maximum measurable pore radii, it is one of the most commonly used techniques for describing the structure of soils and can provide insights into the link between the microstructure and the geotechnical properties of a soil (Romero, 2013).
Prior to MIP testing, all samples were freeze-dried via the lyophilization technique with liquid nitrogen. The drying process helps avoid strains on the samples. Next, to investigate how the consolidation process affects the PSD, the samples were subjected to consolidation. A sample was placed in the equipment and saturated, and then a target load was applied and maintained for 24 hours. Then, the sample was removed, and an MIP sample was prepared. A different sample was used for each vertical effective stress. Figure 8 presents a comparison between the MIP results obtained by the above procedure, as well as their consolidation curves. In general, the results obtained from this procedure follow the consolidation curve. The natural sample was very heterogeneous; consequently, differences exist between the MIP samples and the consolidation curves.
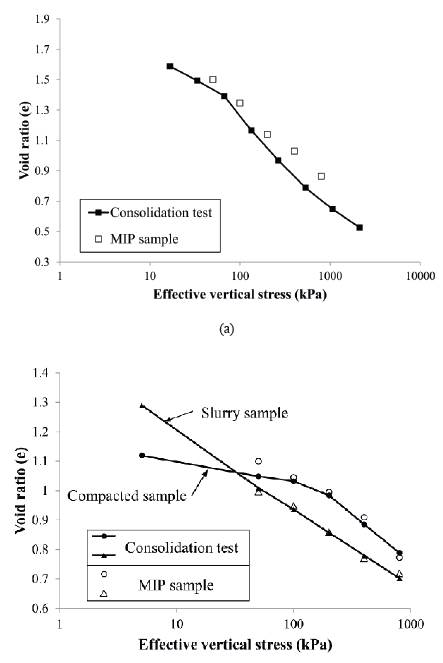
Figure 8 Comparison between MIP samples and the respective consolidation load points. (a) Natural sample; (b) slurry and compacted samples.
In general, the results verify the influences of the initial structure and changes during loading on the microscopic behavior of Brasília clay. Starting with the initial structural state, Figure 9 shows the PSDs for three different structures (natural, compacted and slurry). The vertical axis, e nw , represents the ratio between the volume of the voids filled with mercury and the volume of the solids. The PSD is defined as follows:
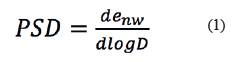
where D is the apparent pore diameter.
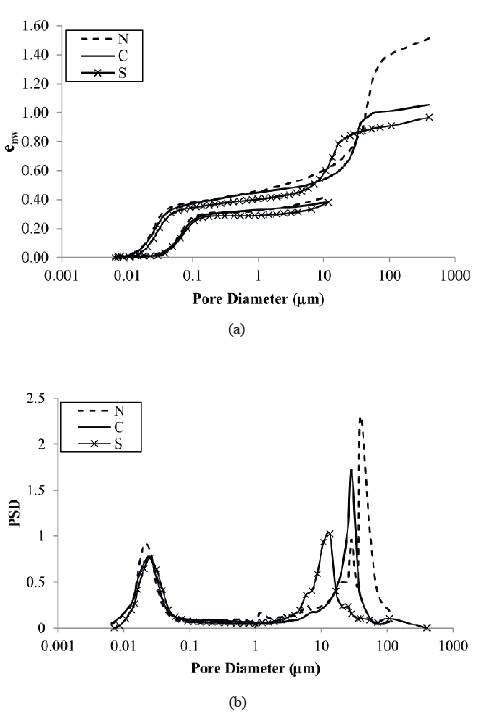
The range of diameters shown in the PSD is approximately 0.01 μm to 200 μm. Bimodal behavior is observed in this range, and the distance between dominantly micro- and macropores is nearly 3 orders of magnitude. This type of behavior has been observed in other studies, such as Almeida and Futai (2005) and Miguel and Bonder (2012), which present PSD curves for similar tropical soils.
Due to the limitations of MIP associated with pores smaller than 0.1 μm, Otálvaro (2013) performed both MIP and N2 adsorption tests on the same soil and concluded that the differences between the micropores determined via MIP and the N2 tests were not significant. The micropores are probably associated with aggregates (packages), as shown and discussed above (Figure 2). Interestingly, the samples with different initial structures (natural, compacted and slurry) featured similar pore distributions for diameters less than 1 μm. Furthermore, the extrusion curves were also very similar. Therefore, we conclude that the compaction and slurry processes are not able to affect the micropores inside the aggregates. Consequently, these micropores inside the aggregates influence the liquid and plastic limits.
The natural and compacted samples have very similar PSDs, and their main distinction is the final void ratio. According to their curves, these samples are similar for pore diameters smaller than 1 μm, and their distributions of micro-and macropores are similar. For >1μm pore diameters, certain differences exist, with the main difference being that between the inflection points in the slopes of the curves. Based on the comparison of these two specific curves with that of the slurry sample, the dominant macropore diameter in the slurry is obviously smaller than that in the other two. However, verifying the macropore range uniformity is not possible.
Figures 10, 11 and 12 illustrate the changes in the PSD during loading for different initial structures. The consolidation process similarly affects the PSD of natural, compacted and slurry samples. Overall, no noteworthy variations are present in the curves for pore diameters smaller than 0.5μm (micropores). Additionally, the extrusion curves are similar. The majority of differences are observed among the macropores.
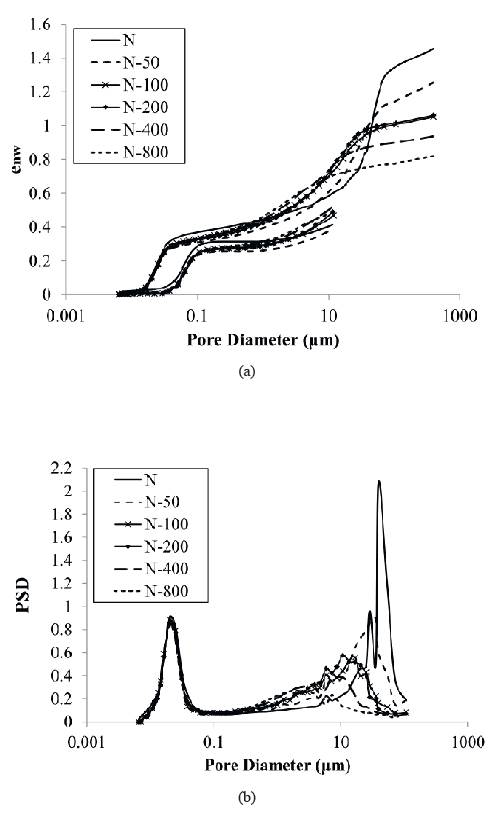
Figure 10 Brasília porous clay in the natural state. (a) Water relation; (b) pore size distribution.
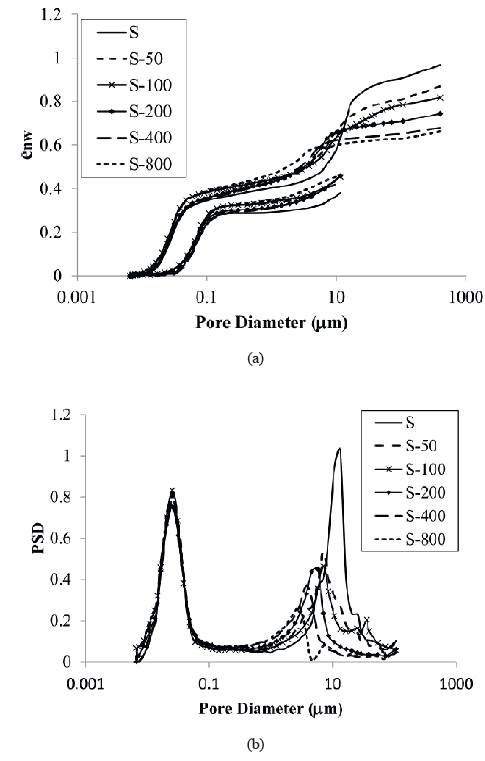
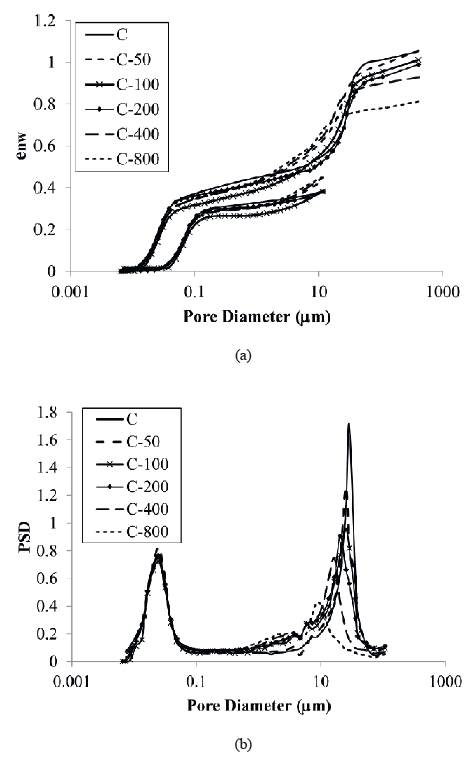
Figure 12 Brasília porous clay in the saturated compacted state. (a) Water relation; (b) pore size distribution.
For the natural sample, the macropores are quite uniform, and the dominant diameter is approximately 50 μm. The macropore distribution was less uniform during loading, indicated by the change in slope of the curves (Figure 10a) and the pore size density (Figure 10b). In addition, the dominant pore size peak is also reduced. Importantly, if the effective vertical stress was increased, the dominant diameter peak for macropores would disappear, i.e., the PSD would assume a unimodal behavior.
The MIP results for the slurry sample are presented in Figure 11. Most of the above observations also apply to the slurry sample. However, the distribution of >1 μm pore diameters is less uniform than that of the natural and compacted samples, and the distribution is even less uniform after the consolidation process (Figure 11b). The modeling results presented in the next section enable the evaluation of the uniformity of the curves using a model fitting parameter. Figure 11b shows that the pore size density of macropores decreases more slowly in the slurry than in the natural samples.
The behavior of the compacted sample (Figure 12) is similar to that of the other two states. However, the compacting process slowed the pore size changes, i.e., curves with loads less than 800 kPa are similar. This behavior agrees with the fact that a compacted sample is less deformable; consequently, it will experience fewer changes in structure. However, after the sample point C-800, the changes are noteworthy. Importantly, the position of C-400 is unexpected because it is located near sample C-200 and not directly in between C-800 and C-200 (Figure 12a). Finally, as in other samples, unimodal behavior is expected if larger loads are applied.
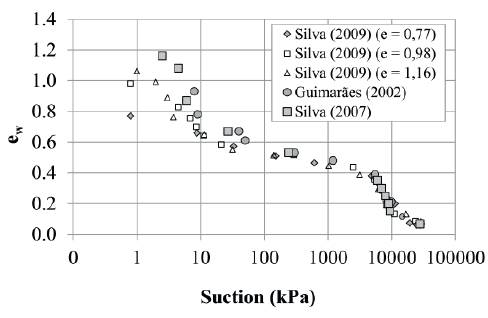
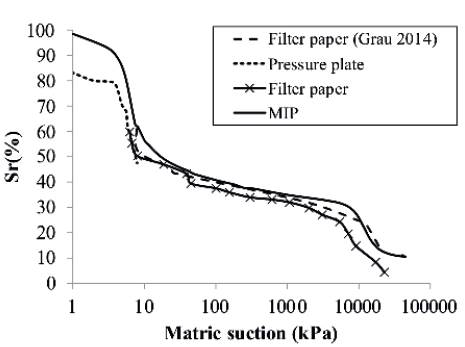
The results presented in Figures 11 and 12 agree with the water retention curves presented in Figure 5. The water retention curves for natural (Guimarães, 2002; Silva, 2007), compacted ((Silva, 2009) e=1.16), and compacted and loaded states ((Silva, 2009), e=0.98 and e=0.77, respectively) coincide at suction values larger than 1000 kPa because the water content links the micropores. Compaction and loading also affect the curves at values less than 100 kPa, a range associated with macropores. Figure 13 presents the water retention curves obtained via conventional methods (Prapaharan et al., 1991) and the MIP results. The water retention curve obtained via the MIP test was calculated using the procedure presented by Otálvaro et al. (2016). Although the curves do not coincide, the MIP results reflect the AEVs of the macro- and micropores.
Modeling and Discussion
Because a visual analysis of the effects of the consolidation process would be difficult, the results were modeled, and an analysis of fitting parameters was performed to better understand the effects of structural and consolidation state changes on the PSDs. The cumulative pore size curves were fitted using the equation proposed by Durner (1994). This equation is a modification of the Van Genutchen (1980) equation and is able to separate and identify the micro- and macrocomponents of the soil structure. Thus, the cumulative pore size curve was adjusted using Equation 2:
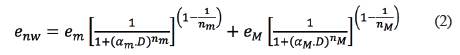
where the parameters with the subscript m are associated with micropores and the parameters with the subscript M are associated with macropores. The parameters e m and e M are the void ratios; α m and α M represent the dominant pore sizes; and n m and n M are the fitting parameters associated with pore size uniformity.
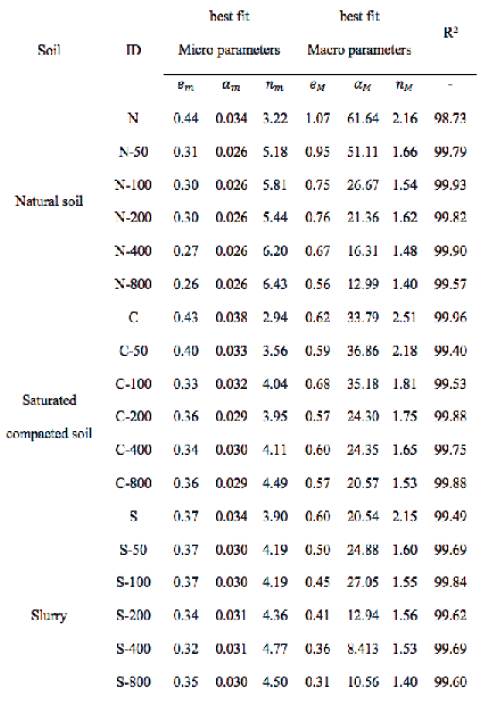
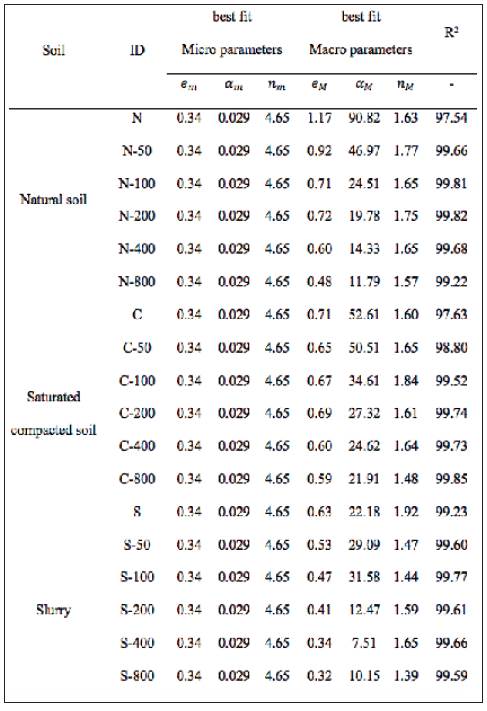
The fitting was done in two steps. First, all six parameters of Equation 2 were calculated using a standard procedure, which means that all possible variables were varied until the best fit was obtained. This step is called Full-Fit; the results are presented in Table 2. In the next step, only the fit parameters related to the macropores (e M α M and nM) were adjusted; the micropore parameters (em, α m and nm) remained constant and equal to the average of values obtained in the first step (Full-Fit) considering all the states and consolidation loads. Additionally, for this procedure, e M was computed by imposing the total void ratio. This step is referred to as Macro-Fit; the results are presented in Table 3. According to Tables 2 and 3, the R2 coefficient is greater than 97%, which means that the modeling process was able to mimic the main features of the data.
The micropore parameter α m , which is associated with the dominant pore size, exhibits little variation. This agrees with the observations in Figures 10, 11 and 12. Additionally, the experimental results lead to the conclusion that all micropore ranges are small. Consequently, the Macro-Fit results can be used to identify the main features of the data (R2>97%), demonstrating that the micropore parameters had little influence on the final results. Figure 14 presents the fit and experimental data for the smaller R2 value. Even this result exhibits a good agreement and allows us to conclude that the fit parameters are representative of the data.
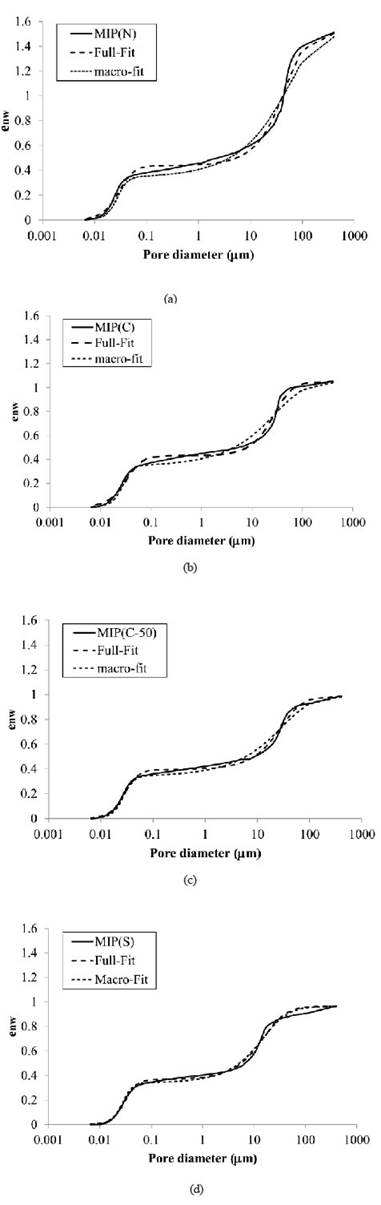
Figure 14 Water relation curves and adjustment with model validation. (a) N, (b) C, (c) C-50, and (d) S.
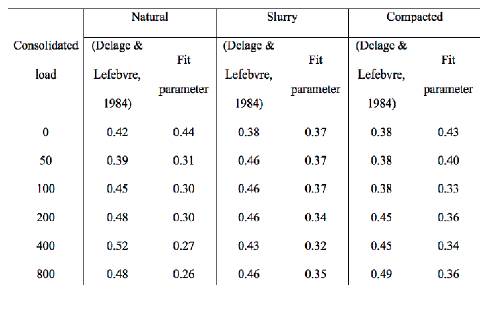
The macropore parameters evolved as expected. For example, the macropore void ratio (eM) decreased during loading. However, the fit parameters highlight another point. Table 4 presents the void ratio of the micropore curve (em). The suggestions of Alonso et al. (2013) and Delage and Lefebvre (1984) were used to determine the values of e m . In general, the values obtained by modeling were similar to but less than the extrusion curve values. The fit parameter e m is the value around the inflection point of the micropores, and the data show that the fit parameter is an alternative to determining the micro- and macropore void ratios.
The behavior of the PSD curves can be better analyzed by using the parameters presented in Table 2 and Table 3. Figures 15, 16 and 17 present variations in the parameters related to the dominant macropores (αM) and macropore uniformity (nM).
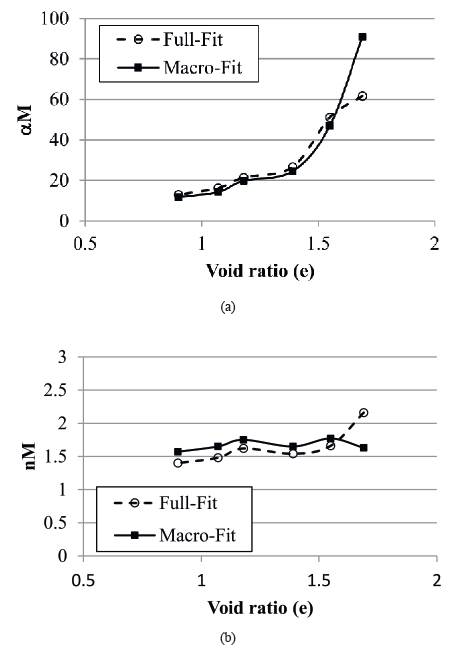
Figure 15 Variations in the fit parameters of the natural sample. (a) Dominant pore size (αM); (b) uniformity coefficient (nM).
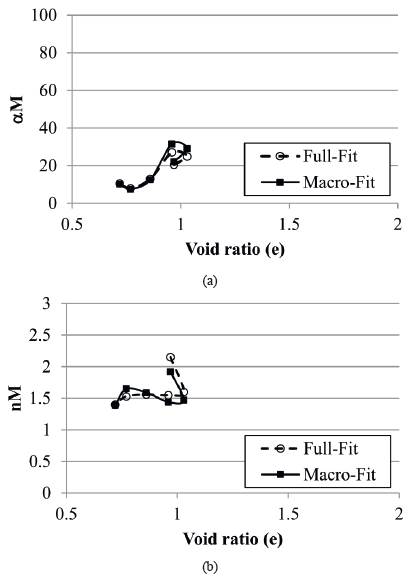
Figure 16 Variations in the fit parameters of the slurry sample. (a) Dominant pore size (αM); (b) uniformity coefficient (nM).
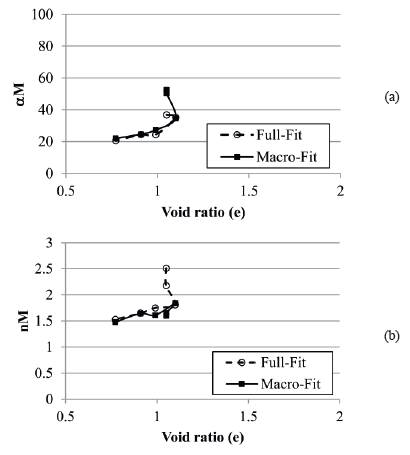
Figure 17 Variations in the fit parameters of the compacted sample. (a) Dominant size (α M ); (b) uniformity coefficient (nM). pore
For all samples, we observed that α M decreases during loading in the Full-Fit and Macro-Fit results (Figures 15a, 16a, and 17a). The slope of the α M decrease is steeper for the natural samples than for the compacted and slurry samples. This behavior can be attributed to the presence of weak cement bonding between aggregates that is not present in the slurry and compacted samples. After the bonds are destroyed, the natural samples behave similar to the other samples. Furthermore, despite the differences in initial structures, the values of α M approach zero, meaning that all samples exhibit unimodal behavior.
The macropore uniformity parameter (nM) did not change after the consolidation process. For the Macro-Fit procedure, the curves presented in Figures 15b, 16b, and 17b can be considered constant at approximately 1.5 (except for the highest void ratio). The compacted sample results of n M indicate that the samples become more uniform during the Full-Fit procedure. However, according to these results, the variation is small and can be regarded as a statistical phenomenon. The natural samples from N (e=1.69) to N-50 (e=1.55) change significantly (see Figure 18), indicating that the consolidation process does not affect the distribution of pores beyond a certain point. This result agrees with the above α M results, in which the natural sample begins to behave like the other samples when the weak bonds are destroyed.
Across all the samples with different structures and consolidation states, the value of n M was approximately 1.5. Therefore, this parameter is not related to the structure and is instead an intrinsic soil property associated with grain size, grain shape, interactions between mineral-clays and water, etc. The number of tests in this study is not sufficient to make our results conclusive, but our results can be considered the first insight into how MIP results can be used to identify non-structural properties.
Final Discussion and Conclusions
Here, we present the test results and discuss our conclusions:
For Brasília clay, the micropores (<0.1 μm in diameter) are not affected by consolidation, compaction, or processes used to produce a slurry.
The macropores are destroyed by the consolidation process, which can shift the sample from bimodal to unimodal distributions.
The initial structure is destroyed by the consolidation process, and after a certain degree of consolidation, the natural, compacted and slurry samples achieve very similar structures.
The third point can be linked with the macroscopic behavior of the soil. As discussed at the beginning of this paper, the mechanical properties of soils depend on the soil structure. However, if the consolidation process destroys the initial structure, samples with different initial structures tend to exhibit similar behaviors after the initial structure is destroyed. This conclusion agrees with the concept of the intrinsic consolidation line presented by Burland (1990) and can be observed in Figures 1 and 18 for two different soils.
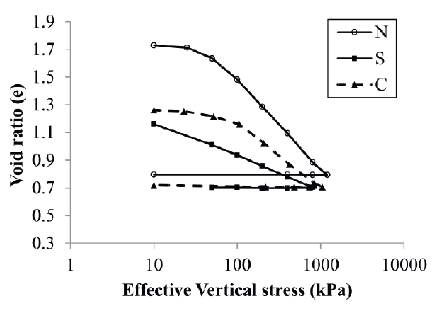
Figure 18 presents the consolidation curve for Brasília clay with different initial states (natural, compacted and slurry). Despite the different initial behaviors (which are related to the formation processes), all consolidated samples tend to exhibit similar behaviors, and the consolidation curves converge.
The conclusions presented in this study need to be verified for other soils because Brasília clay has very specific features, such as aggregations, a bimodal structure and the conservation of the micropore structure. However, the methodology used to investigate the effects of the consolidation process on PSD proved to be efficient. Additionally, the modeling process aided our understanding of the microstructural behavior and proved to be a very efficient tool for analyzing the PSD.

