


 Inglês (pdf)
 Artigo em XML
 Referências do artigo
 Enviar este artigo por email
 Citado por SciELO
  Citado por Google
  Similares em
SciELO
Similares em
SciELO  Similares em Google
 Permalink
1. Introduction
Debris flows can be mobilized by the occurrence of landslides, which are usually viscous, high-density debris flows (Iverson et al. 1997). Three main factors influence landslide triggered debris flows including the water source, loose materials and slope gradient (Zhou et al. 1991, Xu et al. 2014, Guo et al. 2016). When the water-soil ratio increases and channel gradient decreases, the water-soil ratio is the water flow discharge divided by the average depth of loose materials, and such debris flows will be gradually diluted into a diluted debris flow, which is a flow with a high concentration of sediment or a flash flood (Pierson and Costa 1987, Smith 1991, Svendsen et al. 2003); we call this the dilution process of a landslide triggered debris flow (Kang et al. 2004). Such a phenomenon is common in the southwestern mountainous area of China. For example, observed dilution events have been found in the Longxi River (drainage basin area of 78.79 km2 ) in Dujiangyan on August 13, 2013 (Qu et al. 2015), recently in Haizi Valley (drainage basin area of 103.6 km2 ) in the upstream area of the Jinsha River (Chen et al. 2015b), and Peilong Gully (drainage area of 86.1 km2 ) in the Sichuan-Tibet Highway area (Chen and Chen 2002).
While some studies have been performed on the dilution process and mechanism (Pierson 2005, Felix and Peakall 2006), there are still unsolved questions for the following 3 aspects: (1) some studies on the dilution index and its related factors have been completed (Pierson and Costa 1987, Dasgupta 2003, Pierson 2005), and the results indicate that the sediment content indexes can be used to distinguish between a debris flow and hyperconcentration flow or other type flows. In addition, their results also show that some related factors influence the debris flow dilution process including the sediment volume, flow depth and channel gradient. The dilution process and characteristics of volcanic debris flow were also studied and show that the duration of dilution processes is quite long and the sediment contents of hyperconcentration flow are very high, ranging from 40 to 60% (Pierson and Scott 1985, Lavigne 2004, Pierson 2005). The pattern of change in density, velocity and discharge was determined, and there are related equations for calculating the occurrence of a landslide triggered debris flow (Chen et al. 2007, Guo et al. 2015, Peng et al. 2015). However, there are few studies on the dilution process and characteristics based on the water source, loose materials and channel gradient, etc.; (2) Although the existence of dilution is well known (Pierson 2005, Pederson et al. 2015), there is still little understanding about the detailed predicted model on the dilution process due to absence of the investigation methods and typical cases; (3) The absence of a dilution process prediction model hampers quantitative study of the dilution process and mechanism. This also makes it difficult to implement the relevant mitigation measures for various types of debris flow. For example, the mitigation measures for viscous debris flows mainly include retaining, damming and diverting, whereas those for diluted debris flows mainly include diverting and dredging. In addition, the diversion channel gradient for a viscous debris flow is usually 5%-18%, and the channel shape is usually is trapezoidal or rectangular, whereas the diversion channel gradient for diluted debris flows is usually 3%-10%, and the channel shape is narrow and tall (Chen et al. 2015a).
To tackle the abovementioned issues, a case study is carried out based on a major dilution event that occurred in 1998 in the Guanba River, China. Section 2 describes the study area. Section 3 addresses the methodology. Section 4 analyzes the dilution characteristics and the process of dilution.
Section 5 develops the dilution process model based on the water-soil ratio, channel gradient and section 6 are the conclusions.
2. Study area
2.1 Location
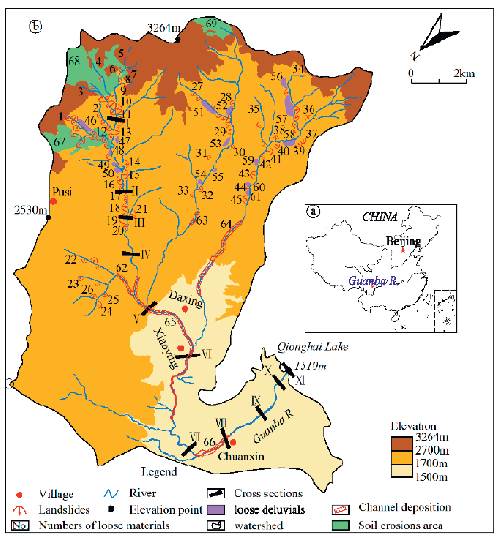
The Guanba River is on the southeastern margin of the Qinghai-Tibet Plateau (Fig. 1a), and its geographical coordinates are N: 27° 46' 21.3' ' ~27 27° 46' 21, E: 102°17' 8.24' ' ~10227° 46' 21. The Guanba River has an area of 137.24 km2, average channel gradient of 6.09%, length of 23 km, maximum altitude of 3264 m, minimum altitude of 1510 m and relative relief of 1754 m (Fig. 1b). The Guanba River gully is a V-shape gully with a mountain slope of 25-40°, and upstream channel gradient of 10.7~18.8%. This oscilating river developed in a midstream and downstream fault basin, there are many river islands in the waterway, and the channel gradient is 6.9~10.7%. There is a flat terrain from the downstream to the lake entrance, and the channel gradient is within 6.1-6.9%.
2.2. Landform conditions
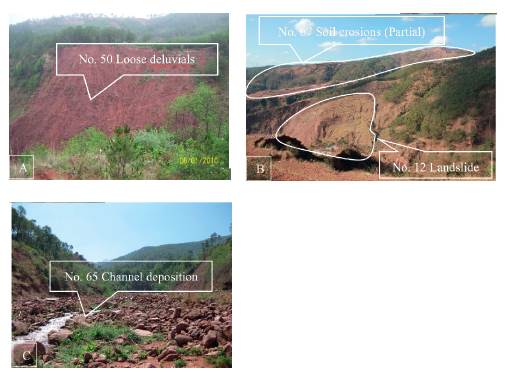
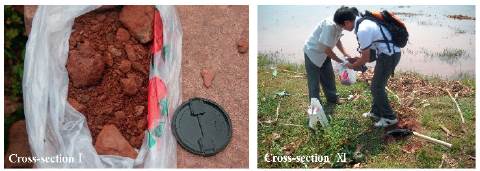
The Guanba River belongs to the Luoji Mountain system in the southeastern Qinghai-Tibet Plateau and is located on the east side of the south-north Anninghe Fault zone in Sichuan and Yun'nan and on the north end of the Zemuhe River-Xiaojiang River Fault zone. The tectonic stability of the Guanba River is mainly controlled by the Zemuhe River-Xiaojiang River Fault zone. The Guanba River top layer is mainly Quaternary gravel and sand, and the underlying bedrock is sand and mudstone of the Lower Cretaceous. Due to the influence of earthquakes and the wetting-drying cycle that occurs over a long period, the Guanba River basin is impacted by many landslides, slope erosions, loose deluvials and channel deposition. Fig. 1b shows a series of landslides numbered from 1 to 45. The landslide statistics for 1, 2, 3, 22, 23, 34 and 35 are the total number of landslides in the corresponding branch gully, and the serial numbers of the loose deluvials, channel deposition and slope erosions are 46-61, 62-66 and 67-69, respectively. Fig. 2 illustrates the 4 typical types of materials in debris flows. In accordance with the calculation results of the loose material volume, the total volume of loose materials in the Guanba River in 2010 was 392.06x10⁴ m3 (including 35.2% from the landslide source of 138.19x10⁴ m3, 44.1% from the slope erosion source volume of 172.67x10⁴ m3, 20.7% from the loose deluvial source volume of 38.41x10⁴ m3, and the channel deposition source volume of 42.80x10⁴ m3). According to the literature, the main material sources (landslide and slope erosion) before the occurrence of the debris flow in 1998 were very likely to be the main materials sources in the Guanba River in 2010 in terms of spatial distribution and volume (Wei et al. 2014, Chen et al. 2015c); this indicates that the loose material source volume before the occurrence of the debris flow in 1998 could be approximately substituted by the loose material source volume in 2010.
2.3 Hydrometeor
The Guanba River is within the basin of Qionghai Lake, which is in the low-latitude and high-altitude zones. Due to the alternating effects of the southwest monsoon and southeast inland drought monsoon, the basin of Qionghai Lake shows the characteristics of a mid-subtropical plateau mountain climate. It has a multi-year mean temperature of 16.9°C, maximum annual mean temperature of 17.2°C and minimum annual average temperature of 15.4°C. The precipitation is controlled by the southwest monsoon of the Indian Ocean, and it has a multi-year mean precipitation of 1013.5 mm, maximum annual precipitation of 1549.6 mm and minimum annual precipitation of 691.2 mm. Vegetation includes evergreen coniferous and broad-leaved forest, as well as evergreen & deciduous broad-leaved mixed forest. The soil in the basin of Qionghai Lake mainly includes purple soil, mountain red soil and mountain yellow soil. The debris flow in the area is characterized by high frequency, large scale and high sediment content, etc.
2.4 The debris flow events in Qionghai Lake basin
The Guanba River and Ezhang River have suffered from frequent debris flows at different degrees in the Qionghai Lake basin during 1996-2003. The debris flow outbreak in the Guanba River at 16:00 on July 6th, 1998, was the largest scale debris flow in the area in recent years, and this debris flow had a return period of 100 years or greater and a duration of more than 2 hours. Thousands of acres of farmland in the midstream river section of Daxing Village were flooded by the debris flow, and the loose solid matter carried by the debris flow led to the diversion of the downstream section of the Guanba River and advancement of 172 m of coastline on Qionghai Lake. The Ezhang River suffered from successive debris flows in 1996, 1997 and 1998, and these debris flows destroyed nearly a thousand acres of farmland; as of 2015, there were still more than 200 acres of farmland that could not be restored. These two points explain that the debris flow in the basin of Qionghai Lake has characteristics of large-scale. The debris flows that have occurred in the Guanba River, Ezhang River and Xiaoqing Gully in the basin of Qionghai Lake during 1950-2003 have transported a large volume of sediments, which are the results of gravitational erosion such as landslide or collapse into Qionghai Lake. The sediments transported by the debris flow decreased the area of Qionghai Lake by 11.6%, and the average water depth of Qionghai Lake was reduced from original 14.0 m to 10.95 m in 2003, which means that the debris flows in the Qionghai Lake basin are characterized by a high sediment content.
3. Methodology
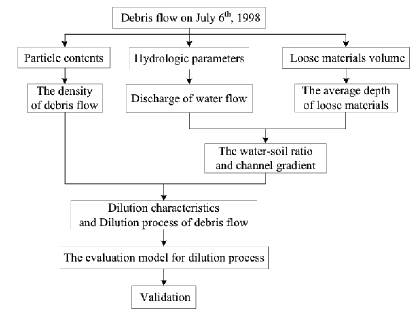
Using the debris flow in the Guanba River with a return period of 100 years, which occurred at 16:00 on July 6th, 1998 as an example, the intent in this study is to achieve the following using the workflow path shown in Fig. 3: to reveal the dilution characteristics and process of debris flow based on the factors of water sources, loose material and channel gradient. We establish the density evaluation model for the debris flow dilution process based on the water-soil ratio and channel gradient.
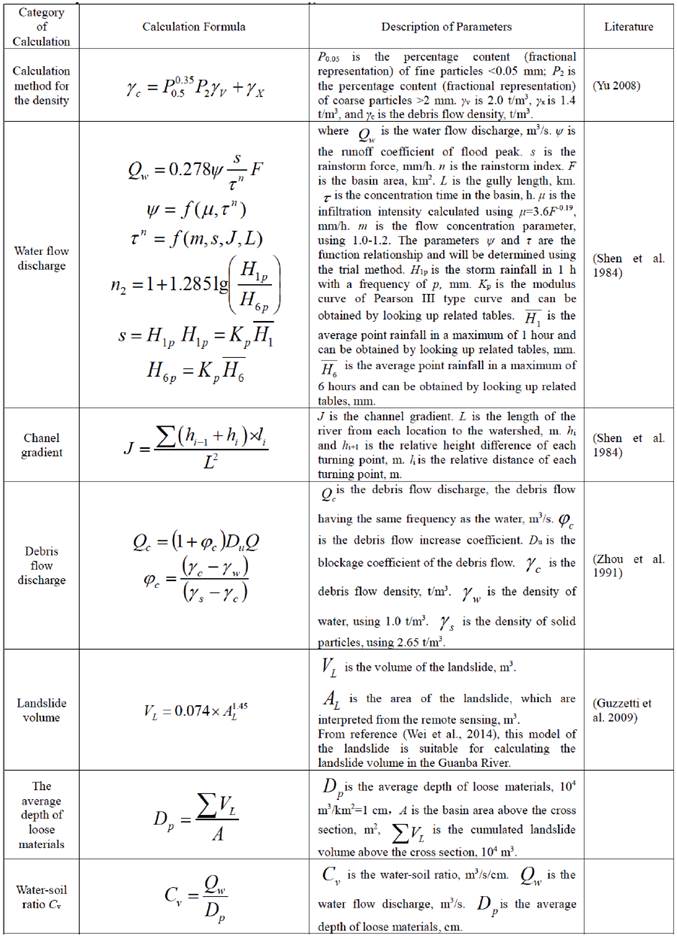
In this study, based on the typical debris flow that occurred in the Guanba River in 1998, empirical models are first used to calculate the density, water flow discharge, debris flow discharge, average depth of loose materials and channel gradient at 11 cross sections, and these methods are shown in Table 1. Second, we use the following rule to distinguish the types of fluid. The fluid with a density larger than 1.70 t/m3 and smaller than 2.30 t/m3 is the viscous debris flow, fluid with a density between 1.40-1.70 t/m3 is the diluted debris flow (Kang et al. 2004). Based on this rule, we further analyze the dilution characteristics and process of debris flow under the dynamic changes in water-soil ratio and channel gradient. Here, the water-soil ratio Cv is the water flow discharge divided by the average depth of loose materials. Third, we establish the density evaluation model for the debris flow dilution process based on the water-soil ratio and channel gradient using the Lorentz numerical simulation. Fourth, we use the three typical types of debris flows to verify the density evaluation model for the dilution process. These calculation methods are shown in Table 1.
Table 1 Calculation method for the density, water flow discharge, debris flow discharge, average depth of loose materials and channel gradient of the 1998 Guanba River debris flow.
4. Dilution characteristics and dilution process of the Guanba River debris flow
Through analysis of the dynamic process of parameters and particle size distribution curve for the debris flow at different locations, the following three dilution characteristics of the debris flow are obtained. (1) The key factors of the dilution process are the water flow discharge, average depth of loose materials and channel gradient. (2) The debris flow dilution process occurs after a significant increase in the water-soil ratio. (3) The proportion of fine particles increases after dilution of the debris flow. The change in particles size distributions is "narrowed" with the movement of the debris flow. Based on the density and dilution characteristics, the dilution process of the debris flow in the Guanba River can be divided into the upstream viscous debris flow section, midstream and downstream transitional debris flow section and downstream diluted debris flow section. With the key factors of water flow discharge, average depth of loose materials and channel gradient, we use the changes in energy and sediment content to explain the reason for the dilution process.
4.1 Dilution characteristics of the debris flow
4.1.1 The dilution process of the debris flow occurs after a significant increase in water-soil ratio
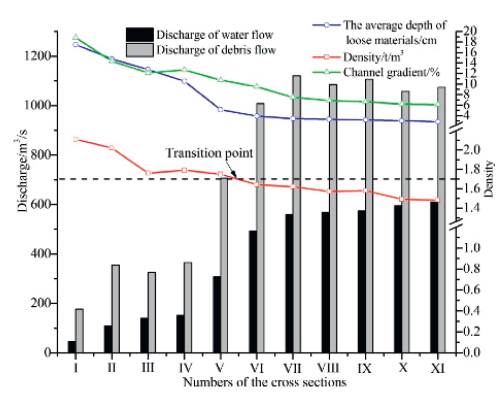
When the average depth of loose materials suddenly decreases, the water flow discharge increases suddenly and the channel gradient decreases. Thus, the viscous debris flow will not be immediately transformed into a diluted debris flow; instead, it will be transformed after continued movement over a very long distance, which indicates that the dilution process of viscous debris flow occurs after a significant increase in the water-soil ratio and channel gradient. In accordance with Fig. 5, the water flow discharge, debris flow discharge, average depth of loose materials and channel gradient will experience a significant change within section IV-V; in this situation, the rates of water flow discharge and debris flow discharge increase by up to 50% and 48%, respectively, the average depth of loose materials decreases by up to 51%, and the channel gradient decreases up to 13%. However, the fluid in section IV-V is still a viscous debris flow, because the water-soil ratio and channel gradient do not exceed the required critical value to transform the viscous debris flow into a diluted debris flow. In section V-VI, the average depth of loose materials and channel gradient continue to decrease as the water flow discharge increases, and the viscous debris flow will be changed into a diluted debris flow only after moving 4.93 km. This means the debris flow dilution process occurs after a significant increase in the water-soil ratio. According to the analysis, the water flow discharge, the average depth of loose materials and the channel gradient are the key factors that determine the debris flow dilution process.
4.1.2 The proportion offline particles is increased after the dilution of the debris flow, and the size distribution of particles is "narrowed" with the movement of the debris flow
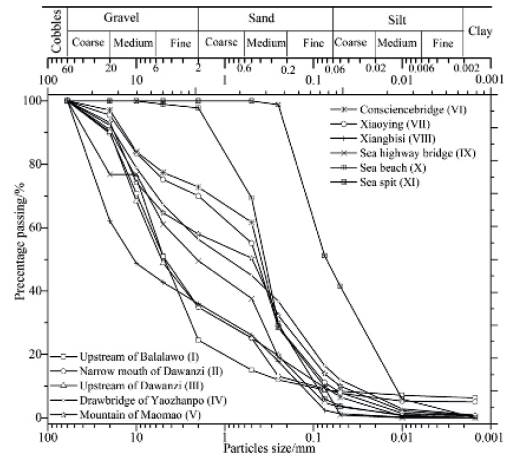
In accordance with Fig. 6, the proportion of fine particles is increased after dilution of the debris flow from cross-section V to cross section XI. As the debris flow moves from cross section I to cross section XI, the gravel content is gradually decreased from 75.5% to 0, the sand content is increased from 15.7% to 48.9%, the silt content is gradually increased from 2.5% to 51.1% and the clay content is gradually decreased from 6.3% to 0. The gravel and clay contents in the debris flow decrease gradually, whereas the sand and silt contents are gradually increased, which means that the proportion of fine particles is increased after dilution of the debris flow. In addition, the size distribution of particles in the debris flow is gradually "narrowed" from cross section I to cross section XI. The particle size distribution scope of cross section I includes gravel, sand, silt and clay; along with the movement of the debris flow, the particle size distribution scope of cross-section V includes fine gravel, sand, silt and clay, and the particle size distribution scope of cross section XI includes silt and fine sand without gravel and clay. The particle size distribution scope of soil samples from cross section I to cross section XI indicates that the particle size distribution of the debris flow fluid is gradually "narrowed".
The increase in the proportion of fine particles and “narrowed” particle size distribution after dilution of the debris flow is possible because of the following: the sediment concentration in the debris flow will be gradually decreased with the increase in water-soil ratio, decrease of channel gradient and reduction of clay particles in the fluid; the solid mass will be selectively transported, the quantity of coarse particles will be gradually reduced due to the sedimentation effect, fine particles (fine sand and silt) can be maintained in a suspended state, and more fine particles will enter the debris flow with the increase in turbulent fluctuation of the debris flow.
4.2 Dilution process of the Guanba River Debris flow
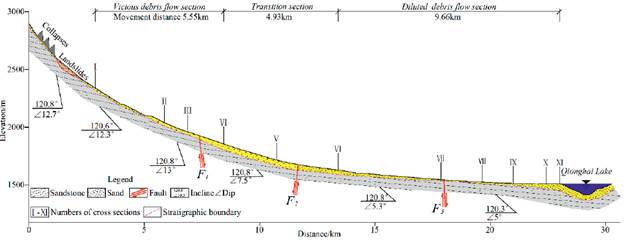
In accordance with the density and dilution characteristics of the 1998 debris flow, the debris flow dilution process is divided into three stages (Fig. 7): section I-IV is the viscous debris flow, IV-VI is the section in which the viscous debris flow is transformed into a diluted debris flow, and VI-XI is the diluted debris flow section (the fluid in the IX-XI section may be a hyperconcentration flow).
In accordance with the aforementioned section division results for the debris flow dilution process, we further analyze the influence of the water flow discharge, average depth of loose materials and channel gradient on the dilution process of the 1998 debris flow. To facilitate the analysis, we define the Guanba River upstream area as the I-IV section, midstream and downstream as the IV-VI section and downstream as the VI-XI section.
Under the influence of a smaller water-soil ratio and larger channel gradient (Fig. 8), the gentle decrease in density in the upstream viscous debris flow is mainly occurs for two reasons. On the one hand, the larger upstream channel gradient leads to a stronger erosional effect from the debris flow (erosion depth in some upstream sections was up to 1.2 m within 22 months from May 31, 2010, to March 30, 2012 (Fig. 9), which means that the upstream debris flow is more erosive under the influence of a larger channel gradient), and the debris flow obtains more solid masses through the stronger erosion effect; moreover, the water flow discharge provided by the upstream mountain is smaller, which maintains the debris flow density at a higher level all the time in the upstream area. On the other hand, the erosive ability of the debris flow will be reduced with the gradual decrease in the upstream channel gradient in the Guanba River, and the solid mass content in the debris flow is reduced, and thus, the debris flow density is gently decreased.
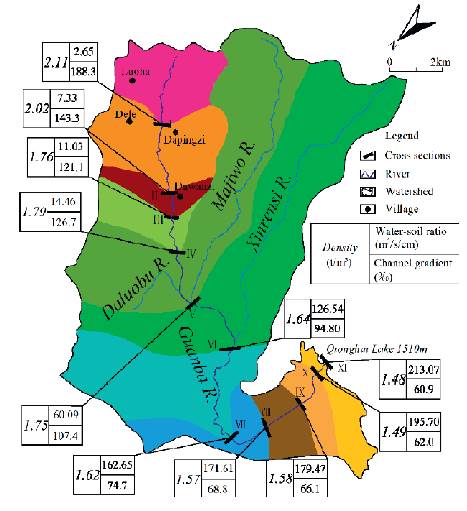
Figure 8 Plan for changes in density, water-soil ratio and channel gradient in the Guanba River (different colors indicate the basin area between cross sections).
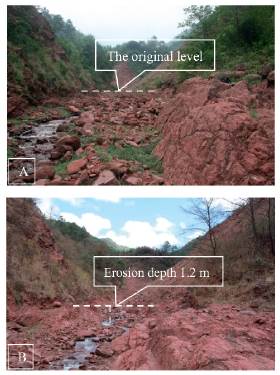
Figure 9 Change in erosive depth in the upstream area of the Guanba River. Photo A is from May 31st, 2010, and photo B is from April 30th, 2012.
Under the influence of a significant increase in the water-soil ratio and continued decrease in the channel gradient, the midstream and downstream viscous debris flow is gradually transformed into a diluted debris flow, and the sharp decrease in its density is mainly because of the following: the influence of gully broadening (20-80 m within the midstream and downstream gully width scope of the Guanba River) on the debris flow depth at section IV-VI is gradually decreased; the decrease in the debris flow depth and channel gradient reduces the drag force of the viscous debris flow, which weakens the erosive effect of the debris flow. When the debris flow cannot obtain more solid mass through the erosive effect, a large amount of low-density water flow from the Majiwo River and Xinrensi River dilutes the debris flow (Hallworth et al. 1993), which leads to a sharp decrease in the debris flow density and transforms the viscous debris flow into a diluted debris flow.
With a large amount of low-density water flow entering the diluted debris flow, the turbulent fluctuation effect of the downstream diluted debris flow will be further enhanced, and the diluted debris flow can carry more fine particles. With the increase of sand content in the debris flow, the diluted debris flow may be converted to a hyperconcentration flow.
5. The density evaluation model for the debris flow dilution process based on the water-soil ratio and channel gradient
Based on the debris flow particle content, we can use the density (calculated by the Yu equation) to divide the debris flow dilution process. However, there are thousands of debris flow gullies in southwest China since the Wenchuan earthquake (Tang et al. 2009). This method will require much time and money to obtain the particle content based on a field investigation and laboratory test. A rapid and reliable evaluation model for detecting the debris flow dilution process is urgently needed. Our density evaluation model is suitable for rapidly detecting the debris flow dilution process because the input data (water-soil ratio and channel gradient) of the model are easily obtained from the remote sensing data and topographic map of 1:10000 or 1:50000 scale (Zhou et al., 2016). The density evaluation model for the debris flow dilution process is established according to the following steps.
5.1 Correlation analysis of model parameters
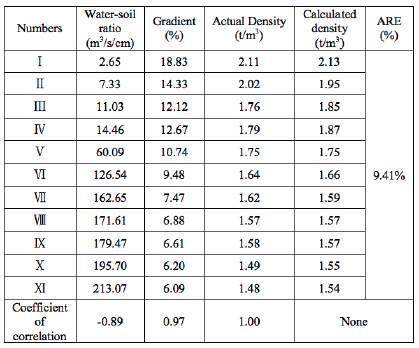
In accordance with the analysis results of the debris flow dilution process in the Guanba River in 1998, the water source (discharge), loose materials source (average depth of loose materials) and gradient (channel gradient) are the main factors that influence the debris flow dilution process. Based on the Pearson method, we have calculated the correlation coefficient of the density with the water-soil ratio and gradient. The fitting result shows that the density has a positive correlation with the gradient and the correlation coefficient is 0.97, and the density has a negative correlation with the water-soil ratio, and the correlation coefficient is -0.89 (Table 2). This indicates that the density correlates well with the gradient and water-soil ratio.
5.2 Model establishment
Based on the Pearson method, we know the density correlates well with the water-soil ratio and channel gradient. Therefore, we use a regression analysis to establish a density evaluation model based on the Lorenz equation.
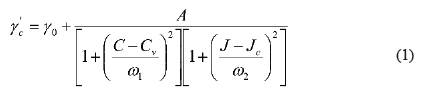

The input data of this model are the water-soil ratio and channel gradient, and the output result of this model is the debris flow density. The Lorentz equation is shown in equation (1).
In equation (1), γ c is the debris flow density, γ 0 is the minimum density using 1.4 t/m3, C is the water-soil ratio expressed in m3/s/cm, J is the channel gradient and J>0 expressed in %. A is the difference value between the maximum and minimum debris flow densities. C v is the water-soil ratio corresponding to the maximum debris flow density, and Jc is the channel gradient corresponding to the maximum debris flow density. ω 1 is the maximum water-soil ratio corresponding to 0.5 A, and ω 2 is the maximum gradient value corresponding to 0.5 A. In equation (3), γ c¡ is the density of the i cross-section, t/m3. γc is the average of the actual density, t/m3. n is the numbers of cross-sections.
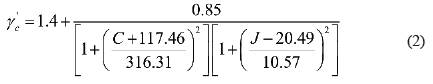
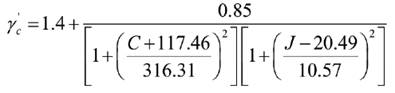
The density evaluation model for the debris flow dilution process is established based on the water-soil ratio and channel gradient using the Lorentz numerical simulation. Equation (2) is the specific expression of the density evaluation model. The correlation coefficient R2 of this equation is 0.94. In addition, Equation (3) of the Average Relative Error (ARE) is used to check the error in the calculation. From Table 2, we know the ARE value of the density evaluation model is low, which is 9.41%. Therefore, the density evaluation simulated by the Lorentz equation has high precision (Fig. 10).
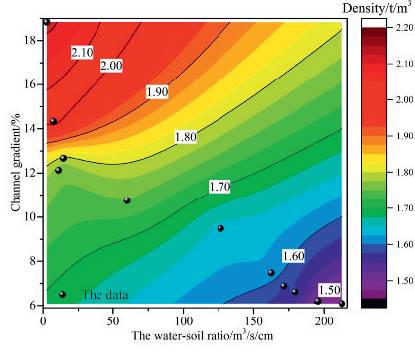
Figure 10 Fitting curve for the density evaluation model of the dilution process based on the channel gradient and water-soil ratio.
The scope of application is shown as follows. The range of water-soil ratio is 0-632.62 m3/s/cm, and the range of channel gradient is 0-21.14% in the density evaluation model for the debris flow dilution process. In addition, the density model cannot be used under the circumstances when all debris flow density and water-soil ratio values are obtained. Our model is a rapid model for detecting the debris flow dilution process in a large boundary using remote sensing interpretation and a geographical map.
In accordance with Fig. 10, the debris flow density in Guanba River will gradually decrease with the increase in water-soil ratio and decrease in channel gradient. The density evaluation model for the debris flow dilution process based on the water-soil ratio and channel gradient can better reflect the debris flow dilution process in the Guanba River in 1998. Under certain conditions, the density evaluation model can be used to predict the dilution process of landslide triggered debris flows in the southwestern mountainous area of China.
5.3 Verification of the density evaluation model for the debris flow dilution process
This study selects three typical cases to verify the density evaluation model, which is the Gaoqiao Gully debris flow on August 13, 2010, the Haizi Valley debris flow on August 11th, 1996, and the Aizi Valley debris flow on June 28th, 2012. The debris flow data for Gaoqiao Gully are obtained from a previous study (Zhang, 2014). The debris flow data for Haizi Valley and Aizi Valley are obtained from a previous study (Chen, 2016) and a related report of debris flow prevention. The water-soil ratios of the three debris flows are obtained from the remote sensing interpretation and geographical map. Based on Equation (2), the results of the debris flow dilution process are shown in Table 3.
Table 3 Calculation results for the debris flow dilution process in the Gaoxiao Gully, Haizi Valley and Aizi Valley.
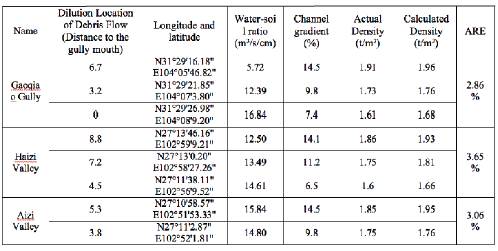
From Table 3, the viscous debris flow is gradually transformed into a diluted debris flow during movement with an increase in the water-soil ratio and gradual decrease in the channel gradient for all three debris flows. The dilution process of the three debris flows predicted by the density evaluation model is basically consistent with the actual dilution process. The ARE values of the density evaluation model in Gaoqiao Gully, Haizi Valley and Aizi Valley are 2.86%, 3.65% and 3.06%, respectively. This demonstrates that the density evaluation model is suitable for detecting the debris flow dilution process.
Here, the following should be noted that: the density evaluation model for the debris flow dilution process established according to the typical cases of debris flows in the Guanba River is only a preliminary work, and more debris flow dilution cases will be studied in the future work to further complete the density evaluation model for the prediction of the debris flow dilution process.
6. Conclusions
The key factors in the dilution process of landslide triggered debris flows are the water flow discharge, the average depth of loose materials and the channel gradient.
The debris flow that occurred in 1998 in the Guanba River had the following three dilution characteristics: 1) The debris flow dilution process occurs after a significant increase in the water-soil ratio. 2) The proportion of fine particles is increased after dilution of the debris flow. 3) The size distribution of particles is "narrowed". The characteristic that the debris flow dilution process occurs after a significant increase in the water-soil ratio is reflected by the fact that the viscous debris flow is completely transformed into a diluted debris flow only after moving for a distance of 4.93 km. The characteristic that the proportion of fine particles is increased after dilution of the debris flow is reflected by the fact that the proportion of fine particles in the debris flow will gradually increase with the increase in movement distance of the debris flow.
The debris flow dilution process in the Guanba River can be divided into the upstream viscous debris flow section, midstream and downstream transitional debris flow section and downstream diluted debris flow section. When the debris flow cannot obtain more solid masses through the erosion effect, the viscous debris flow transforms into a diluted debris flow because a large amount of low-density water flow from the Majiwo River and Xinrensi River dilutes the debris flow.
In accordance with the calculation result of the Pearson correlation coefficient method, the debris flow density in Guanba River in 1998 has a negative correlation with the water-soil ratio, and the correlation coefficient is -0.89; the density has a positive correlation with the channel gradient, and the correlation coefficient is 0.97.
The density evaluation model is established based on the water-soil ratio and channel gradient. This model can be expressed by the Lorentz equation, and the specific expression is the correlation coefficient is 0.94 and the ARE value is 9.41%. The density evaluation model can reflect the debris flow dilution process in that the debris flow density will decrease gradually with the increase in water-soil ratio and decrease in channel gradient.

