


 Inglês (pdf)
 Artigo em XML
 Referências do artigo
 Enviar este artigo por email
 Citado por SciELO
  Citado por Google
  Similares em
SciELO
Similares em
SciELO  Similares em Google
 Permalink
1. Introduction
Oil and gas explorations concentrate on fracture-developed zones. Tight sandstone reservoirs were regarded as their target areas. This type of reservoir comprises fractures with tectonic origins as their main seepage path and reservoir space (Bahrami et al., 2012; Abija & Nwankwoala 2018). The formation, development, and evolution of structural fractures are the critical issues and difficulties in oil and gas exploration and development, especially in the study of the characteristics and division of the formation stages of reservoir fractures. This research area has received considerable attention from domestic and foreign experts and scholars (Larsen et al., 2010; Nelson, 2001; Ali et al., 2018).
Mandelbrot, a French mathematician, proposed the fractal theory to study a complicated phenomenon with similar features and suggested making a quantitative description of fractal complexity with fractal dimension (Mandelbrot, 1982; Roslee, 2018). Scholz & Aviles (1985) employed the fractal theory in the fracture study for the first time, providing a new mean for quantitative characterization of spatial distribution and the geometry of fracture structure. Barton & Hsieh (1989) made systematic research on the statistical law of rupture and cracks on field outcrops, in which he found fractal features of fracture distribution. Zhang et al. (1996) reported that fractal dimension of tectonic fissures in an oil and gas reservoir reflects fracture development degrees of different lithological reservoirs. Both fractures and cracks are a geological phenomenon and that rocks generate cracks or displacement under stresses. A self-similar structure is formed in a particular scale range (Deng et al., 2006; Rahim et al., 2018). The fractal dimension of fault and core cracks could contribute a quantitative description of the spatial development of cracks in reservoirs. Recently, the fraction theory is widely applied in the geological field. It provides a new means for the quantitative characterization of spatial distribution and the geometry of fault structure, as well as a new idea for studying crack distribution in reservoirs (Takayuki et al., 1987; Usman et al., 2018).
The Yuanba area is located in the northeastern part of the Sichuan basin. Yuanba spans several administrative divisions of Bazhong City, as well as the counties of Cangxi, Tongjiang, and Nanjiang, among others. Remarkable breakthroughs in oil and gas exploration have been achieved through perennial geological research in the continental and marine strata. Commercial oil and gas were found in the wells of several series of gas-bearing formations, which includes: The Lei-3 section of the Leikoupo Formation; second, third, and fourth sections of the Xujiahe Formation; Zhenzhuchong and Daanzhai sections of the Ziliujing Formation; and the middle Jurassic Qianfoya Formation (Zeng et al., 2010; Nwankwoala & Oborie, 2018). The productive natural gas flow was obtained in multiple wells. Among these, the YL7 well in the third section of the Xujiahe Formation was tested and produced a gas flow of approximately 120.3x10⁴ m3/d. These discoveries indicate good prospects for gas exploration.
However, gas productivity varies dramatically from well to well. The daily gas output of a single well ranges from 0.1x10⁴ to 120x104 m3/d. In the study area, the reservoir has low porosity and low permeability with fracture-dominated productivity (Zeng & Li, 2005; Zeng et al., 2008; Jiang et al., 2004; Veeraragavan et al., 2018). Structural fractures have relative development due to the multi-stage tectonic deformation they undergo. Fractures in different stages dominate and regulate hydrocarbon migration and accumulation. The presence of these fractures is likewise an indispensable condition for high gas production (Zeng, 2008; Raj & Prabhakaran, 2018). Therefore, the author used the fractal theory to study fractal features of cracks in reservoirs of the Xujiahe Formation, in the Fault-Fold Belt of the central Yuanba area. The capacity dimension on the T3x fracture and fractal dimension (D) of cracks on 12 cores were also calculated. Fractal features of cracks were explored based on the relationship between core crack density of a cored well and the capacity dimension of cracks. The fractal characteristics of fractures and the threshold of the fractal dimension (D) of cracks in the study area were determined by combining the verification of oil and gas statistics of the study area. On this basis, crack distribution in the study area was predicted.
2 Geological characteristic
In regional tectonics, the Yuanba area is located in the transition region between the frontal zone of Micangshan and the gentle fold belt of the central Sichuan basin, which connects the Micangshan-Dabashan foreland fold-thrust belt on the north and the Longmenshan orogenic belt in the northwest (Guo, 2011; Lin et al., 2011; Len et al., 2018) (Fig. 1). Central Yuanba lies close to the subsurface of Yuanba, which connects the Jiulongshan structure in the north and the Tongnanba structure in the northwest.
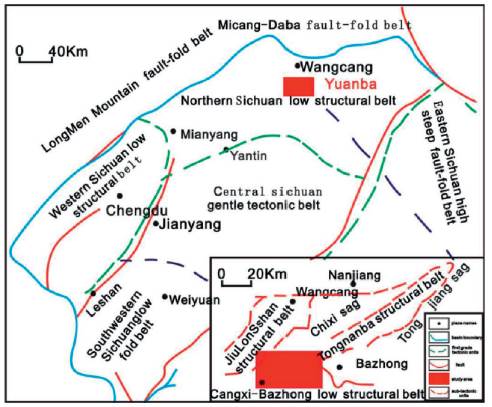
Proximity to the subsurface causes the structural features of the study area to have a close genetic relation to its nearby regional structure. The surrounding structural belts of the Longmenshan, Dabashan, and Micangshan exert varying degrees of influence on tectonic formation and evolution. Ever since the Indosinian movement, these surrounding structural belts have been reformed and superposed by multi-stage tectonic shifts. The study area and southern Qinling in the Yanshanian and Himalayan movement stages were intensively compressed from the North to the South. The structural movement patterns of the Himalayan scene inherit the characteristics of the Yanshanian stage. The study area was thrust continually from the North to the South. Thus, the structure was ultimately formed in the Late-Himalayan stage.
The principal structures of the study area can be divided into two second-order units: namely, low-flattish fold-thrust belts and syncline structural belts. The degree of the folds' development is weak, and the structural height is not extremely obvious when compared with that of the nearby Jiulongshan and Tongnanba structures (Roslee & Tongkul, 2018). The major faults developed are mostly of three sets: namely, the nearly SN thrust faults and the NW and NE compresso-shear faults, which are mainly middle-shallow and middle-small faults. Most faults can only break through the Xujiahe Formation because of the small scale and range. Finally, the faults disappear upward in the Zhenzhuchong formation and downward in the Leikoupo formation. The faults that appeared on the seismic reflection profiles are mainly high-angle reverse faults.
The reservoir lithology of the Xujiahe Formation in the central Yuanba area mainly consists of medium-grained lithic sandstone, quartz sandstone, and siltstone. Primarily, the sedimentary environment is a lake-deltaic sedimentary system, and the reservoir thickness is generally from 270 to 700m. The pore space of the reservoir is mainly composed of residual intergranular pore, intergranular dissolved pore, repitation, and fractures. The distribution of the reservoir porosity ranges from 0.61% to 6.88%, and the average value is 2.46%. Permeability distribution ranges from 0.0012x10⁻³ to 26.0086x10⁻³ μηι2 with an average value of 0.2944x10⁻³. The reservoir has the typical low porosity and low permeability characteristics of a tight sandstone reservoir (Nwankwo & Nwankwoala, 2018). The distribution of the middle and shallow hydrocarbon reservoir is controlled by a large area of overlapping, deltaic sand bodies. The development of fractures and faults provide favorable transportation conditions for hydrocarbon migration. Some sand bodies that are blocked by a reverse-fault offer a favorable trap condition for hydrocarbon enrichment and accumulation (Wali et al., 2018). Located in the gently low porosity and low permeability hydrocarbon reservoir, the multiphase petroleum system with a complicated oil-water-air relationship finally forms.
3 Self-similarity of middle Xujiahe Formation in Yuanba
Reservoirs of the Xujiahe Formation in the intermediate zone of the Fault-Fold Belt of the central Yuanba area are common pore-crack reservoirs. Crack development mainly determines Oil-gas enrichment and productivity. As viewed from the causes, fault, and fracture are different fractural structures of rocks with different cracking degrees and displacement under the effect of a uniform, tectonic stress field. They have self-similarity and meet the fractal theory.
3.1 Self-similarity of fault and fracture azimuth
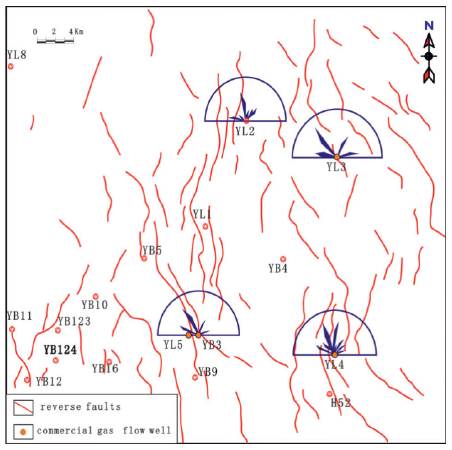
T3x reflects faults in the Xujiahe Formation of Fault-Fold Belt of the central Yuanba area, which mainly suffers tectonic extrusion of the Longmenshan tectonic zone, Dabashan fault zone, and Micangshan tectonic zone. It is dominated by the nearly SN-oriented and NNW-oriented fracture system, followed by the NE-oriented faults (Fig. 1).
In the northeast area of the study area, considering the effect of the Dabashan arcuate tectonic belt, the advantageous fault azimuth is in the NW direction. The advantageous azimuths of the YL3 and YB4 cracks in this region are in the NW direction and the NNW direction. The NW direction is likely to be the advantageous azimuth. Influenced by the Micangshan tectonic zone, the fault azimuth at the middle area is close to the SN and NNW direction. The advantageous azimuth is close to the SN direction, while the advantageous azimuths of the YL1 and YL5 cracks that are located in the middle zone are close to the SN direction (Fig. 2). To sum up, the central crack azimuth of each well conforms suitably to the fault strike surrounding the borehole, which indicates the apparent self-similarity between fault and fracture layout.
3.2 Self-similarity between fault and fracture combinations
According to the rock sound emission test and analysis on homogenization temperature and the tectonic structure of inclusion, the tectonic system in this area was mainly developed during the late Yanshan movement-early Himalayan movement. During the late Yanshan movement-early Himalayan tectonic movement, this area, together with the south Qinling Mountains, suffered sturdy extrusion from the North to the South and formed the NW-oriented and NE-oriented fracture system under the nearly SN-oriented tectonic extrusion. During the middle and late Himalayan tectonic movement, the roughly SN-oriented fault system was developed under the NE-oriented tectonic extrusion of the Dabashan arcuate tectonic belt, which reconstructed and superposed the previous NW-oriented and NE-oriented fault system. As a result, fault often represents the convergence of the NE-oriented fault tail and the SN-oriented fault, or the convergence of the NW-oriented fault tail and the SN-oriented fault. The result of the faults shows a distinctive zigzag structure. This result reflects the recombination and superposition of two tectonic movements. Moreover, the apparent X-shaped combination of faults could be seen along different fault extension directions.
Tectonic rupture and fault are material reflections at different stages of evolution from the same tectonic stress field. Tectonic fracture has evident direction. It often extends along the fault zone or forms a sharp angle with the fault zone. The discovery of the fracture azimuth of the Xujiahe Formation was introduced based on imaging logging data of YL5 and YL2. Fractures still extend mainly toward SN, NNW and NE directions, conforming to the fracture azimuth and height on the T3x reflection tectonic structure. Core observation found that there are mostly two types of fractures. One is shear cracks. They often have two groups, and most are perpendicular to bedding. They extend stably with apparent striations and have broad distributions, presenting an "X-shaped" conjugate (Fig. 3a). The other type of fracture is tension fissures. They are often indentation, manifested in tracing and reconstruction of the early two groups of shear cracks (Fig. 3b). The self-similarity between fault and core fracture demonstrates that fault combinations are the product of the typical stress field.

4. Fractal features of fault and core fracture
4.1 Principle and process of fractal dimension
According to the definition of Mandelbrot (1982), the fractal has a similar composition to the whole in some way. He applied fractal dimension (D) to make a quantitative description of fractal complexity. For quantitative research on the fractal problem, a fractal set could be defined as the following:
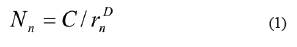
where N n is the number of objects with appointed features, r n is the radius of the particular object, D is the fractal dimension, and C is the proportional constant.
Calculate the natural logarithm to both sides of the equation (1), then,
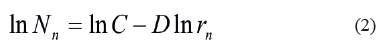
It can be seen from equation (2) that lnN n and lnr n are in a linear relationship, and D is the slope of the straight line. A physical model was designed according to the definition of fractal dimension and equation (1), and thereby D of each entrapment was calculated.
There are a lot of methods to calculate the distribution fractal of reservoir fault and fractures, such as the box covering method, the cantors' dust method, the box-counting method. In this paper, the fractal dimension of fault and fractures was calculated by using the box covering method, which is easy to be implemented on the computer. Elementary steps of this method include the following: use a square grid (side length=r) to cover the study area to make statistics on the number of squares covering fault zones and fractures (N n ). Next, change r gradually and make a statistic on corresponding N n . Establish a rectangular coordinate system taking lnrn as the x-axis and lnN n as the y-axis, in which a regression analysis of statistical data is implemented by using the least square method. If fault and fracture distribution in the study area have fractal features, lnrn and lnNn shall meet the linear relationship of D=lnNn/Δlnrn. At this moment, the slope of this regression line is D of each fault distribution. D of the fault and fracture is calculated similarly except for the different standard of r.
4.2 Fractal features of fault
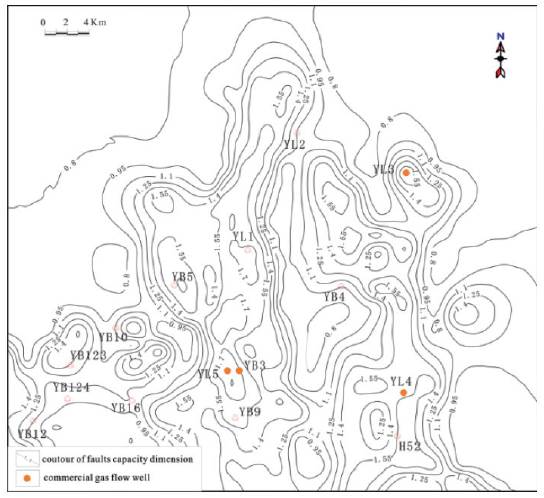
This paper carried out different-scale gridding and calculated corresponding fractal dimensions to the T3x fault tectonic map (fig. 3) of the Fault-Fold Belt of the central Yuanba area using the box covering method. In the T3x fault tectonic map, faults were vectorized with coredrawX6 and divided into 200 sub-regions (grids with an actual side length of 1.5km). The capacity dimension of each sub-region was calculated. Subsequently, the plane distribution map was drawn by using sufer 8.0.
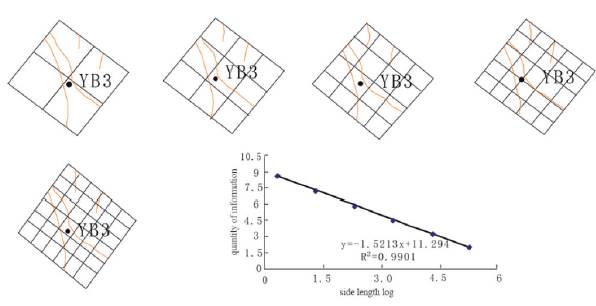
When calculating the fractal dimension of each sub-region, the sub-region was covered by same-scale (r=1, 0.8, 0.6, 0.4, 0.25 and 0.2km) gridding. D of this tectonic map was calculated as 1.5284, and the correlation coefficient was R =0.9901. When the minimum size of the box reaches the length of the smallest fault and the correlation coefficient is higher at 0.92, it can be viewed meeting requirements of statistical self-similarity. Therefore, T3x faults in the study area have fractal features. Figure 4 shows calculated results of the sub-region in which the YB3 well lies. The absolute value of the straight slope is 1.5213, which is the capacity dimension of faults in this sub-region. After the information dimension of all sub-regions is calculated, the horizontal distribution of the information dimension of T3x faults in the study area could be drawn (Fig. 5).
4.3 Fractal features of fractures
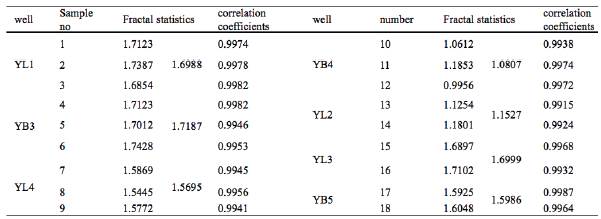
Fracture pictures were collected from drum scanning of 18 rock samples of the T3x in the study area. The side length of the square gridding was set as r=2, 3, 4, 5, 8, 10, 14, 16, 18, 20, 25 and 30mm. The physical number of squares containing fractures was counted. The other calculation process is same as the calculation of the fractal dimension of fault. Finally, the capacity dimension of fractures on each rock sample D h was calculated (Table 1). According to the calculated results, all correlation coefficients are higher than 0.98, indicating the desirable fractal feature of the general fracture distribution of the core samples. Therefore, distribution law of fractures could be predicted by using the fractal theory.
Due to different lengths of cores and different contributions of each section to the overall core density of the studied core segment, as well as the lack of a representative core section, the weighted average method was applied to calculate fracture density of the overall coring section of each well. In other words, the contribution of each rock sample to the fracture density of the whole well-section being studied was taken into account. This could be expressed as:
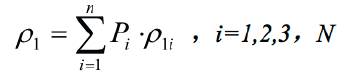
where P i =L i /L; P i is the weight of each rock sample; ρ 1 is the coring density of the whole well-section being studied; ρ 1i is the density of each rock sample; L is the total coring length of the whole study well-section, and Li is the length of each coring.
Coring fracture densities of YL2 and YL3 were calculated from the equation, 2.01 fractures/dm2, and 3.43 fractures/dm2, respectively.
4.4 Quantitative relationship between fault and fracture fractal features
Since fault and fracture have the same causes and self-similarity in term of fractal significance, fracture distribution could be predicted from fault distribution, as long as some internal quantitative relationship between them was discovered.
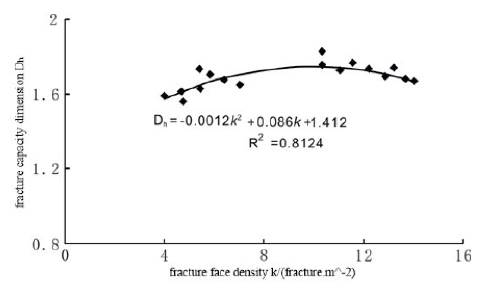
The capacity dimension of the fault on the sub-region and the capacity dimension of fractures on the coring section were connected through fracture density on the core. Finally, capacity dimension distribution of fault on the T3x tectonic map was transformed into the capacity dimension distribution of fractures. Through statistical fitting on coring data (Fig. 7), it was discovered that there is some relationship between the fracture density of different well-sections on the core and the capacity dimension of corresponding fractures:
where k is the fracture density on the core cross-section (fracture/dm2).
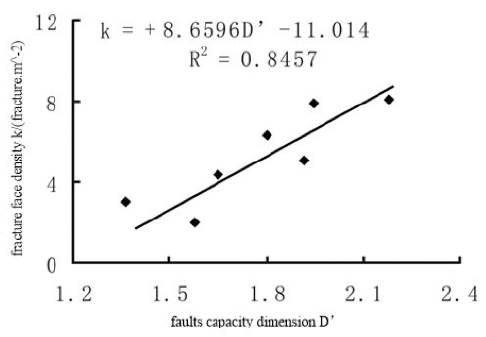
The fracture density of the coring well and the capacity dimension of the fault on the sub-region of this coring well have the following fitting relationship:
where D' is the capacity dimension of the fracture on the sub-region.
The capacity dimension of the macro fault can be transformed into the capacity dimension of the micro-fracture through equation (1) and (2). Fig. 8 shows the capacity dimension of the fracture transformed from that of fault. Comparing Fig. 6 and Fig. 8, the region with higher D of fracture has higher D of fracture, indicating the higher development of fractures; the vice versa.
5 Fractal dimension prediction and oil & gas productivity
According to the distribution of discovered commercial hydrocarbon flow and oil & gas wells, regions with higher than 1.45 fractal dimension of fault often have better oil & gas flows. The fractal dimension of regions predicted favorable for fracture development from the above two formulas shall be higher than 1.4. Hence, regions with D > 1.4 are defined as favorable regions for fracture development. Regions with 0.95 < D < 1.4 are defined relatively favorable regions for fracture development, and regions with D < 0.95 are unfavorable regions for fracture development.
In Fig. 8, regions with fracture development in the Xujiahe Formation of Yuanba mainly concentrate within the isoline region (D > 0.95) and surrounding areas. For example, well-areas like YB3, YL3 and YL4 show a higher than 1.5 fractal dimension of fracture and enjoy high productivity of commercial hydrocarbon flow. This agrees well with fracture prediction. Wells in the isoline region (D < 0.95), that is, predicted secondary fracture development regions, show no oil and gas. This confirms that the fractal theory is a useful technology to predict fracture development law.
6 Conclusions
Fault distribution and fracture distribution controlled by fault have remarkable self-similarity and fractal features. Therefore, studying fracture development law with the fractal theory is a reliable, technological idea and an effective approach.
The capacity dimension of the fault and fracture distributions (D) is calculated based on the fractal theory by using the box covering method, which could reflect the development degree of fault and fracture, as well as the complexity of the fracture system. As a result, D could be used as one quantitative parameter to study spatial development and the distribution characteristics of fractures.
According to the prediction results, fault distribution and fracture distribution have evident fractal features. Their correlation coefficients are all higher than 0.99. Higher D represents dense fracture development. Regions with D > 1.45 are favorable regions for fracture development and have reservoirs with good physical properties. These regions are favorable for oil and gas enrichment. Regions with 0.95 < D < 1.45 are relatively favorable for fracture development. Regions D < 0.95 are unfavorable regions for fracture development.

