Introduction
El Vapor gold deposit is located at the eastern flank of the Central Cordillera of Colombia. The area is dominated by deep cortical, strike-slip structures with a general strike N-S related to the El Nús fault, El Bagre fault and Palestina fault and with a crystalline basement characterized by multi-strained, Paleozoic and Neoproterozoic metamorphic rocks. This basement has been intruded by Jurassic and Meso-Cenozoic granitic bodies and has acted as a rigid block facing the marked strain produced by the Nazca Plate convergence, subduction from the west and the collision of the Western Cordillera and the Choco-Panama Block.
Although El Vapor gold zone has experienced craft mining for over forty years, no published information about its characteristics or its possible origin exists. This article describes for the first time the features of El Vapor gold deposit, specifically focusing on the hydrothermal conditions of its formation. A morphological, mineralogical and paragenetic description of quartz veins is presented, a detailed fluid inclusion study is reported, and an estimation of the conditions related to temperature, pressure, pH and oxygen fugacity (fO2) is performed. Also, the transport and deposit mechanisms of gold are discussed, to provide a better understanding of the formation conditions of this gold deposit.
Geological Setting
Three main geological units lie in the area of El Vapor district, (Fig 1): (i) San Lucas quartz-feldspathic gneisses (González, 2001), which contains lenses of amphibolite and marble and are Proterozoic (Feininger et al., 1972); (ii) Segovia batholith of Jurassic age (160 ± 7 M.a., K/Ar in hornblende, Feininger et al., 1972), consists of a diorite with textural and compositional variations of quartz diorite and locally hornblende gabbro; and finally, (iii) Segovia sedimentary rocks in the west of Segovia mainly composed of black shales interbedded with siltstones, sandstones and intraformational conglomerates, which in the north of the area have been dated between the upper Aptian and the lower Albian (Feininger et al., 1972) based on macro-fauna dating.
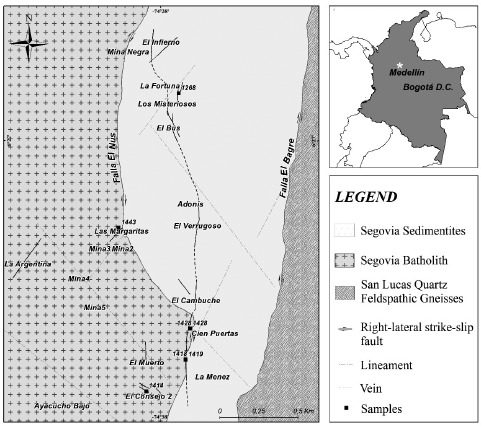
Figure 1 Geological map and location of El Vapor district, showing the location of the samples used in this study.
Vapor gold mineralization is mainly hosted on Segovia sedimentary rocks, but is also seen in the rocks of Segovia batholith, in proximity to distention zones and El Nús fault with NE strike, related to the conjugate movement of El Bagre and El Nús faults. Bedding planes in Segovia sedimentary rocks work as a first order controller of the arrangement of the mineralized zones.
The mineralized zones are veins and veinlets with thickness varying from one centimeter to two meters , and constitute a mineralization trend of approximately 2km long, with variable strikes between N20°E and N40°W, with dips between 45° and 85°. To the East of El Nús fault, gold mineralization is composed by sigmoidal, discontinuous, anastomosed and stockwork veins and veinlets with brecciated texture (Fig 2A and 2C). The veins have incipient zonation with thin alteration halos and fine-grained pyrite into the backrests. Towards the central part they have coarse-grained sulfides with aggregates of massive milky quartz and, at the center appear druses filled by quartz crystals with 'comb' texture. In some places, hydraulic breccias are observed, in which angular fragments of the host rock are cemented by aggregates of quartz with extensive surface.
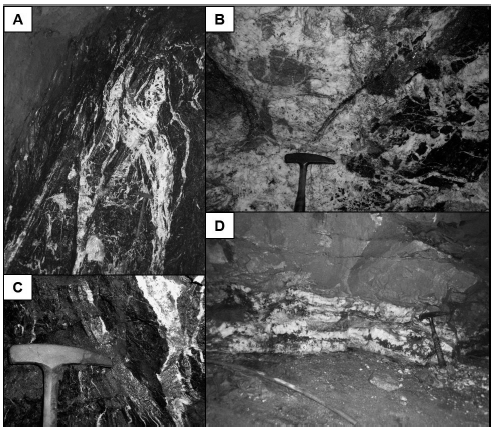
Figure 2 Photos showing different morphologies of quartz veins. A. Anastomosing veins in black shales, La Fortuna mine. B. Hydraulic breccia cemented by milky quartz, El Infierno mine. C. Discontinuous quartz veins with abundant sulfides, Los Misteriosos mine. D. Zoned vein, La Argentina mine.
To the East of El Nús fault, El Vapor veins and veinlets present a zonation (Fig 2D), with massive milky quartz in the borders, sulfides towards the middle zone and in some cases quartz druses with 'comb' texture in the center.
El Vapor veins and veinlets show narrow alteration halos (0.1m to 0.5m thick). This pervasive alteration is moderate to strong and suggests channeled fluid circulation. The alteration halos are composed of chlorite ± calcite ± epidote, in the diorites and quartz diorites of Segovia batholith and of muscovite ± illite + quartz + pyrite in the black shales of Segovia sedimentary rocks.
Mineralogy and paragenesis
El Vapor veins and veinlets are mainly composed of milky quartz and present sulfides in small proportions. Locally it is found concentrations of sulfides exceeding 15% or disseminated fine-grained pyrite at the veins borders.
Based on textural patterns, three different types of quartz could be identified in El Vapor district, (Fig 3):
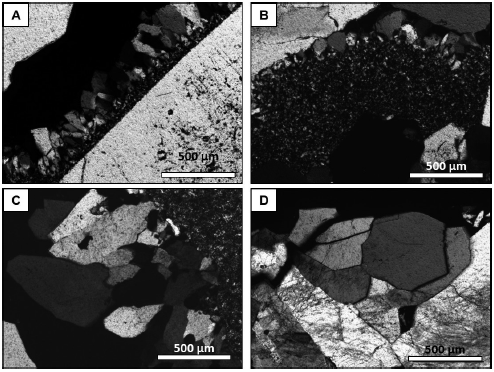
Figure 3 Microphotographs of different types of quartz in El Vapor district. A. Quartz crystals with 'comb' texture. B. An aggregate of small quartz crystals with mosaic composition filling spaces. C. and D. Subhedral to euhedral crystals with straight edges and massive texture.
Quartz with massive composition represents more than 80% of the modal content of El Vapor minerals. This texture is characterized by aggregates of sub to euhedral crystals with straight edges, ranging in size from 120μm to 5mm, and is associated with coarse-grained pyrite crystals. This texture tends to be located in the middle and central part of the mineralized zones at both sides of the El Nús fault.
Quartz with mosaic texture appears as small aggregates of single crystals (between 10μm and 70μm), with sutured edges and undulatory extinction. This quartz occurs (1) at the borders of mineralized zones, together with sericite/muscovite and fine-grained pyrite and (2) at the borders of the massive quartz crystals, or filling cavities and micro-cracks in coarse-grained pyrite crystals, that occur associated with galena, chalcopyrite, sphalerite and gold.
Quartz with 'comb' texture appears as sub to euhedral crystals with size varying from 200μm to 5cm. In exceptional cases, this texture is observed filling veinlets and druzy vugs into the central part of the mineralized zones, and in some cases is associated with pyrite and light colored sphalerite.
Based on mineralogical associations, textural differences and crosscutting relationships between different ore, gangue and alteration minerals it was possible to identify the following sequence of geological events:
(1) Hydrothermal alteration event in a early mineralization stage observed in the contact of quartz veins and host rocks, which has fine-grained pyrite, sericite, and quartz with mosaic texture and is associated with fine-grained calcite, chlorite and epidote.
(2) The first event of mineralization that presents quartz with massive texture, and coarse-grained pyrite with small inclusions of gold and is associated with galena, sphalerite, chalcopyrite and pyrrhotite.
(3) The second event of mineralization is characterized by quartz with mosaic texture, gold, galena, chalcopyrite, sphalerite, and proustite-pirargirita filling fractures and cracks.
(4) The third event of mineralization is comprised of quartz with 'comb' texture, pyrite and light colored sphalerite.
(5) Supergene alteration with covellite and bornite observed at the borders of chalcopyrite crystals.
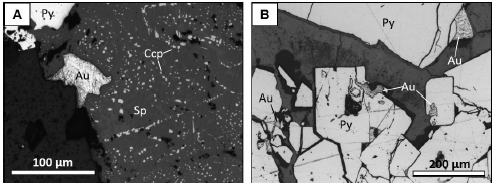
Gold is occurs: (1) as small inclusions (Between 7μm to 100μm hosted by coarse-grained pyrite crystals and sphalerite (Fig 4A); (2) As grains between massive quartz crystals; (3) As irregular, small to large (20μm - 250μm) grains into micro-fractures within coarse-grained pyrite crystals (Fig 4B), associated with galena and chalcopyrite crystals.
Methodology
Rock samples
Six (6) rock samples of mineralized milky quartz veins located in the west to the east of El Nús fault were chosen for this fluid inclusion research (Fig 1). These veins present subhedral to euhedral quartz crystals with massive texture and are representative samples of the first mineralization event. Due to the size of the quartz crystals with mosaic texture and their intense internal deformation, it was not possible to make microthermometric determinations of the second mineralization event.
From the selected rock samples, five (5), 1414, 1418, 1419, 1428(b) and 1443, are veins with concentrations of fine-granular pyrite to the borders and coarse-grained sulfides toward the middle. However, one sample, 1268, is on a hydraulic brecciated zone with 'cockade' texture where fragments of black shales from Segovia sedimentary rocks are cemented by crystals aggregates of massive texture.
Analytical techniques
The petrography and microthermometry were carried out in doubly polished thin sections with average thickness between 110μm and 130μm, using traditional methods (Goldstein, 2003) and prepared using representative fragments of rock samples. There were used the principles given by Roedder (1984) and the concept of FIA ('fluid inclusion assemblage'), defined by Goldstein (2003) as well as the number of phases, their proportions at ambient temperature (25°C) and the spectroscopic data for the recognition of primary pseudo-secondary and secondary inclusions.
A total of ninety-six (96) microthermometric measurements in fluid inclusions were performed using a Linkam THSM 600 stage coupled to an Olympus BX41 petrographic microscope. Two standards of synthetic inclusions from the University of Leoben Fluid Inclusions Laboratory, containing H2O (final ice melting temperature: 0°C; homogenization temperature: 374.1°C), and CO2 (CO2 melting temperature: -56.6°C) were used for calibration. The accuracy of the equipment was estimated at +1°C to the lowest temperature and +4.7°C for the highest. The microthermometric analyzes were carried out in the laboratories of the National University of Colombia, Bogotá.
Six phase changes in the fluid inclusions were recorded during cooling/heating routines: (1) CO2 melting temperature (TmCO2), (2) eutectic temperature (Te), (3) final ice melting temperature (TmIce), (4) clathrates melting temperature (TmClah), (5) CO2 homogenization temperature (ThCO2) and (6) total homogenization temperature (Th).
Raman spectroscopy analysis for the liquid and vapor phase were made using a Nicolet Almega equipment, which uses a laser with a wavelength of 532nm and is located at the Technological Development Center of the Colombian Emerald, Bogota. Some measurements were carried out at the laboratories of the United States Geological Survey (USGS) in Denver, Colorado. The identification of the molecular species contained in the fluid inclusions was conducted according to the offset of values determined to each gas and liquid (Burke, 2001; Frezzotti et al., 2012).
Fluid Inclusion Characteristics
Quartz crystals with massive texture are full of fluid inclusions, assembled into inclusion 'clusters' of variable sizes (5-40 μm) (Fig5A-B). There are also restricted fluid inclusions alignments at growth zones (Fig 5C) and into aligned trans-granular cracks which crosscut the crystals (Fig 5D). It was possible to establish the occurrence of four fluid inclusion types in El vapor district (Table 1).
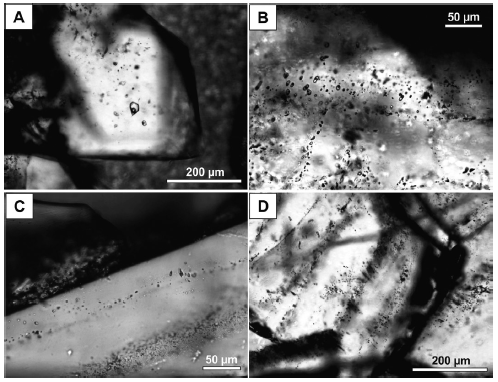
Figure 5 Fluid inclusions occurrences in quartz crystals from El Vapor district. A-B. Clusters of fluid inclusions. C. Small primary fluid inclusions along the edge of a quartz crystal. D. Multitude of small secondary fluid inclusions aligned along trans-granular cracks.
Type I inclusions: rare, primary fluid inclusions, restricted to growth zones in crystals. Although, some samples occur as isolated groups. They are two-phase and liquid-rich fluid inclusions (CO2 ± N2 ± CH4)V / (H2O)L, with a V/L ratio between 0.06 and 0.21. This type of inclusions present natural contours with ovoid and rounded shapes, with size between 4μm and 30μm (Fig 6A). These fluid inclusions coexist para-genetically with Type II inclusions.
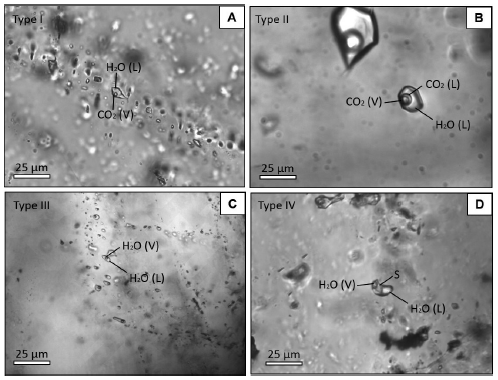
Figure 6 Fluid inclusions types in El Vapor district. A. Small Type I Inclusions, rock sample 1443. B. Multi-volatile, Type II inclusions, rock sample 1418. C. Small biphasic secondary type III inclusions, rock sample 1414. D. Type IV Inclusion with three-phase, rock sample 1414.
Type II inclusions: primary to pseudo-secondary inclusions, settled in alignments that do not touch the edges of the crystals and organized as randomly isolated groups in three-dimensional arrangements in quartz crystals. They are multi-volatile inclusions with three phases at ambient temperature (CO2 + N2 + CH4)V + (CO2 + H2O)L + (H2O)L and a V/L ratio between 0.05 and 0.38. They have different shapes, from regular with soft edges to irregular with jagged edges. Their size is between 5μm and 50μm (Fig 6B).
Type III Inclusions: They are the most abundant inclusions in the samples and are easily identified as secondary inclusions aligned in trans-granular cracks. They are two-phase, liquid-rich inclusions (H2OV/ H2OL), subdivided in IIIa and IIIb considering their temporality. Type IIIa inclusions have a V/L ratio between 0.08 and 0.18 percent, while in Type IIIb inclusions, the V/L ratio varies between 0.07 and 0.11. Their size is between 6μm and 26 μm and between 5μm and 16μm respectively. They have regular shapes, which appears as ovoids with smooth edges (Fig 6C).
Type IV Inclusions: They are rare in El Vapor district, they were observed filling fractures associated with type III inclusions, and classified as secondary inclusions. They have three phases at ambient temperature (H2OV + H2OL + S), the solid phase could not be identified by petrographic methods (Fig 6D). Their V/L ratio is between 0.04 and 0.11 and its size between 12μm and 13μm. They have regular, ovoid shapes with smooth contours.
Microthermometric Results
The microthermometric results are separately presented for each fluid inclusion type:
Type I fluid inclusions: These type of inclusions do not exhibit a melting temperature of solid CO2 and the first observed change of phase corresponds to the first melting temperature of ice (Te) ranging from -21°C and -22.8 °C.
Ice final melting temperature (TmIce) is between -2.8°C and -10.2°C. A vigorous shaking of the vapor bubble between +4.5°C and +8.8°C indicate melting temperature of clathrates (TmClath), revealing the presence of CO2, confirmed by Raman spectroscopy. It is also probable the existence of N2 ± CH4 in the vapor phase.
All Type I inclusions completely homogenize (Th) by the disappearance of the vapor phase (L+V→L) in a temperature range between 236.2°C and 349.8°C (Fig 7).
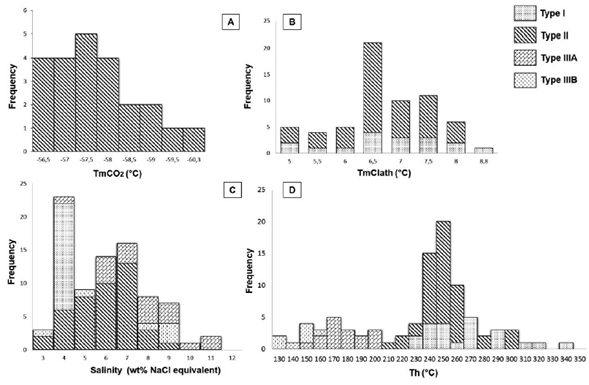
Figure 7 A. Type II inclusions CO2 melting temperatures. B. Type I and II fluid inclusions clathrates melting temperatures. C. Type I, II and III fluid inclusions salinities.
Type II fluid inclusions: Type II fluid inclusions present CO2 melting temperature (TmCO2) between -53.4°C and -60.3°C, with high concentration of data at -57.5°C (Fig 7).
The eutectic temperature of the aqueous subsystem (T ) varies between -18.9°C and -22.8°C. Ice final melting temperature (TmIce) is between -1.9°C and -8°C, with a greater data concentration from -4°C to -5°C and in -7°C.
Clathrate melting temperature occurs in almost all samples in one of the quadruple equilibrium points (Q2) from the system, this temperature varies between +5.1°C and +8.2°C, with a data concentration + 6.5°C. (Fig 7)
CO2 homogenization temperature, was observed between +23.6°C and +30.9°C with high data concentration at +30°C. Total homogenization temperature varies between 214°C and 306°C, with a high data concentration at 250°C (Fig 7).
Type III Fluid Inclusions: Eutectic temperature (Te) of Type IIIa fluid inclusions varies from 22.1°C to -22.8°C, and Type IIIb fluid inclusions eutectic temperature ranges from -10°C to -22.2°C. Ice final melting temperature (TmIce) varies between -2.8°C and 7.6°C for Type IIIa inclusions and from -2°C to and -6.4°C for Type IIIb. All observed inclusions of Type III homogenize to a supercritical fluid by vapor phase contraction. The homogenization temperature range for Type IIIa fluid inclusions is from 159°C to 209°C and from 131°C to 168°C for Type IIIb fluid inclusions (Fig 7).
Type IV Fluid Inclusions: The type IV inclusions are very few; cooling/ heating routines were only performed in three fluid inclusions. The first melting temperature of ice (Te), varied between -23.1 and -23.5°C. Ice final melting temperature (TmIce), is between -4.1 and -7.7°C. The maximum temperatures reached during microthermometric routines for type IV inclusions correspond to the homogenization of the fluid phases, between 131.5°C and 179.2°C (Fig 7). The disappearance of the solid phase was not observed.
Raman spectroscopy
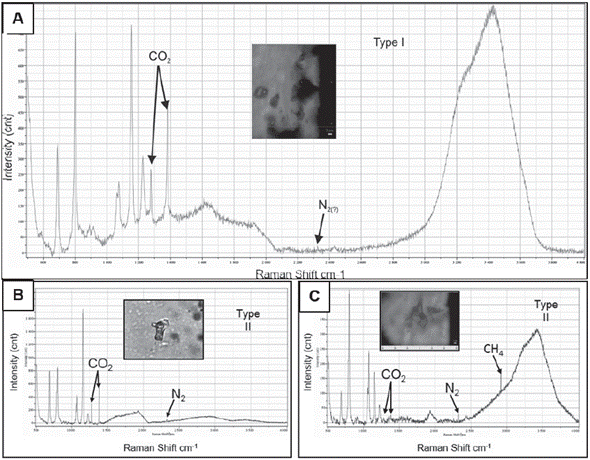
The Spectroscopic analysis in Type I inclusions confirms the presence of vapor CO2 and probably of N2, which was responsible for the gas hydrates (clathrates) formation in the cooling routines (Fig 8A). Type II inclusions analyses confirm the presence of N2 and CH4 and CO2 in the vapor phase (Fig 8B-C). The composition of these components in the vapor phase varies from 21 to 97 mol% for the CO2, 3 and 65 mol% for N2 and 0 to 14 mol% for CH4.
Composition of mineralizing fluids
The composition, salinity and molar volume of type I inclusions were modeled on the ICE program (Bakker, 1997; Bakker & Brown, 2003), using the state equation of Peng & Robinson (1976). The program uses an H2O+NaCl+CO2 system (based on TmClath, TmIce) and assumes an XCO2 = 1 composition for vapor step (According to the Raman spectroscopy analysis) as well as a volume estimation of each phase after melting of clathrates.
Due to the phase volumes were calculated based on two-dimensional data, there is an inherent error in the calculations (Bakker & Diamond, 2000). However, considering that Type I inclusions have a small vapor phase compared to the liquid phase, the effects of error propagation in the estimation of the composition are considered relatively low.
In addition to information obtained, Type I inclusions indicate a different salinity between 4.1 and 4.9 wt % NaCl equiv., a density between 0.82 and 0.93g/cc, a molar volume between 20.7 and 23.4cc/mol and molar fraction of CO2 from 0.029 to 0.039 and of Na+from=0.013-0.015.
Type II inclusions were modeled by the Q2 program (Bakker, 1997; Bakker & Brown, 2003) using the state equation of Peng and Robinson (1976). The program uses values TmClath and ThCO2, the composition of the non-aqueous phases from Raman spectroscopy analysis (XCO2= 0.96, XN2=0.04) and the proportion of the phases at ambient temperature. The results indicate that type II inclusions have salinities between 3.5 and 9.2wt % NaCl equiv (6.4 on average), a density between 0.75 and 0.97g/ cc (average 0.94), a molar volume between 19.3 and 37.9cc/mol (21 on average) and molar fraction of CO2 from 0.04 to 0.08, of N2 from 0.001 to 0.026 and of Na+ from 0.001to 0.0275.
Furthermore, the Type III inclusions characteristics were modeled by the BULK program from Fluids package (Bakker, 1997; Bakker & Brown, 2003), using empirical equations for salinity calculation, given by Bodnar (1993) and the state equation of Zhang & Frantz (1987) for estimating the amount of components in the inclusions. Salinity values for Type IIIa inclusions are between 4.6 and 11.2 wt % NaCl equiv and for IIIb inclusion are between 3.4 and 9.7 wt % NaCl equiv. The density values range between 1.07 and 1.08g/cc and between 1.02 and 1.07g/cc respectively. The molar volume for Type IIIa inclusions is in a range of 17.4 to 17.8cc/mol, and for Type IIIb inclusions are from 17.5 to 17.8cc/mol.
Discussion and Interpretation of microthermometric data
Hydrothermal fluid composition
Microthermometric analysis for all types of fluid inclusions in El Vapor district indicated the hydrothermal fluids presents a relatively simple composition, containing a mixture of NaCl and KCl as the dissolved salts in the aqueous system and different proportions of CO2, CH4 and N2 in the vapor phase for Type I and Type II fluid inclusions, indicated by the CO2 melting temperatures and confirmed by Raman spectroscopic analysis.
These fluids presents low to moderate salinity and are similar to ore fluids of orogenic gold deposits (Groves et al., 1998; Wilkinson, 2001; Bodnar et al., 2014).
Immiscibility or fluid mixtures
The occurrence of aqueous fluid inclusions (Type I) and aqueous-carbonic fluid inclusions (Type II) para-genetically coexisting in the same rock sample in El Vapor district can be explained by three main processes (Zoheir et al., 2008):
Deformation post trapping ('stretching', 'necking down') producing partial loss of water, with an enrichment of some inclusions with volatiles (CO2, CH4, N2, etc.) and the aqueous phase trapping in liquid-rich fluid inclusions.
Phase separation (Immiscibility), followed by a trapping process of carbonic components (CO2+CH4) and liquidrich fluid inclusions simultaneously (Ramboz et al., 1982, Diamond, 1990).
Mixing of two fluids from different sources, followed by trapping of representative fluid inclusions of each fluid and/or trapping of various inclusions at different times.
Although there are local evidences of a post trapping modification process by fragile deformation in some of the analyzed rock samples in El Vapor, especially in Type II inclusions with a bigger size, the narrow range of homogenization temperatures obtained for fluid inclusions with similar phase relationships allows us to interpret that the trapping modification process can be ruled out in most of the cases.
In practical terms, an immiscibility or effervescence process can be explained due to the coexistence of inclusions with a variable degree of filling with opposite homogenization (L and V) in the same temperature range. Although in El Vapor, there were found locally some fluid inclusions with variable phase proportions (V/L ratios between 0.06 and 0.21 for type I and between 0.05 to 0.38 for type II), different densities and different CO2 proportions, the nonexistence of inclusions with contrasting homogenization, suggests that an immiscibility process is not a responsible for the formation of inclusions.
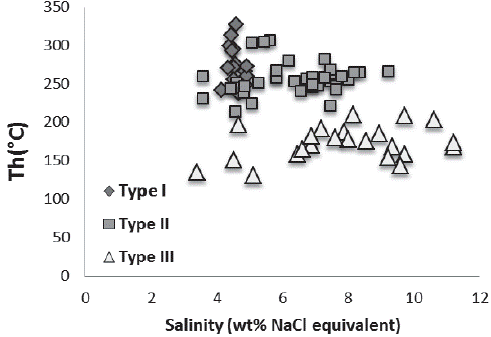
Finally, the presence of coexisting Type I and Type II inclusions, can be explained by an isothermal fluid mixture process based on the fact that two-phase, liquid-rich fluid inclusions (Type I) and primary inclusions in all cases have a restricted salinity range (4.1 and 4.9 wt between NaCl equiv %). While Type II inclusions suggest, in a similar range of trapping temperatures (Th), a bigger variability in the calculated salinity (3.5 to 9.2wt % NaCl equiv) (Fig 9).
Trapping temperature and pressure
Homogenization temperatures represents minimum trapping temperatures, except when there is evidence of well-supported immiscibility (Roedder & Bodnar, 1980). In El Vapor district due to the lack of conclusive evidences for an immiscibility process, the calculated P-T conditions represents a minimum value.
The calculated isochores for type II inclusions using the 'isochore' program (Bakker, 1997; Bakker & Brown, 2003) indicate a pressure range between 0.591kbar and 2.996kbar. On the other hand, the calculated isochores for Type I fluid inclusions indicate a pressure range between 0.129kbar and 1,452kbar.
Due to the lack of other geo-barometers in El Vapor district, the results of this study should be understood as the only available source of information about the depth to which the ore deposit may have been formed.
pH and oxidation state of hydrothermal fluids in El Vapor
The mineralogical alteration associations (carbonate ± epidote + chlorite and muscovite ± illite + quartz) indicate a fluid near to neutrality, with a range of pH between 5 and 6 (Phillips & Groves, 1984) in El Vapor district.
Meanwhile, the CO2, CH4 and N2 variable content, identified in the microthermometric and Raman studies, shows a reduced oxygen fugacity (fO2) in the hydrothermal fluid, consistent with the ore mineralogy: abundant pyrite, presence of pyrrhotite, and the absence of arsenic in the system, confirmed by the nonexistence of arsenopyrite.
The presence of CH4 and N2 in fluid inclusions as well as the association observed of carbonic material in the mineralized zones can be explained by the reaction of mineralizing fluids with host rocks (Johnson et al., 1995; Cox et al., 1991; 1995), particularly with carbonaceous shales of Segovia sedimentary rocks. The values of oxygen fugacity, calculated to pH=5.5 (determined by the association of minerals alteration) at a pressure of 300MPa (comparable to the maximum trapping temperature obtained), is between 10-30 and 10-38 bar and is considered with Th achieved values (Fig 10).
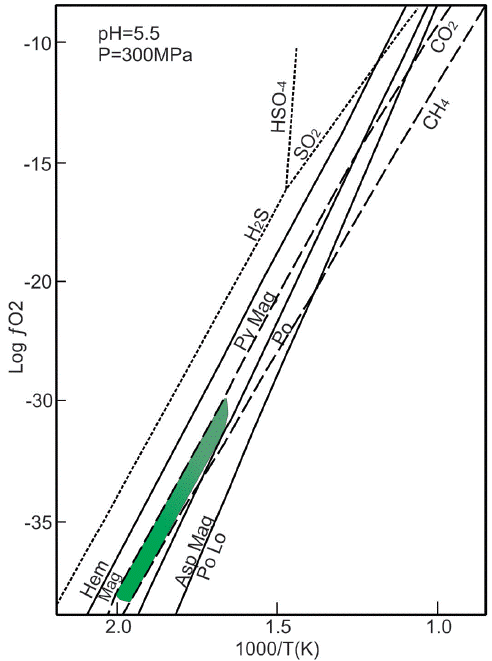
Figure 10 Diagram showing the relationship between temperature and oxygen fugacity for mineralizing fluids in El Vapor district, at pH = 5.5 and P = 300 MPa. Modified from Jia et al., 2000.
The value variations of fO2 indicate that the mineralizing fluids in El Vapor district probably had a complicated story. The CO2/CH4 variable relationship is related to the presence of reduced phases (with a greater abundance of CH4), and is a product of its reaction with host rocks, particularly with black shales of the Segovia sedimentary rocks.
Gold transport and deposit
Some authors have explored the transport mechanisms in relatively reduced hydrothermal solutions in equilibrium with pyrite/pyrrhotite. These solutions contain chlorides and sulfides (Seward, 1973; Seward, 1984; Hayashi & Ohmoto, 1991) in a temperature range between 160°C and 350°C and a pH between 1.4 and 9.5. The experimental results indicate that in pH conditions that are close to neutrality, and with a temperature range of 250°C to 350°C (similar to those established in the El Vapor district), the gold is mainly mobilized as bi-sulphide [HAu(HS)2 0, Au(HS)2-; AuHS(H2S3)0]. This process neglects the use of chlorine complexes as a method of luid transport, except if the luid is low in H2S, rich in chloride and the pH is less than 4.5 (Hayashi & Ohmoto, 1991).
According to the recognized conditions of pH and oxygen fugacity for the El Vapor district and the frequent association of gold crystals with sulphides, the most likely mechanism of gold transport is in the form of AuHS(H2S3)0, similar to the established conditions for other similar deposits emplaced in sedimentary sequences (Jia et al., 2000).
Because the lack of evidence supporting a process of fluid immiscibility, a change in pH, or the loss of H2S in the El Vapor district and because the microthermometric and spectroscopic analyses supports instead a fluid mixture and fluid reduction processes, we propose these mechanism as responsible for gold deposition from the hydrothermal solutions.
Conclusions
Based on the microthermometric and Raman analysis in this research, it can be concluded that in El Vapor district, hydrothermal fluids were responsible for the transport and deposition of gold in the first mineralization event. In addition these fluids are related to the CO2 + CH4 + N2 + H2O + NaCl system, with low to moderate salinity, reduced pH near neutrality, with a trapping temperature between 213°C and 340°C, a trapping pressure between 50 and 300MPa, and a depth of formation between 2 and 10km. The destabilization of bi-sulphide complexes in which gold was transported, was produced by an isothermal fluid mixture process, as well as the reduction with host rocks.
The characteristics in El Vapor ore deposit are remarkably similar to characteristics described for orogenic deposits (Groves et al., 1998), particularly those deposits emplaced in turbidite sequences around the world, as Muruntao (Drew et al., 1996; Graupner et al., 2001), North Deborah in Bendigo belt (Jia et al., 2000), Wattle Gully in Victoria (Cox et al., 1995) and Dungash (Zoheir et al, 2008).


