


 Inglés (pdf)
 Articulo en XML
 Referencias del artículo
 Enviar articulo por email
 Citado por SciELO
  Citado por Google
  Similares en
SciELO
Similares en
SciELO  Similares en Google
 Permalink
Introduction
One of the most important steps toward landslide evaluation is to undertake subsurface surveys. Using the subsurface surveys, one can evaluate geometry, layering, slip surface, lateral limits, and ground water level across a sliding zone (Merrit et al., 2014). There are numerous methods for subsurface survey. One of the most common and widely applied categories of these methods is geotechnical investigations (Gui-Sheng et al., 2016). Geotechnical investigations include boring boreholes or trial pits, taking disturbed and undisturbed samples, and conducting field tests (SPT, CPT, VST, etc.) and laboratory experiments (determining specific gravity, Atterberg limits, moisture content, particle size analysis, permeability, etc.). Geotechnical investigations provide accurate data and determine characteristics of the soil across the study area. Despite of the wide spectrum of their applications and reliability of their results, these methods are associated with problems which are pointed out in the following. Geotechnical investigations are costly to perform. These methods are destructive and require boring the ground. Moreover, the results obtained from geotechnical methods are limited to a specific point, and their operation is time-intensive (Lopes et al. 2014, Yilmaz and Narman, 2015, Szokoli et al., 2017). In addition, given that landslide areas are mostly located within remote areas of tough topography, it is very difficult to transport and deploy the required equipment for boring. Another set of methods increasingly applied in subsurface surveys is geophysical investigations (Rezaei and Choobbasti, 2017a). Nowadays, such methods as ambient noise measurement and electrical resistivity tomography (ERT) are widely applied in a landslide area. Geophysical methods are mostly inexpensive, fast, and non-destructive (Choobbasti et al. 2013, Rezaei and Choobbasti 2014, Rezaei and Choobbasti 2017b). Furthermore, one can examine a larger area of a landslide using geophysical investigations. In spite of the positive characteristics of geophysical methods, these approaches also suffer from weaknesses which are elaborated in the following. The results obtained from these methods are not as accurate as those from geotechnical methods. Geological and geotechnical data are required for calibration and verification of the geophysical methods, and interpretation of geophysical data is much more complicated than those of geotechnical data. Considering what was mentioned above, it is evident that a combination of geotechnical and geophysical investigations may provide an ideal approach to subsurface survey in a landslide area (Ozcep et al. 2009, Osman et al. 2014, Sil and Haloi 2017, Thokchom et al. 2017, Jusoh and Osman 2017).
Accordingly, today, a great deal of study is being performed to investigate correlation between geotechnical and geophysical parameters. Application of correlations can make the process of field investigation faster and less costly. Numerous researches have been performed to investigate the correlation between electrical resistivity and geotechnical parameters. In their studies, researchers achieved very weak to very strong correlations between electrical resistivity and geotechnical parameters (SPT-N, moisture content, coefficient of permeability, unit weight, plastic limit, liquid limit, plasticity index, etc.) (Cosezna et al. 2006, Oh and Sun 2008, Liu et al. 2008, Ozcep et al. 2009, Sudha et al. 2009, Calamita et al. 2012, Long et al. 2012, Kibria and Hossain 2012, Siddiqui and Osman 2013, Fallah-Safari et al. 2013, Osman et al. 2014, Abidin et al. 2014, Hatta and Osman 2015, Lin et al. 2017, Jusoh and Osman 2017, Devi et al. 2017). Investigation of the correlation between SPT-N and shear wave velocity has also a long history, with many correlations presented in this respect in codes and previous studies (Yordkayhyun et al. 2014, Lopes et al. 2014, Kirar et al. 2016, Anbazhagan et al. 2016, Gautam 2017, Salinas-Jasso et al. 2017, Thokchom et al. 2017, Sil and Haloi 2017, Nejad et al. 2018, Rahman et al. 2018). One of the common methods for shear wave velocity evaluation is ambient noise measurement and analysis (Asten et al. 2014, Büyüksaraç et al. 2014, Zuccarello et al. 2016, Borges et al. 2016, Pischiutta et al. 2017). Therefore, it is useful and important to correlate the shear wave velocity obtained from ambient noise measurement and SPT-N, considering efficiency and low cost of this geophysical method.
In the present research, geotechnical and geophysical investigations are used to conduct subsurface survey in a landslide zone. The geotechnical investigations include boring 6 boreholes and performing field tests and laboratory experiments. The geophysical investigations include ERT survey (along two 470-m long profiles) and ambient noise measurement at 30 stations. Once finished with data processing, correlations between geotechnical and geophysical parameters were investigated. These correlations included SPT-N - electrical resistivity, soil moisture content - electrical resistivity, and SPT-N - shear wave velocity. The correlations were examined using two test methods, namely Spearman's coefficient test and least square regression
2 - Study area
The study area considered in the present research is Nargeschal Village. The village is located 18 km to the southeast of Azadshahr City at an altitude of about 1080 m above mean sea level (MASL) within Golestan Province, Iran. Figure 1A shows position map of the study area in Iran. According to studies by Geological Survey and Mineral Explorations of Iran (GSI), this area is located within very high-risk and unstable zone (Figure 1B) (Pourghasemi et al. 2012).
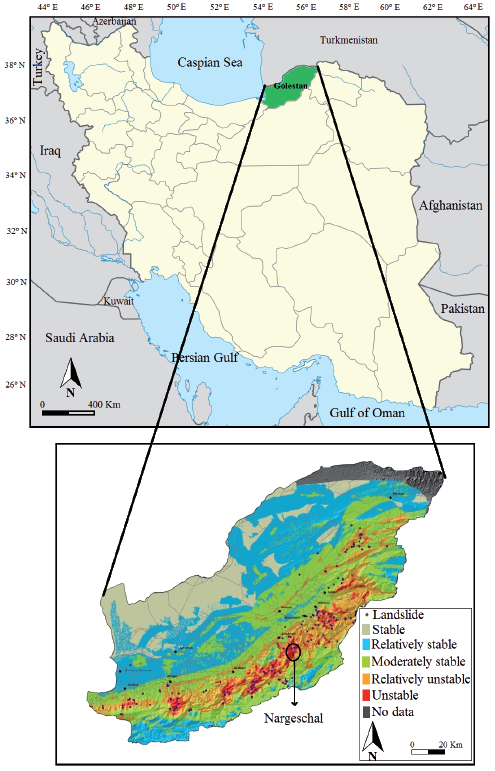
Figure 1 The study area (a) Position map of the study area in Iran, and (b) Landslide risk zonation across Golestan Province (based on GSI).
Heavy precipitation (130 mm per 24 h) and occurrence of earthquake (with a magnitude of 3.6 Richter) within a short period of time (2014/05/29 - 2014/06/04) ended up with landslide event at Nargeschal on 2014/06/04. The precipitation resulted in increased ground water level, reduced matric suction, and hence weakened soil layers which together with the occurrence of a relatively moderate earthquake contributed to the occurrence of a large landslide.
The landslide was roughly 750 m in length and its width was up to 80 m in the upstream and 350 m in the downstream. The slope of the area was 20° to 30° with a main slip direction at an azimuth of 80°, while the volume of slide masses was estimated to be up to 2 million m3. The landslide put the lives and properties of the residents in serious danger, so the village was evacuated and temporary accommodation was provided for the residents in a safe place (Rezaei et al. 2018).
Geotechnical and geophysical investigations were planned across the study area to identify the landslide geometry, slip surface, layering, and strength and seismic parameters of the soil, as detailed in the following sections
3 - Field investigations
3-1- Geotechnical investigations
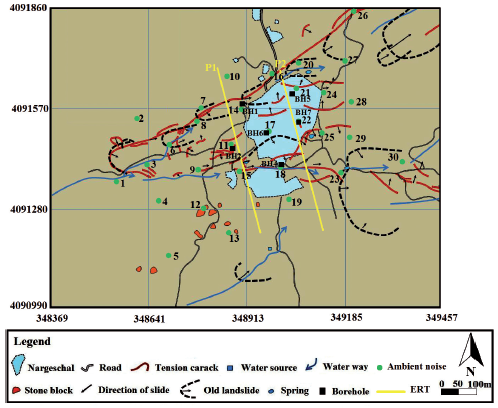
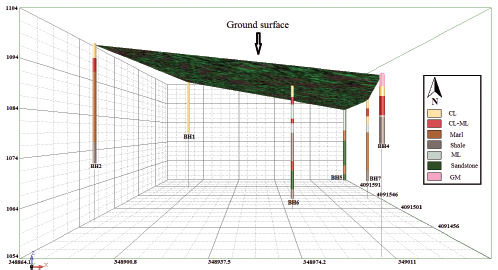
Geotechnical investigations in the present research included boring 6 boreholes and undertaking field tests and laboratory experiments. The boreholes were 9.5-24 m deep, and a total of 114.5 m soil was bored. During the boring operation, disturbed and undisturbed samples were taken for laboratory experiments. In order to characterize the soil covering the study area, such experiments as soil particle analysis, specific gravity determination, unit weight evaluation, moisture content measurement, Atterberg limits, direct shear test, and permeability coefficient determination were performed. Moreover, standard penetration test (SPT) was conducted. The SPT, which was developed around 1925, is a well-established and unsophisticated method and currently one of the most popular techniques for evaluating the geotechnical characteristics of soils to weather rock all over the world (Oh and Sun 2008). Figure 2 shows the position map of boreholes across the study area, while Figure 3 indicates logs of the boreholes.
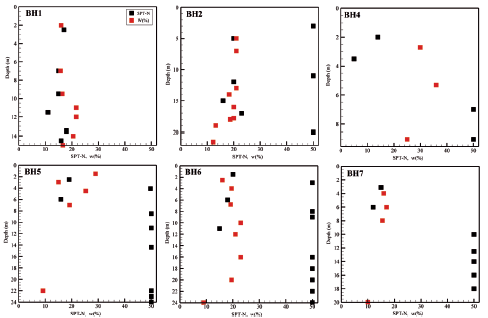
In order to stick with the main aim of the paper (investigation of the correlation between geotechnical and geophysical parameters), only results of the tests for which the obtained geotechnical parameters were acceptably correlated to geophysical parameters are presented herein. Accordingly, results of soil moisture content determination and SPT tests are presented. Figure 4 shows variations of SPT-N and moisture content (ω) in the boreholes. It is observed that SPT-N shows a significant change in some boreholes. Previous studies demonstrate that the boreholes drilled up to a depth below the slip surface represent such a log. Similar borehole logs can be found in studies by Isik et al. (2004), Suryo (2013), Crawford et al. (2015) and Topsakal and Topal (2015).
3-2- Geophysical investigations
Geophysical investigations performed in the present research included ERT survey and ambient noise measurement. The aim of ERT survey was to determine landslide geometry, lateral limits, slip surface, and ground water level. Ambient noise measurement is performed to determine fundamental frequency, direction of site response, and shear wave velocity across the study area.
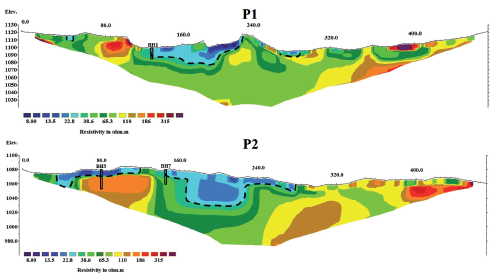
ERT measurements were performed along two profiles of 470 m in length using Wenner-Schlumberger array. Figure 2 shows the position of the profiles across the study area. Measurements were performed using a multi-electrode Geomative-GD10 device by utilizing 48 electrodes. The device is equipped with multi-core cables along with 12 electrodes spaced at maximum 10 m spacing to one another. In the present research, four cables were used. RES2Dinv Software was utilized to calculate the values of electrical resistivity. RES2Dinv software is based on the least squares method and uses the finite element (FE) and finite difference (FD). It inverts the pseudo-section apparent resistivity to subsurface electrical resistivity distribution using the quasi-Newton optimization technique (Shemang et al. 2013; Zarroca et al. 2014; Akpan et al. 2015; Ling et al. 2016; Soto et al. 2017).
In order to calculate the values of electrical resistivity, apparent resistivity and topographic characteristics of the profile path were imported into the RES2Dinv Software. Given the topography, the software employs a finite element to determine apparent resistivity. The optimization method adjusts the 2D resistivity model trying to reduce iteratively the difference between the calculated and measured apparent resistivity values. Following four iterations, RMS values along profiles 1 and 2 were found to be 3.17% and 2.47%, respectively. Figure 5 shows the distribution of electrical resistivity of soil across the study area.
Ambient noise measurement was performed at 30 stations via a single-station arrangement. It is worth noting that, due to steep slope of the study area (20 - 30%), the ambient noise measurement stations were not located at the same elevation level. Therefore, application of array-based methods such as SPAC was avoided (Del Gaudio et al. 2014). The equipment used in the present research included SL07 seismograph, a 7 A battery, GPS, compass, and a laptop PC. The seismogram is specifically suitable for setting studies to be performed at frequencies of up to 0.2 Hz (Lotti 2014).
In the course of the present research, all recommendations given by SESAME team were respected. Recording time and sampling rate of ambient noise measurements at each measurement station were set to 4560 min and 100 Hz, respectively. In the present research, ambient noise processing and determination of H/V spectral ratio was performed via HVNR method utilizing Geopsy Software (Nakamura 1989).
The H/V is linked to the ellipticity of Rayleigh wave, in situation where the high shear wave contrasts exist between soil and bedrock (Bard 1999). Once the H/V spectral ratio was calculated, Dinver module was used to compute ellipticity curve. The module performs inversion using neighborhood algorithm. In order to perform the inversion, a set of initial parameters such as shear wave velocity, primary wave velocity, Poisson's ratio, and density is required. These initial values were determined using the borehole data. All these data can be provided to the ellipticity curve inversion at the end to get shear wave velocity profile (Ullah & Prado 2017). For all the models tested, the theoretical ellipticity curves of the fundamental mode Rayleigh wave have been first computed (forward problem), and subsequently compared with the empirical H/V curve. The comparison provides a misfit value, which indicates the semblance between the synthetic and the observed H/V curve (Mundepi et al. 2015).
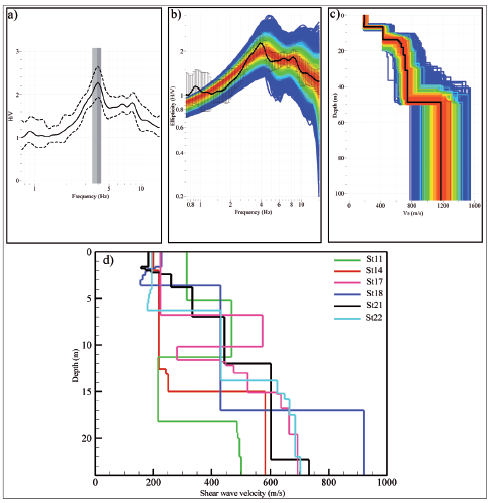
The model with the minimum misfit was selected as the final solution. Figure 6A-6C demonstrate H/V spectral ratio, ellipticity curve, and shear wave velocity profile, respectively, at station St22. Figure 6D shows shear wave velocity profile down to a depth of 24 m (maximum depth of the existing borehole) at stations in the vicinity of the boreholes, across which correlations can be established.
4 - Methodology
In the present research, in order to study correlations between geotechnical and geophysical parameters, Spearman's coefficient test and least square regression analysis were used. Typically, engineers use least square regression analysis to investigate the correlation between a pair of variables, with the quality of the obtained relationship examined using R-squared value (R 2 ). In the present research, we begin with investigation the correlation between geotechnical and geophysical parameters using least square regression analysis. Linear, logarithmic, exponential and power curve fitting approximations were applied and the best approximation equation with highest R 2 was selected.
R 2 values smaller than 0.3 indicate that there is no correlation between the considered variables. However, should the R 2 value fall within the ranges of 0.3 - 0.5, 0.5 - 0.7, 0.7 - 0.9, and 0.9 - 1, the corresponding correlations are recognized as weak, moderate, strong, and very strong, respectively (Jusoh and Osman 2017). Since most of researchers are well familiar with the least square regression analysis, no further detail on this technique is provided herein and we rather proceed to explain Spearman's coefficient test.
Spearman's rank correlation coefficient (r s ) is a non-parametric measure of correlation, using ranks to calculate and measure the correlation between two variables. The ordered categories can be replaced by their ranks, and the correlation coefficient (r s ) calculated on these ranks, measures the strength of association between two ranked variables to indicate how closely two sets of rankings agree with each other (Lin et al. 2017). Spearman's rank correlation coefficient is obtained using Equation (1).
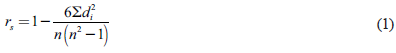
In this relationship, d i is the difference between ranks, and n is the number of members of each parameter. The value of r s varies in between + 1 and - 1. Positive and negative values of r s indicate positive and negative correlations, respectively. r s = 0 shows no correlation. The closer the value of r s to ± 1, the stronger is the respective correlation. The [r s ] values in the ranges 0 - 0.2, 0.2 - 0.4, 0.4 - 0.6, 0.6 - 0.8, and 0.8 - 1 indicate very weak, weak, moderate, strong, and very strong correlation strength, respectively. In order to apply this method, one should begin with ranking the values of each parameter (electrical resistivity, shear wave velocity, water content of soil, SPT-N, etc.). For this purpose, the smallest value of each parameter takes the rank 1 and the rest of the members are assigned subsequent ranks in the order of increasing value. Sometimes, there are ties in the data. Tie means that two or more values are the same, so there is no strictly increasing order (for example, the value of SPT-N is 50 at more than one areas). When this happens, identical values (rank ties or value duplicates) are assigned a rank equal to the average of their positions in the ascending order of the values (Lin et al. 2017).
Once the value of r was calculated, one should check to ensure that the obtained value is not solely based on chance, i.e. null hypothesis shall be rejected. Significance test is used for this purpose. The significance testing is run to test the significance of the relationship. For samples with more than 20 values, a t statistic can be written as,
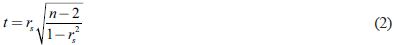
The significance level α for a given hypothesis test is a value for which a P value less than or equal to a is considered statistically significant. Typical values for α, are 0.1, 0.05, and 0.01. Hence if P value associated with that t statistic is less than a, the null hypothesis is rejected, and there is a trend in the data (Lin et al. 2017).
Since the Spearman rank coefficient method is completely different from the last square regression method, the simultaneous use of both methods is a reasonable decision. The Spearman rank coefficient method does not represent a relationship but examines the quality of correlation more accurately. In contrast, the last square regression method provides relationships which can be applied by researchers and engineers in their field investigations and activities. An advantage of Spearman rank coefficient is that if one or more data are far greater than other data, their correlation is not affected because just their ranks are evaluated. Since the data values have great deviations and differences in this study, the use of Spearman rank coefficient seems reasonable.
For further detail about the Spearman's coefficient test, please refer to the studies reported by Lehman (2006) and Lin et al. (2017).
5 - Analysis of electrical resistivity - geotechnical parameters correlation
In order to investigate electrical resistivity - geotechnical parameters correlation, data of the boreholes BH1, BH5, and BH7 were used. Despite the closer distance of the borehole BH2 than borehole B1 to profile P1, its data was not used for investigating the correlation between electrical resistivity and geotechnical parameters. The borehole BH2 is located at upstream of the profile P1, and due to the steep slope of the ground in this area, their elevation levels differ by more than 5 m. Therefore, due to the high difference in elevation level, it makes no sense to have them correlated.
Numerous geotechnical parameters have been evaluated for correlation investigation. Among these parameters, one can refer to SPT-N, moisture content, liquid limit, plastic limit, plasticity index, unit weight, specific gravity, and permeability coefficient.
Results of the investigations indicate very weak to weak correlation between electrical resistivity and liquid limit, plastic limit, plasticity index, specific gravity, and unit weight. The values of R2 and [rs] obtained from the correlation between the electrical resistivity and the mentioned geotechnical parameters were found to range within 0.05 - 0.2 and 0.21 - 0.41, respectively; as such, the respective results are not presented herein. Giao et al. (2003), Long et al. (2012), and Siddiqui and Osman (2013) reported similar results. They observed very weak correlations between electrical resistivity and plasticity index as well as unit weight.
Permeability coefficient has exhibited a strong correlation coefficient toward electrical resistivity (R 2 = 0.87). However, given inadequacy of the number of available data (n < 5), the results are not presented herein. Results indicate that, with increasing the permeability coefficient, electrical resistivity decreases. This is because of the fact that, an increase in permeability coefficient increases the pore space between the soil particles, and since the space is filled with water, this ends up reducing electrical resistivity.
Considering what was mentioned above, electrical resistivity-soil moisture content and electrical resistivity - SPT-N correlations are discussed in the following.
5-1- Electrical resistivity-soil moisture content correlation
Figure 7 demonstrates the electrical resistivity-soil moisture content correlation. The data presented in Figures 4 and 5 are used to visualize Figure 7.
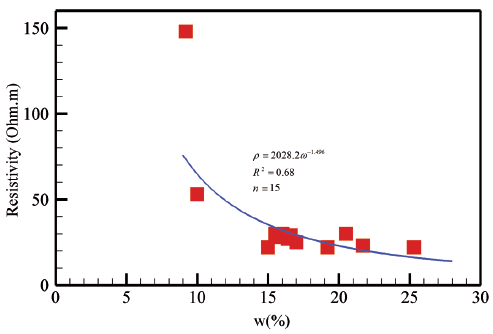
According to this figure, electrical resistivity-soil moisture content correlation can be obtained from Equation (3).

In the above relationship, ρ and ω are electrical resistivity and soil moisture content, respectively. The R 2 = 0.68 indicates a moderate correlation. Considering Figure 7, it can be found that, electrical resistivity decreases with increasing the moisture content. This result resembles those of previous studies (Siddiqui and Osman 2013, Jusoh and Osman 2017, Lin et al. 2017). This indicates that, variations of in electrical resistivity of the soil are affected by water, so that the larger the amount of water existing among soil particles, the lower will be the electrical resistivity of the soil. Higher moisture content facilitates conduction of electrical current through movement of ions in pore water (Siddiqui and Osman 2013).
Table 1 demonstrates the results of Spearman's coefficient test for the electrical resistivity-soil moisture content correlation. The data reported in this table are adapted from Figures 4 and 5. Looking at Table 1, it is evident that r s = -0.6030. The negative sign indicates the inverse relationship between the two parameters considered herein (electrical resistivity and moisture content), i.e. an increase in one parameter results in a decrease in the other one. Considering the criteria set in the section on methodology, [rs] = 0.6030 indicates a strong correlation. The low value of P is an indication of significance of the obtained correlation, rejecting the null hypothesis.
Table 1 Ranking orders, Spearman's rank correlation, and significance test of the electrical resistivity and moisture content of soil
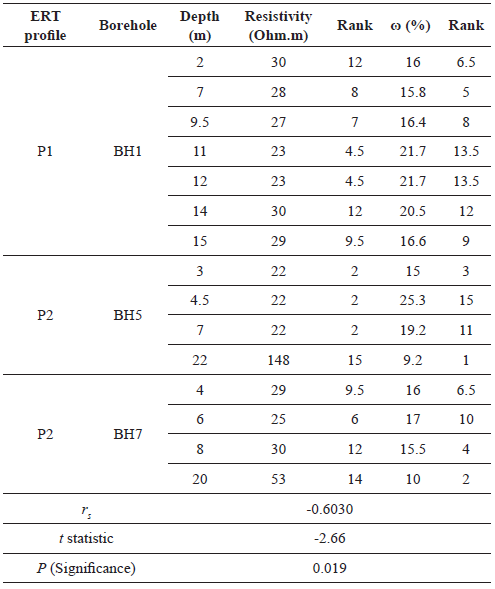
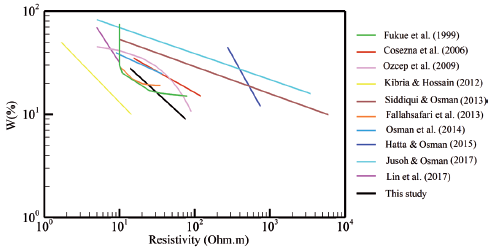
Figure 8 compares the results of the present research to those of previous research works. Investigating this figure, it is clear that the results obtained in this study fall within the range of those reported in previous research works, particularly those presented by Cosezna et al. (2006), Fallah-safari et al. (2013), Osman et al. (2014), and Lin et al. (2017). The number of data used to investigate the relationship was n = 15. It is worth noting that, the number of data points used in many of the previous works has been around the same number (n ≤ 20) (Cosezna et al. 2006, Kibria and Hossain 2012, Fallah-Safari et al. 2013, Osman et al. 2014).
5-2- Electrical resistivity - SPT-N correlation
Figure 9 shows the electrical resistivity - SPT-N correlation. The data presented in Figures 4 and 5 are used to visualize Figure 9.
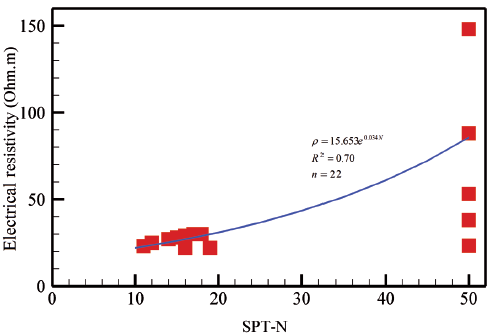
According to this figure, electrical resistivity-SPT-N correlation can be obtained from Equation (4).

In the above relationship, ρ and N are soil electrical resistivity and SPT-N, respectively. The R 2 = 0.70 indicates a strong correlation. Considering Figure 9, it can be found that, electrical resistivity increases with increasing the SPT-N. This result resembles those reported in previous studies (Oh and Sun 2008, Liu et al. 2008, Hatta and Osman 2015, Devi et al. 2017). This indicates that, variations of in electrical resistivity of the soil are related to soil stiffness. Table 2 demonstrates the results of Spearman's coefficient test for the electrical resistivity - SPT-N correlation. The data reported in this table are adapted from Figures 4 and 5.
Table 2 Ranking orders, Spearman's rank correlation, and significance test of the electrical resistivity and SPT-N of soil
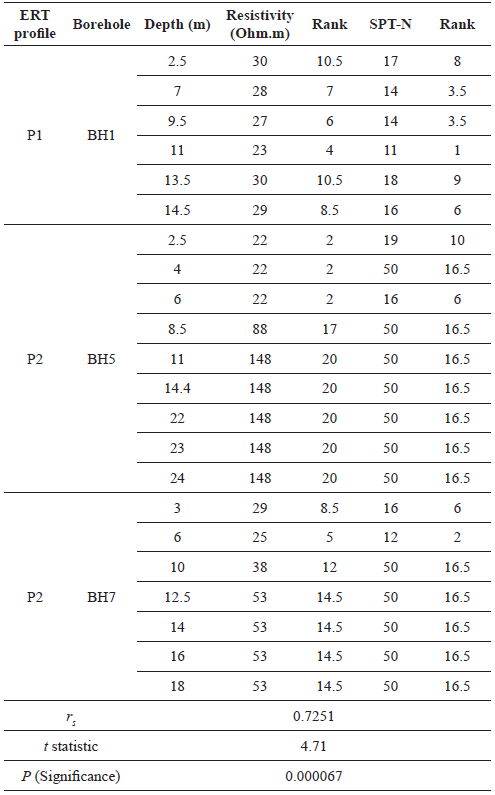
Looking at Table 2, it is evident that r s = 0.7251. This indicates a direct, strong relationship between electrical resistivity and SPT-N. The very low value of P is an indication of significance of the obtained correlation, rejecting the null hypothesis.
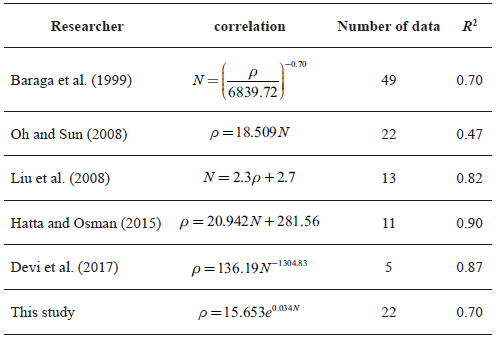
Table 3 compares the correlations obtained in the present study and those of previous research works. This table shows that, different curve fittings (linear, power, exponential, etc.) have been used in different studies. Since the correlations derived from various studies have different ranges of electrical resistivity, it is not appropriate to present and compare them in form of a figure.
6 - Analysis of shear wave velocity - SPT-N correlation
In order to investigate the correlation between shear wave velocities obtained from ambient noise analysis and SPT-N, the stations in the vicinity of the boreholes were used (St11, St14, St17, St18, St21 and St22).
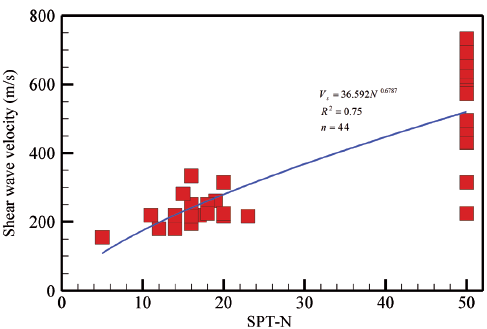
Figure 10 shows the correlation between shear wave velocities obtained from ambient noise analysis and SPT-N. The data presented in Figures 4 and 6 are used to visualize Figure 10. According to this figure, correlation between shear wave velocities obtained from ambient noise analysis and SPT-N can be obtained from Equation (5).

In the above relationship, V s and N are shear wave velocity and SPT-N, respectively. The R 2 = 0.75 indicates a strong correlation. Considering Figure 10, it can be found that, shear wave velocity increases exponentially with increasing the SPT-N. This result resembles those reported in previous studies (Anbazhagan et al. 2016, Salinas-Jasso et al. 2017).
Shear wave velocity depends on soil stiffness and shear modulus (Gautam 2017). Therefore, SPT-N, which is an indication of soil stiffness, is directly related to shear wave velocity. Table 4 demonstrates the results of Spearman's coefficient test for the correlation between shear wave velocities obtained from ambient noise analysis and SPT-N. The data reported in this table are adapted from Figures 4 and 6.
Table 4 Ranking orders, Spearman's rank correlation, and significance test of the shear wave velocity and SPT-N of soil
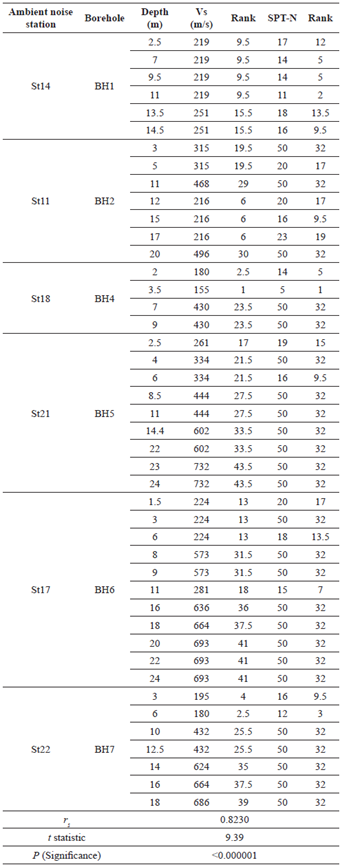
Looking at Table 4, it is evident that r = 0.8230. This indicates a direct, very strong relationship between shear wave velocity and SPT-N. The very low value of P is an indication of significance of the obtained correlation, rejecting the null hypothesis.
In Figure 11, result of this study is compared to those of previous studies. The references used in Figure 11 are adapted from Lopes et al. (2014), Kirar et al. (2016), Anbazhagan et al. (2016), Gautam (2017), Thokchom et al. (2017), Sil and Haloi (2017) and Salinas-Jasso et al. (2017).
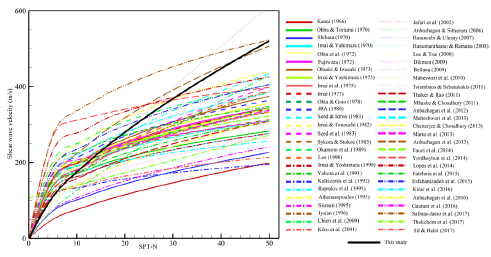
Considering this figure, it becomes clear that, results of the present research fall within the range of the results of previous studies. Relatively high shear wave velocity at high SPT-N values is a result of the presence of shale, marl, and sandstone layers across the study area (Figure 3). Shear wave velocities of shale, marl, and sandstone were in good agreement with the results of previous studies (Ahmad 1989, Hiltunen 2005).
7 - Discussion
Investigation of the results obtained in this study shows correlations of different strengths between geotechnical and geophysical parameters. The correlation strength was evaluated based on R 2 and r values. It should be noted that, r s is by no means equivalent to R 2 . Indeed, R 2 is not even directly related to r s .
r s is a non-parametric measure of statistical dependence between two variables. R 2 is used as a measure of success of predicting the dependent variable from the independent variables. For two related samples, there is only one r value, while there are different R2 values in different relationships (function model) (Lin et al. 2017).
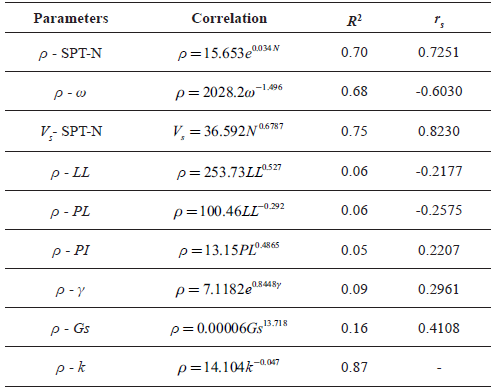
Moreover, Spearman's coefficient test investigates null hypothesis (using P value), and this enhances reliability of the solutions obtained from this method. In this research, the strengths of the obtained correlations evaluated using least square regression analyses and Spearman's coefficient test were almost the same; this verifies the obtained results. Table 5 presents the results of all correlations considered in this study. As was mentioned before, details of the results of the parameters for which either very weak correlations were obtained (liquid limit, plastic limit, plasticity index, unit weight and specific gravity) or the numbers of data points were too low (coefficient of permeability) were not presented.
Table 5 Correlations between geotechnical and geophysical parameters across Nargeschal landslide area
Geophysical investigations performed in this study were less costly and of better coverage than the geotechnical investigations. Due to steep slope of the study area (30%), boring equipment were impossible to transport to upstream of the study area, while ambient noise measurements could be conveniently performed in those areas. Using the shear wave velocity profile obtained from the ambient noise measurements and adopting the presented correlations in this study, one can extract soil properties within the study area. The obtained data have a wide spectrum of applications in soil classification, numerical analysis of slope stability, and presentation of solutions for soil improvement and stabilization across the study area.
Conclusions
In this study, results of ambient noise measurements and ERT survey along with borehole data were used to investigate the correlation between geotechnical and geophysical parameters within Nargeschal landslide area. H/V spectral ratio was calculated using ambient noise measurement and analysis via HVNR method. The H/V ratio is related to ellipticity of Rayleigh waves. Using the ellipticity of Rayleigh waves and inversion process, shear wave velocities were obtained. ERT surveys were conducted using Wenner-Schlumberger array, and electrical resistivity of soil layers was obtained using quasi-Newton optimization technique and inversion process. Moreover, field tests and laboratory experiments (e.g. SPT, particle size analysis, specific gravity, unit weight, density, Atterberg units, moisture content, and permeability) were used to compute geotechnical parameters of the soil.
In order to investigate the correlation between geotechnical and geophysical parameters, two methods were used, namely Spearman's coefficient test and least square regression analysis. The results obtained from the two methods are in good agreement with one another and fell in the range of previous studies. This verifies the obtained correlations in this study. Investigations indicated very weak to weak correlations between electrical resistivity and liquid limit, plastic limit, plasticity index, specific gravity, and unit weight. R 2 and [r s ] values obtained for the correlations between electrical resistivity and the mentioned geotechnical parameters were in the ranges of 0.05 - 0.2 and 0.21 - 0.41, respectively. Permeability coefficient was found to be strongly correlated (R 2 = 0.87) to electrical resistivity, so that an increase in permeability coefficient lowers electrical resistivity, due to the presence of water in pore space among the soil particles. Soil moisture content exhibited moderate (R 2 = 0.68) to strong (r s = -0.6030) correlation to electrical resistivity. This shows large effect of ground water on electrical resistivity. SPT-N exhibited strong (R2 = 0.70), (rs = 0.7251) correlation to electrical resistivity. This shows that variations of electrical resistivity of soil are directly related to soil stiffness. Furthermore, SPT-N exhibited strong (R2 = 0.75) to very strong (rs = 0.8230) correlation to shear wave velocity. This is a result of the direct relationship between shear wave velocity and soil stiffness (Gmax = pV2 s).
At areas where transporting boring equipment is not practical, the obtained correlations in this research can be used along with geophysical parameters to estimate mechanical and seismic properties of soil. These mechanical and seismic characteristics are largely applied in numerical analysis of slope stability and presentation of solutions for soil improvement and stabilization across the study area.

