


 Inglês (pdf)
 Artigo em XML
 Referências do artigo
 Enviar este artigo por email
 Citado por SciELO
  Citado por Google
  Similares em
SciELO
Similares em
SciELO  Similares em Google
 Permalink
Introduction
Many defects exist in the natural rock masses, such as: fractures, joints, etc. In the process of rock engineering construction and service, there are not only static loading, but also dynamic loading, especially the rock engineering along the highway, railway and bridge. Due to the long-term impact from traffic fatigue loading, the internal stress field of rock is changing, the rock strength is continuously attenuated with the accumulation of fatigue damage, and long-term safety and stability of rock engineering are greatly impacted.
With the improvement of people's requirements on the safety and durability of rock engineering, the scholars at home and abroad conducted relevant researches on the fatigue of rock. Xiurun (1987, 1992, 2003) researched the irreversible deformation and fatigue property of rock under cyclic loading, and put forward fatigue threshold value at the same time. Yanbo, Xing and GuoJie (2017)researched the stress-strain entire process curve, micro structure change, macro fracture characteristics and other fatigue damage characteristics of gypsum rocks under the cyclic loading by using acoustic emission system and environmental scanning electron microscope. Erarslan and Williams (2012) researched the fatigue damage mechanism of tuff under two different types of cyclic loading methods by using SEM. Momeni, Karakus and Khanlari (2015) researched the mechanical property of granite under cyclic loading.
According to the existing researches, the strength, deformation, fracture characteristics and failure mechanism of rock materials under cyclic loading are obviously different from that of static loading. Compared with other materials, the researches on rock fatigue are relatively limited at home and abroad, and rock fatigue is still one of the important lucubrate problems in rock engineering.
In this paper, the constant amplitude fatigue test was applied to research the fatigue life of rocklike fractured specimens, and the suitable fatigue life models were selected. Meanwhile, the main influencing factors of fatigue life were analyzed. The research results were helpful to the prediction of rock engineering life and design of fatigue resistance under fatigue loading.
TEST OVERVIEW
Rocklike Specimens
As the natural rock has defects without specific laws, there are great dispersion and uncertainty in the rock fatigue test, and thus, it is difficult to achieve the purpose of test. Through the indoor similar tests, the way of researching the strength, deformation and failure mechanism of rocks under certain structural characteristics is very effective to study the fractured rocks (Haeri, Shahriar and Marji, 2014a, b; Cao, Liu and Pu, 2015; Zhou, Cheng and Feng, 2014). In recent years, indoor simulation tests have been widely used (Cheng-zhi and Ping, 2012; JinJin, Ping and Chengzhi, 2014; Shilei, Junsheng and Feng, 2016).
In this test, barite powder, river sand (particle size was less than 0.5 mm), 32.5Rcomposite Portland cement, model gypsum, borax solution with concentration of 1% were used as similar materials, and the rocklike specimens were made according to the weight ratio, barite powder: river sand, cement, gypsum, borax solution = 42.0:21.5:8.5:12.7:15.3. The dimensions of specimens were 70mm×70mm×140mm, while the thin metal plate was used to make pre-facture, the length of fracture was 20mm, and the angles of fracture were set to 0°, 30°, 45°, 60° and 90°. The fractured specimens were shown in Figure 1.

Test Methods
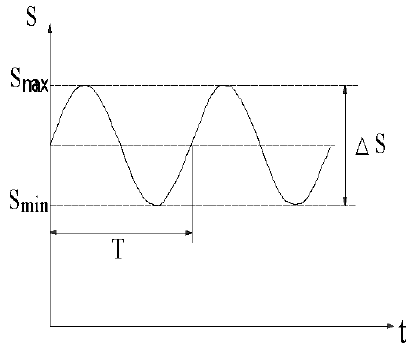
The electro-hydraulic servo fatigue testing machine was applied to load the fractured specimens, and constant amplitude loading control method was used in the test. The loading frequency was 5Hz, and sine wave was used as loading waveform. The characteristic parameters of loading waveform were shown in Figure 2. Of which, was the upper limit stress of cyclic loading; was lower limit stress of cyclic loading; , was the loading amplitude; T was cycle time, , was the frequency. The amplitude range of loading was 1.9 ~ 2.4 MPa according to the uniaxial compressive strength of specimens.
FATIGUE CURVE ANALYSIS
S-N Curve
Fatigue life S-N curve (also called as Wohler curve) refers to the relationship curve between stress level Sand material fatigue life N, which is mainly used to estimate and evaluate the fatigue life or fatigue strength of materials. In practical engineering, the stress level should be the upper limit of stress S max , N represents fatigue life, the absolute fatigue life log N or logarithmic fatigue life log N could be chosen. The fatigue life mentioned here refers to the required stress cycle-index N when the materials reach the fatigue failure under the cyclic loading.
According to the characteristics of the relationship between stress level and material fatigue life of S-N curve, the domestic and oversea researchers put forward many empirical models on the basis of experiments, and there are many commonly used forms as follows:
Exponential Function Model:

In equation, α and C are material constants. Both sides of equation (1) take the logarithm, then:

α = lg C / a, b = V a are set, the equation (2) can be simplified as:

Therefore, S-N exponential function model represented by equation (3) is a straight line in semi-logarithmic coordinate system. Power Function Model:

In equation, α and C are material constants. Both sides of equation (4) take the logarithm, then:

a = lg C / α, b = 1/α are set, the equation (5) can be simplified as:

Therefore, S-N power function model represented by equation (6) is a straight line in double logarithmic coordinate system.
(3) Power Function Model of Three Parameters:

In equation, α and C are material constants. S f1 represents the normalized value of rock fatigue limit, and it is obtained according to the ratio between the fatigue limit and the static strength of rock. Sf 1 is the material constant related to the rock property. Both sides of equation (7) take the logarithm, then:

a = lgC / α, b = 1/ α are set, the equation (8) can be simplified as:

In practical engineering, the S-N curve is generally fitted to the indoor fatigue test data according to the corresponding model.
Fatigue Curve Fitting and Analysis of Rocklike Specimens
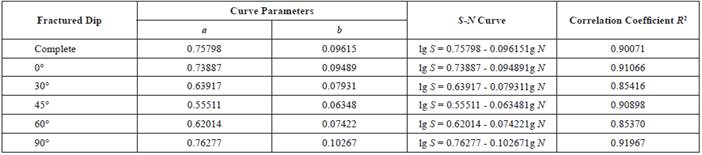
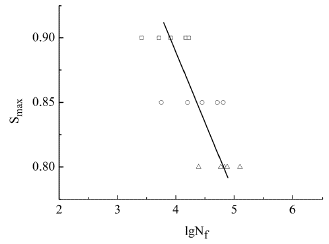
In this paper, the test data was fitted according to equation (6), the fitting degree of curve was judged by the correlation coefficient R 2 of the fitting curve. The fitting results are shown in figure 3, and the curve data is shown in table 1.
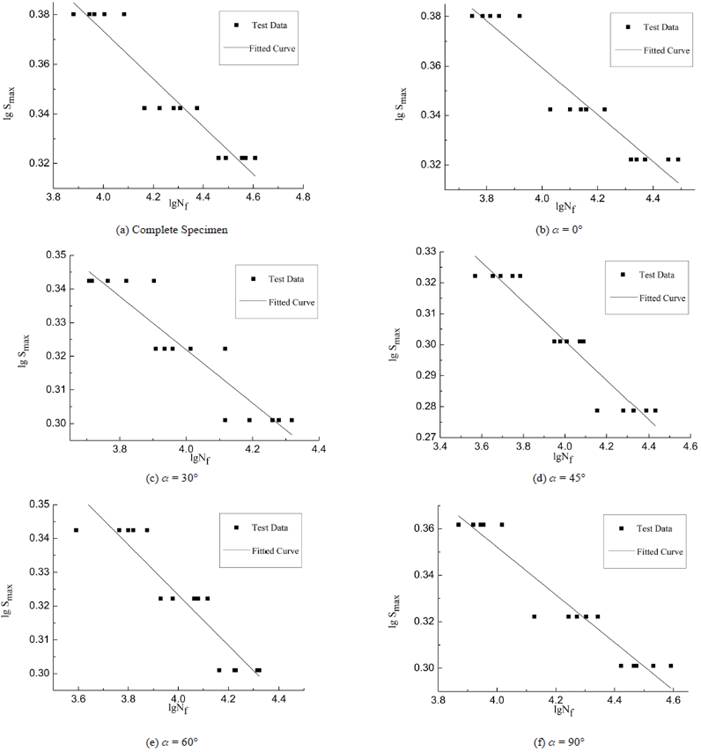
(1) Under the fatigue loading, if the upper limit stress of complete and fractured rocklike specimens was higher, the fatigue life of specimens was shorter; if the upper limit stress was lower, the fatigue life of specimens was longer.
(2) In terms of the slope of the S-N fitted curve, when the slope was smaller, the specimen fatigue life affected by the loading stress was more sensitive, the significant change of fatigue life was caused by the slight change of loading stress. Therefore, if the slope of S-N fitted curve was smaller, the deviation range in the prediction of fatigue life should be larger; if the slope was larger, the deviation range in the prediction of fatigue life should be smaller.
(3) In the process of specimens preparation and test, errors were inevitable. Therefore, under the same upper limit stress conditions, the fatigue life of rocklike specimens with same fracture dip was not exactly the same. The fatigue life discreteness of some rocklike specimens was relatively large, but from the fitting results of the test data, the correlation coefficient R2 was 0.85 above. It indicated that the fitting degree of S-N model and test data was relatively good.
In practical engineering, S-N fitted curves are widely used in the researches of material fatigue life due to its clear concept, simple form and convenient measurement. Under the condition of constant amplitude loading, the fatigue life of rock can be estimated by using interpolation method in S-N curves.
INFLUENCE FACTORS OF FATIGUE LIFE
On the one hand, the fatigue damage of the rock under fatigue loading is related with rock itself (rock type, strength, defects, etc.); on the other hand, it is affected by test conditions (stress amplitude, waveform, frequency, etc.). Due to the complex geological conditions and different environment of natural rock mass, the influence factors of fatigue life are more complicated, and there is relatively large discreteness in fatigue life. In this paper, only the main influencing factors involved in the test were analyzed.
Influence of Upper Limit Stress
The fatigue life of specimens is greatly affected by the upper limit stress. The previous studies have shown that the upper limit stress is the first factor influencing the fatigue life (Xiufeng, 2008). The cyclic loadings of different upper limit stress on the rocklike specimens were made, and the fatigue life of typical specimens was shown in table 2.
Table 2 Constant Amplitude Fatigue Life of Typical Specimens
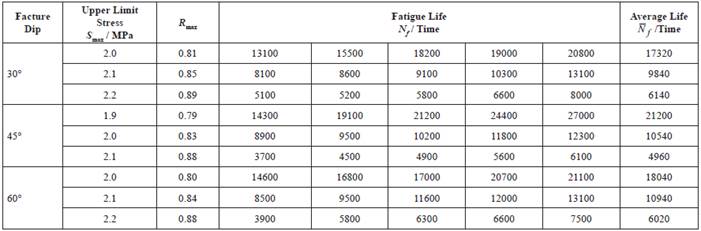
Note: Rmaxwas upper limit stress ratio, equal to the upper limit stress to the uniaxial compressive strength of the specimens, Rmax = Smax/σ c
It was indicated in Table 2 that under the same conditions, if the upper limit stress of fatigue test was larger, the fatigue life of specimens was shorter; conversely, if the upper limit stress was smaller, the fatigue life of specimens was longer. Generally speaking, if the strength of the material is higher, the external force is lower and the fatigue life of specimens is longer (Yu, 2003). Here, the fatigue threshold value of the material should be considered, the fatigue threshold value refers to the stress threshold of the fatigue failure of rock. Ge Xiurun put forward, whether the rock was damaged or not, it was related to the stress threshold value, and he also thought, rock fatigue threshold value was close to conventional yield value (Xiurun, 1987). In the fatigue test, if the upper limit stress is lower than the threshold of fatigue, the specimens could not reach the fatigue failure. If the upper limit stress is too close to the peak stress and the properties of the specimen are unstable, the failure rate of test will be increased. In this test, the upper limit stress ratio 0.76 ~ 0.90 was selected, and after the test proved, this range was relatively suitable.
Influence of Rock Type and Strength
Due to different formation causes of rocks, the mineral composition, content and other aspects are different, so that different types of rocks have differences in their natures. Even the same type of rocks, their material composition, structure and construction are different under different internal and external dynamic geological processes, and then, the rock strengths are different.
Xiufeng (2008)made fatigue test researches on grayish yellow sandstone, and concluded the S-N relationship of grayish yellow sandstone fatigue strength under cyclic loading:

In equation, S= σ max /σ c was upper limit stress ratio; N was fatigue life.
The fitted curve S-N was shown in Figure 4.
Yu (2003) conducted a fatigue test study on red sandstone and concluded the regression equation:

In equation, S = σ max /σ c was upper limit stress ratio; N was fatigue life. The fitted curve S-N was shown in Figure 5.
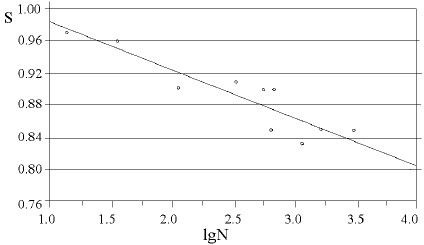
Figure 4 and Figure 5 showed both grayish yellow sandstone and red sandstone were called as sandstone; however, due to different internal mineral composition, content and strength of rocks, the slopes of fatigue life S-N curves were different. The slope of fatigue life S-N curves reflected the sensitive relationship between the fatigue life of specimens and upper limit stress ratio. It was indicated, if the slope was smaller, the change of fatigue life to upper limit stress ratio was more sensitive; on the contrary, it was less sensitive. Figure 4 indicated that the slope of grayish yellow sandstone S-N curve was relatively large, but the Figure 5 illustrated that the slope of red sandstone was relatively small. It was indicated, with the change of stress, the sensitive degree of fatigue life of grayish yellow sandstone was lower than that of red sandstone. It could be seen that different types and strengths of rocks not only had different fatigue life, but also had different sensitive degree between fatigue life and maximum stress.
Impact of Initial Damage
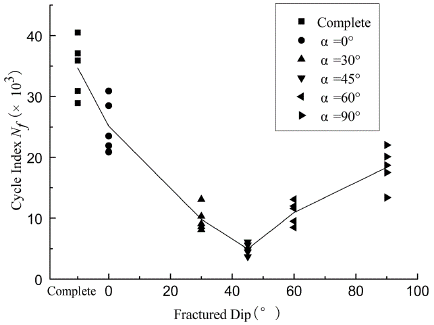
The initial damage indicates the loading history of the rock, and it is the damage state of the rock before fatigue loading. Even the same type of rock, if the environment is different, the initial damage is also different. In this test, the preparation process and curing conditions of each specimen were consistent, the small discrepancies in the specimen preparation were not considered as the key points; therefore, pre-fracture was used as the initial damage of rocklike specimen. It was found in the test, different dips of pre-factures had the significant effect on the fatigue life of rocklike specimens. Figure 6 illustrated the fatigue life changes of rocklike specimens with different dips when the loading amplitude, the curves were the average fatigue life line of rocklike specimens with different dips.
Figure 6 illustrated: According to the fatigue life data of specimens tested in this paper, under the same loading amplitude, the fatigue life of complete specimens was largest. When the dip of fracture α < 45°, the fatigue life of rocklike specimens was reduced with the increase of fracture dip; when α < 45°, the fatigue life was increased with the increase of fracture dip.
Conclusion
(1) According to the fatigue test results of the rocklike fracture test, the power function model was adopted to fit the test data, and the fitting degree of the curve was determined by the correlation coefficient , and the result was fitted well.
(2) S-N fitted curves had clear concept, simple form and convenient measurement; under the constant amplitude loading condition, the interpolation method was applied in the S-N curves to estimate the fatigue life of rock.
(3) The upper limit stress was the most important factor affecting the fatigue life of specimens. Under the same conditions, the specimen had a shorter fatigue life when being applied by higher upper limit stress, whereas the specimen had a longer fatigue life when being applied by lower upper limit stress.
(4) The slope of fatigue life S-N curves reflected the sensitive relationship between the fatigue life of specimens and upper limit stress ratio. It was indicated, if the slope was smaller, the change of fatigue life to upper limit stress ratio was more sensitive; on the contrary, it was less sensitive. The rock of different types and strengths not only had different fatigue life, but also had the different sensitive degrees between the fatigue life and the maximum cycling stress.
(5) The initial damage reflected the loading history of the rock, and different dips of pre-factures (initial damage) had the significant effect on the fatigue life of rocklike specimens.

