English (pdf)
 Article in xml format
 Article references
 Send this article by e-mail
 Cited by SciELO
  Cited by Google
  Similars in
SciELO
Similars in
SciELO  Similars in Google
 Permalink
Introduction
The interaction between surface water and groundwater is a globally known phenomenon (Sophocleous, 2002; Rosenberry & LaBaugh, 2008; Werner et al., 2013) of which exist a significant amount of reports on the interaction between groundwater and rivers and streams, while interaction with lakes is slightly focused (Barthel & Banzhaf, 2016). In the case of lakes, the interaction takes place in three primary ways: a) lakes gain water from inflow of groundwater through the lake bottom; b) they lose water to groundwater by outflow through the lake bottom, c) they do both, gaining in some areas and losing in others (Winter et al., 1998). In most of the sites reported, the groundwater discharges water in a lake if the altitude of the water-table near the stream is higher than the elevation of the lake water surface. On the contrary, surface waters may infiltrate into a groundwater environment, if the altitude of the water-table near the lake is lower than the elevation of the lake water surface (Winter et al., 1998; Sophocleous, 2002). The chemical composition of water in lakes can be relatively simple when it has only one source of natural input; however, when it has multiple inputs, its chemistry is exceptionally complicated. Thus, there are freshwater bodies whose chemical composition depends on various sources such as rivers, groundwater discharges, surface runoff, precipitations and discharges derived from anthropogenic activities (Ojiambo et al., 2001; Alexakis, 2011; Kazi et al., 2009). Particularly in the case of rift lakes, most of the reports were centered on African lakes, which showed that water in these environments present an extreme chemical variability with predominance in carbonates and sodium (Tailling & Tailling, 1965; Chernet et al., 2001). Some of these works focused their attention on the problem of eutrophication owing to human contamination (Nyenje et al., 2010). Other authors reported that the variability in chemistry in the rift lakes is due to changes in climate, hydrographic conditions and lithology (MacIntyre, 2012). In the Ethiopian rift lakes, the reports indicate chemical variations related to different factors such as the dominant presence of basalt and rhyolite, contributions of meteoric water in the system and the processes of evaporation (Rango et al., 2010). In contrast to a significant amount of work available on the rift lake in Africa, only a few works in America have addressed the topic of chemistry variability in rift lakes.
Regarding the techniques used to evaluate the chemical variability of water bodies, Kazi et al., (2009) reported that multivariate statistical techniques like the Principal Component Analysis (PCA) help in the interpretation of complex data matrices for a better understanding of the variability of water quality. Nevertheless, the sensitivity of lakes to natural and anthropogenic variability factors depend strongly on their morphometry such that the large and shallow lakes are susceptible to natural physical drivers, whereas, in deep lakes, the biological and chemical factors prevail (Tuvikene, 2018). To assess the representativeness of conventional point sampling used in water quality monitoring, Anttila et al. (2008) proposed a geostatistical method where the semivariance of each observation pair is plotted against the distance of separation of these pairs. Nevertheless, they showed that point source samples are representative only over small areas. In addition to the changing stationary patterns in water quality, there exist other point sources of nutrients and suspended solids from inflows or diffused sources. This kind of spatial distribution characteristic of the river mouth and shoreline areas can be detected by remote sensing (Tuvikene, 2018). For these reasons, this paper deals with different statistical and geospatial techniques to analyze the origin of the chemical composition of water from Chapala Lake, which is the most extensive rift lake in Mexico and one of the most important shallow lakes in Latin America (De-Anda et al., 2004).
Chapala Lake has a total area of 1146.59 Km2 and constitutes the discharge area of Lerma-Chapala (Hernández-García, 2006). In addition to this condition, Chapala Lake receives the wastewater of the populations settled on the shoreline of the Lake. This environment causes eutrophication problems in the lake as reported in several works (Hansen and Maya, 1997; Vargas and Mollard, 2005; Hernández-García, 2006; Cifuentes et al., 2011).
Among the main environmental problems for Chapala Lake is the presence of pollutants such as nitrogen and phosphorus caused by climate change and anthropogenic activity (De-Anda et al., 2000; Quiroz-Castelán et al., 2004; De-Andaand Maniak, 2007; López-Hernández et al., 2007).
Other studies have reported toxic pollutants such as cadmium, lead and arsenic from industrial wastewater and the geological composition of the region (Hansen and Maya, 1997; Hansen and Van Afferden, 2004; Zárate-del Valle et al., 2006; Trujillo-Cárdenas et al., 2010; Chávez-Alcántar et al., 2011), and the increase in concentration of solids as a result of the discharges from Lerma river which is its main tributary (De-Anda et al., 2004). De la Mora-Orozco et al., (2004) reported that the quality of water in Chapala Lake varies significantly based on seasonal factors, mainly by the revenue of water during the rainy season, allowing a recovery period that is inherent in the seasonal dynamics of the lake. The changing conditions of the lake have been analyzed with various statistical techniques and geospatial analysis (Lind and Dávalos-Lind, 2002; De la Mora-Orozco et al., 2004; López-Caloca et al., 2008). Previous studies conducted on the Chapala Lake shows the need to characterize the predominant pollutants and their relationship with geographical space, in order to control the pollution of the Lake. Furthermore, it is necessary to evaluate, in first instance, the interrelatedness of the different pollutants, because some of these substances tend to form complexes with organic and inorganic elements of the water (Nieboerand Richardson, 1980; Cruz-GuzmánAlcalá, 2007). Therefore, the analysis of water quality must take into account this particular condition for contaminants such as manganese (Mn2+), lead (Pb2+), nickel (Ni3+), copper (Cu+), magnesium (Mg2+), calcium (Ca2+) and sodium (Na+) among others (Peña-Núñez, 2006; Calderón et al., 2007; Díaz & Colasurdo, 2008; Carrión et al., 2012). Putting this background into consideration, it is necessary to ask if the pollution of the Lerma river and urban areas have a similar effect around the Lake or if there are other factors that affect the water quality in Chapala Lake. The objective of this study was to identify and quantify the different contributions that give rise to Chapala Lake, considering its tectonic origin. To achieve this, a methodology was proposed to characterize the recent state of the quality of water in the lake, from methods of mixing water from End-Members (EM), statistical multivariate analysis techniques; and the geospatial distribution of the pollutant concentrations from satellite imageries visual analysis.
2.- MATERIALS AND METHODS
2.1 Location of study area
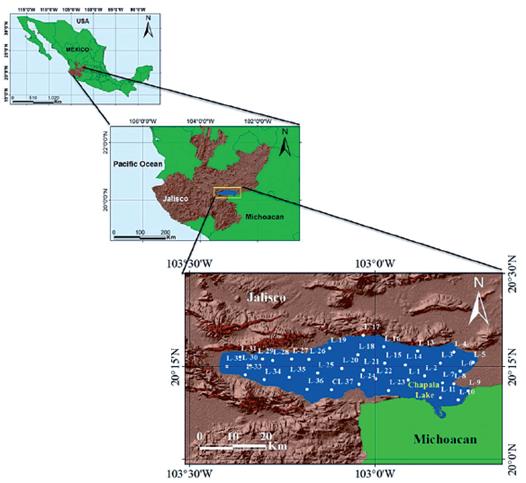
Lake Chapala is a natural reservoir of Mexico, located mainly in the state of Jalisco, Mexico (Figure 1). It has a total area of1146.59 km2, of which Jalisco occupies 86% and Michoacan 14%. The full capacity of the lake is 7,897 million cubic meters (Mm3).
2.2 Geological Setting
The study area is a structure known as Triple Point Junction of Jalisco (TPJ), and this structure is formed by the rifts of Colima (N-S), Tepic-Zacoalco (NW-SE) and Chapala (W-E). In Chapala, there is a significant topographic depression forming Lake that extends 90 km towards the east of TPJ. Chapala rift is delimited by a NEE-oriented step failure system (Luhr et al., 1985). The Chapala rift was developed at the Early Miocene, from a transcurrent fault of the regional system Chapala Tula (Figure 2), with orientation E-W (Rosas-Elguera and Urrutia-Fucugauchi, 1998).
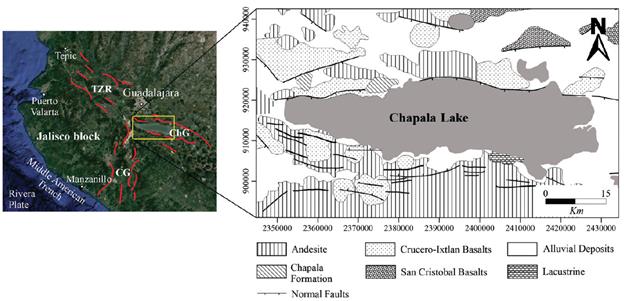
Figure 2 Structural-tectonic setting and geology of Chapala Graben (ChG); Tepic-Zacoalco Rift (TZR); Citala Graben (CG) (Modified of Rosas-Elguera & Urrutia-Fucugauchi, 1998).
The north of Chapala Lake shows the oldest rocks (Figure 2). They consist of Miocene basalts aged 8.5 - 10 Ma and they are exposed in the NE corner of the area of study (Rosas-Elguera et al., 1998). Around the Chapala basin outcrop are basaltic-andesitic rocks of Late Miocene-early Pliocene (Rosas-Elguera et al., 1998). The Chapala Formation is visible in the western and central parts of the northern shoreline of the lake. This unit consists of alternating lacustrine sediments and pyroclastic units (ash and pumice) of Late Pleistocene or Late Pliocene (Downs, 1958). The basaltic lava and basalt cones of the group Crucero-Ixtlan basalts were formed during the Late Pliocene, and their ages are between 3.3 and 2.5 Ma (Rosas-Elguera et al., 1998). The outcrop of Quaternary consists of monogenetic volcanoes, several calcoalkaline-rhyolitic-dacitic domes, andesitic cones and lava flows with ages lower than 1.0 Ma (Rosas-Elguera et al., 1998).
2.3 Analytical procedures
Thirty-seven water samples were collected from Chapala Lake within three days, from March 30th to April 2nd, 2014 (Figure 1). At each observation point, a wide range of physicochemical parameters was measured to ensure a good representation of a variety of potential pollutants in the dataset. Water samples were collected from the whole lake, using random sampling, which was georeferenced in UTM coordinates.
Water samples were collected at depth of 1 m and then were stored in bottles of polyethylene (HDLP) which were cleaned and rinsed seven times with deionized water. To collect the samples of cations and trace elements, the bottles were first of all washed and 10% HCl was added. For each water sample, the following parameters were determined in situ: pH, electrical conductivity, temperature, dissolved oxygen (DO) and alkalinity. Immediately after being collected, the samples of cations and trace elements were acidified with pure nitric acid to pH < 2. All the samples were stored in an icebox at a temperature lower than 4 °C. Major ions and trace elements were analyzed in the laboratory of the Institute of Geology of the Autonomous University of San Luis Potosí.
The concentrations of major cations (Ca2+, Mg2+, Na+ and K+) were determined by ICPOES ICP-MS "Thermo X series II", the major anions (SO2- 4 and Cl-) were analyzed using Smarte 3 Colorimeter, these analysis were performed in triplicates. Alkalinity and HCO3 - were determined by titration on the site. The error ion balance (electro neutrality) was less than 5%.
2.4 Multivariate statistical and End-member mixing analysis
Chapala Lake is a large body of water comprising groundwater and surface water. The Lerma river collects urban and industrial wastewater from its origin in the Toluca Valley to the Chapala Lake. Meanwhile, the Duero river, born in the Valley of Chilchota, is an urban water collection site for different towns (Figure 4). Other tributaries of much smaller scale, flow into the lake.
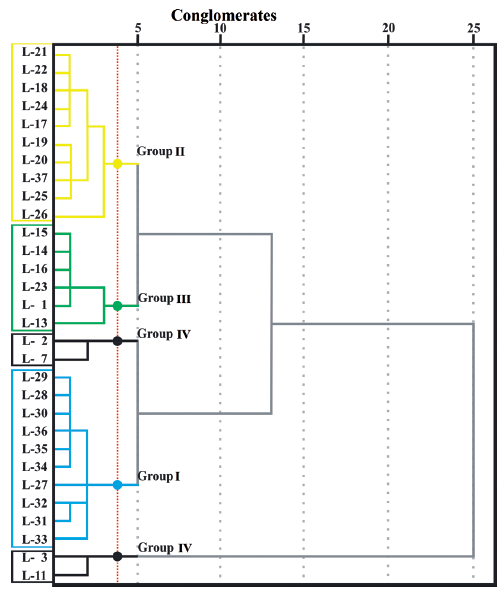
Figure 3 Dendrogram of the Q-mode cluster analysis (The axis shown at the top indicates the relative similarity between cluster groups. The lesser the distance, the higher the similarity between water samples).
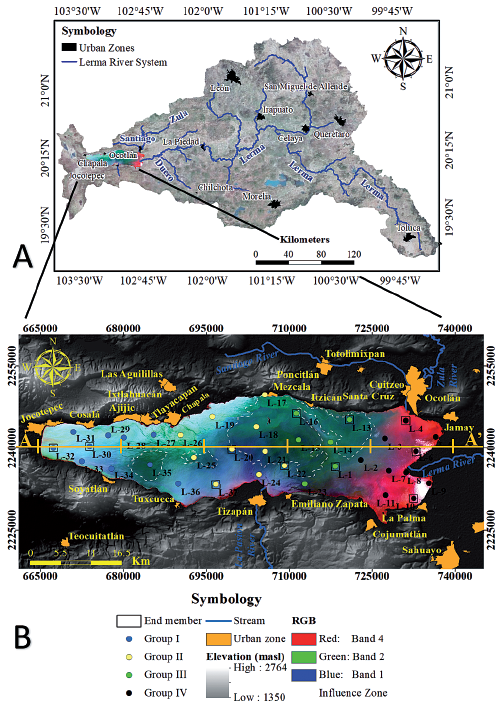
Figure 4 A) Lerma River basin, where is the origin of the rivers Lerma (Toluca) and Duero (Chilchota Valley). B) Mixes of water distributed in Chapala Lake. The colors result from a combination of bands 4, 2 and 1 in the channels red, green and blue, respectively. The image used was a Landsat 7 ETM+ from April 2nd, 2014.
This study intends to use mixing models to obtain water chemistry in Lake Chapala, which can be binary or ternary. The binary mixing model, can be an evolutionary process between two end members (Ramos et al., 2004). Finally, the water fraction type M (FrM) is calculated in the mixture, for the conservative element (Cl) expression (Appelloand Postma, 1996; Generaux et al., 2002):
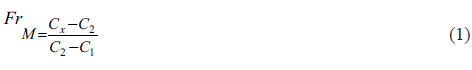
Where CX, C1 and C2 represent the concentrations of the selected sample, water type C1 and C2, respectively. In this equation, the total is equal to 1.
For the percentage of each EM, the ternary mixture is considered for which a system of three equations with three unknown are used. Starting with a general equation, where in the total concentration of the lake is C (Equation 2).

Where C1, C2 and C3 are unknown members associated with different sources and Cw values are equal to 1.
To solve Equation 1 with three unknown variables, 3 equations are needed, in which the concentrations of the conservative elements (e.g. Chloride (C1-) and fluoride (F-)) from the ternary mixture model of the EM are used (Equations 3 and 4).


Where C1 is the EM with lower concentrations in its conservative elements, C2 is the EM with high concentrations in one of the conservative elements; C3 is the EM with the highest concentration in the conservative elements or a high concentration in one of them.
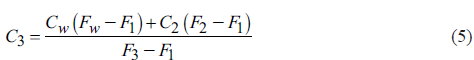
C3 is obtained by combining Equations 1 and 3 (Equation 5).
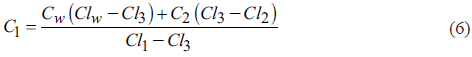
C1 is obtained by combining Equations 1 and 4 (Equation 6).
The only solution for C2 when CW = 1, can be obtained by substituting C1 and C3 in Equation 2 and solving C2:

2.5 Geostatistical analysis
The geostatistical analysis was performed based on the geochemical data obtained in the field. The analytical process includes the statistical exploration of the chemical components recorded in the thirty-seven points visited in the study area. Thereafter, the structural behavior of data was explained by spherical semivariogram calculated with equation 8 (Isaaks& Srivastava, 1989).
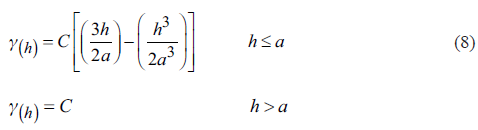
Where: γ(h) - variogram value at distance “h”, C - constant, h - distance, a - range.
Subsequently, ordinary kriging was applied to obtain the variability surface for each chemical component analyzed. This method of geostatistical estimation is widely described by Wackernagel (2013). Results validation was done using the cross-validation technique known as leave-one-out, which consists of removing each data location one at a time and predicting the associated data value (Refaeilzadeh et al., 2009). The software ArcGIS 10.3 was used during the whole geostatistical procedure.
2.6. Satellite images analysis
In order to corroborate the observations produced from the analysis of extreme elements, a digital processing of a Landsat 7 ETM+ image of April 2nd, 2014 was performed. The date selected for processing of the image corresponds to the date of field work in the Chapala Lake when the samples were gathered for hydrogeochemical analysis. The cloud cover in this image is 0%. The software ENVI 5.3 was used to generate the algorithms for the processing of the satellite imagery. The treatment performed on the image consists of several steps that began with the conversion of Digital Number (DN) to TOA Reflectance. For this purpose, the criteria of Chander and collaborators (2009) was used (Equations 9 and 10).
Where: L λ =Spectral radiance at the sensor's aperture [W/(m2srµm)], Q cal =Quantized calibrated pixel value [DN], G rescale = Band-specific rescaling gain factor [(W/(m2srµm))/DN] and B rescale = Band-specific rescaling bias factor [W/(m2srµm)].
In order to calculate the TOA planetary reflectance, equation 10 was used.
Where π = Mathematical constant equal to ~ 3.14159 [unitless], L λ = Spectral radiance at the sensor's aperture [W/(m2srµm)], d = Earth-Sun distance [astronomical units], ESUN λ = Mean exoatmospheric solar irradiance [W/(m2µm)] and θ s = Local solar zenith angle.
The results obtained were used to fill the information gaps regarding Landsat 7 ETM+ image. A Landsat 8 OLI image of March 25th, 2014 was used to conduct this procedure. This scene presents the date closest to the Landsat 7 ETM+ image of April 2nd, 2014 in such a way that the Landsat 8 OLI image helps to cover the missing information in the Landsat 7 ETM+. In the Landsat 8 OLI image and prior to the match between images, the digital numbers of the pixels were converted to reflectance values. The algorithm used was the Landsat Gapfill with the subroutine of "two band gap fill (local histogram matching)" (USGS, 2004).
Immediately, a masking was generated to separate the land of the water from the threshold of the Band 5 of Landsat 7 ETM+ image. The water surface isolated by the mask was used to generate a false-color image by the method of Optimum Index Factor (OIF) to determine the most informative three-band combination (Chávez et al., 1982; Chávez et al., 1984). The following formula was used to calculate the OIF.
Where OIF is the optimum index factor, σ(i) is the standard deviation of i band, r(j) is the value of correlation coefficient between any two bands.
Finally, a statistical analysis was conducted to establish the most representative color for each one of the groups obtained from their hydrogeochemical characteristics. Besides, the spectral signature of each group was generated from the reflectance data extracted from the different bands of the Landsat 7 ETM+ image.
3.-RESULTS
3.1 Geochemical data and Cluster analysis
The dataset presented in Table 1 shows the statistics data of the pollutants registered from the water samples. From this data, a cluster analysis was generated. This kind of procedure uses a series of multivariate methods to find groups of data. The hierarchical approach of cluster analysis has the advantage of not demanding any prior knowledge of the number of clusters (Fraley &Raftery, 1998). A dendrogram shows the distribution of quality water groups defined by the cluster analysis (Figure 3).
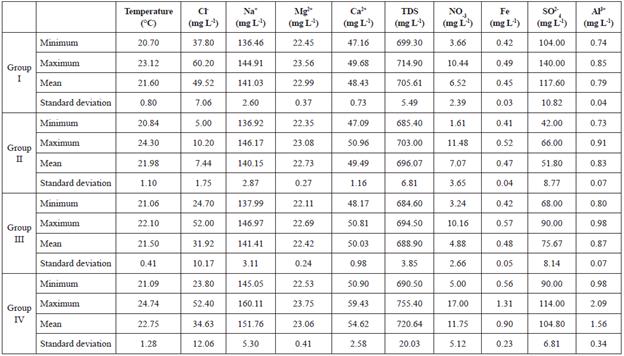
The cluster analysis identified four groups in the Chapala Lake (Figures 3 and Table 1). The Group I is distributed on the West side of Jocotepec. The Group II is in front of the town of Chapala. The Group III is between Tizapan and Ocotlan. The Group IV is in the Eastern portion of the lake, toward the entrance of the Duero river. Although, this last group is classified into two subgroups of the dendrogram, it falls under the same group because they have a similar chemical behavior for chlorides, but a different concentration of fluoride.
3.2 Relationship between spectral response and distribution of groups of water.
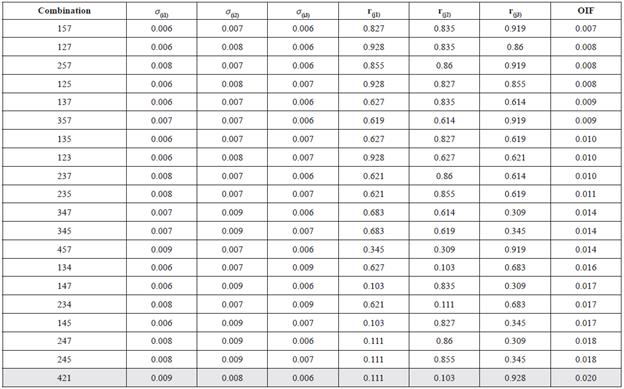
The Optimal Index Factor analysis (OIF) established bands 1, 2 and 4 as the optimal group of bands to highlight the most significant variability of quality water for Chapala Lake (Table 2).
Table 2 Calculation of OIF to establish the best combination of three bands: σ(j1), σ(j2), and σ(j3) are the standard deviations of three bands used in the calculation; r(j1), r(j2), and r(j3) are the correlation coefficients between the different pairs of bands generated in each combination. The combination with greater OIF will show the most extensive variability of colors.
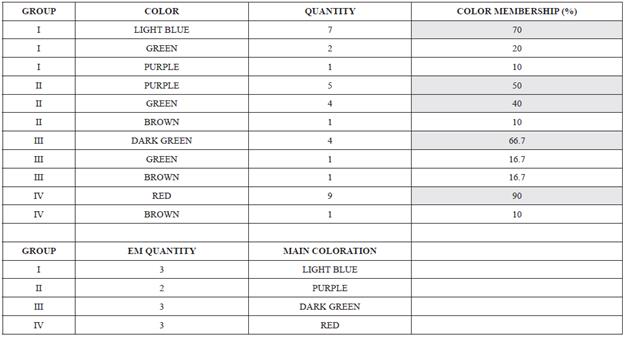
The image obtained with combination RGB 421 is used to test the presence of 6 different colorations in the Chapala Lake. The predominant color for each group is shown in Table 3.
Table 3 Statistical data about membership color. The highest percentage of points in each group regarding the color observed in the satellite image are indicated in yellow color. EM (End member).
The color red occurs primarily on the Eastern edge of the lake (Figure 4). This coloration is related to the contributions of the Lerma and Duero rivers. The spectral response of this area corresponds to samples interpreted as Group IV (ternary mixture) and characterized by a non distinct pattern in the variations of fluoride (F-) and chloride (Cl-) (Figures 4 and 7). The spectral signature shows the highest values of reflectance in the region situated between 830 and 1300 nm and, the shortwave infrared region present the lowest values concerning the other three groups (Figure 5).
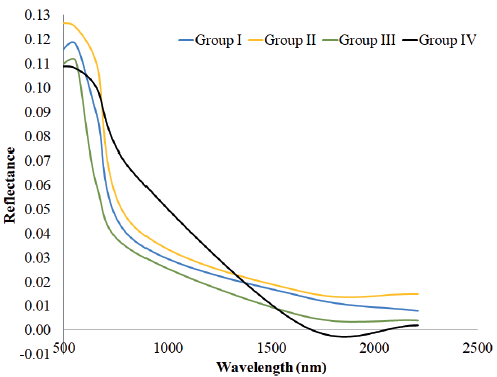
Figure 5 Spectral signature of each group of water mixes. The spectral behavior was extracted directly from the Landsat 7 ETM+ image from April 2nd, 2014.
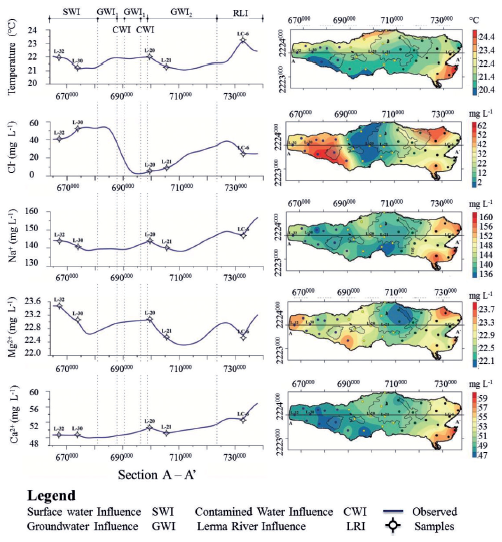
Figure 6 Variability maps of a) temperature, b) pH, c) Na+ (sodium), d) Mg2+ (magnesium) and f) Ca2+ (calcium), in the Chapala Lake. The graphics on the left side show the E-W hydrogeochemical sections.
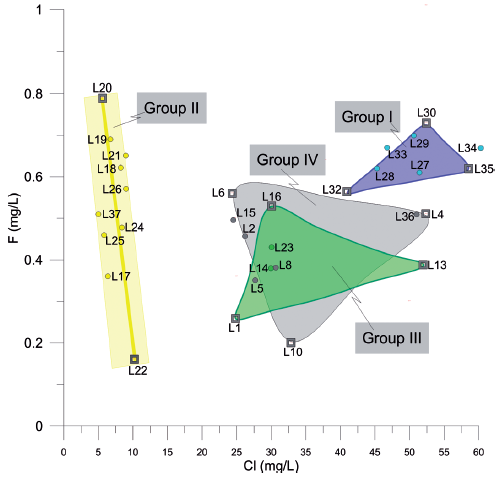
Figure 7 Diagram of Cl- vs F- from the samples of Chapala Lake. EM have been marked with a black frame bordering the circle that represents the sample.
Towards the eastern part of the lake, a dark green coloration is presented, which can also be observed to a lesser extent in the western central part (Figure 4). This color coincides with the samples belonging to Groups II and III, considered as binary and ternary, respectively (Figure 4). The Group III is more concentrated in areas of greener colorations, while Group II occurs in areas whose spectral response is purple and green. The light blue and green colorations are concentrated in the central and eastern part of the lake (Figure 4). This coloration is related mainly with samples belonging to Group I, corresponding to a binary group, and characterized by high values of F- and Cl- (Figures 4 and 7). The spectral signatures of groups I, II and III have similar patterns. The highest values of reflectance correspond to group II; the middle values are for group I and group III presents the lowest values of reflectance (Figure 5).
In Figure 4 the main polygons delimiting the contribution of groundwater are marked. In figures 6 and 8, the hydrogeochemical sections show the influence on the water quality of the different sources of input to the Lake of Chapala.
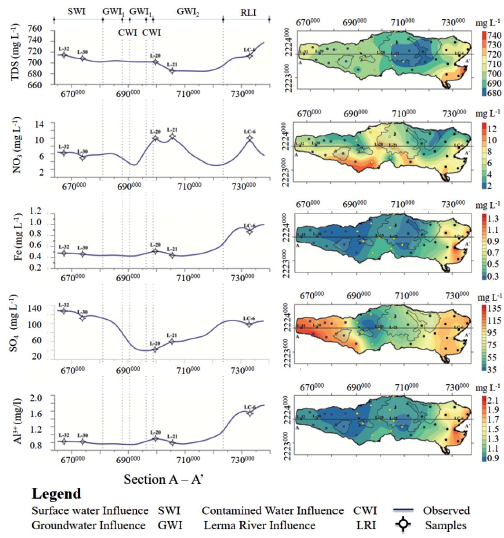
Figure 8 Variability maps of a) TDS (total dissolved solids), b) NO3 -, c) Fe (Iron), d) Ba2+ (Barium) and f) Al3+ (Aluminium) in Chapala Lake. The graphics on the left side show the E-W hydrogeochemical sections.
The influence of Lerma River (RLI) to the East of the lake can be observed, which is diluted by contributions from groundwater (GWI1 and GWI2) in the central part, where variations depend on ingress of polluted water from nearby towns (CWI). In the West Lake, the chemical composition is altered by the entry of surface water (SWI).
The end members of Group I can be easily identified because each one of them presents color variations. For instance, the sample L-32 is located in an area that presents light blue colorations. The sample in group I (Figures 7 and 8) is characterized by having the lowest values of F- and Cl-(Figures 4, 6 and 7) and the highest values of NO3 - and Al3+. The end member L-30 is located in an area that presents light blue and light green colorations. This sample presents intermediate values of Cl- and the highest values of F- for this group (Figures 4 and 7). The third end member, L-35 is located in an area that presents dark-green colorations. This sample is characterized by the highest values of Cl-, intermediate values of F- (Figure 8) and the lowest values of temperature, Na+, Mg2+and NO3 - of Group I (Figures 6 and 8).
The end members of Group II are samples L-20 and L-22. In the case of the L-20 sample, this occurs in an area of dark blue color and is characterized by the lowest values of Cl- and the highest values of F- (Figures 4 and 7). In addition, this sample contains high values of NO3 - and Mg2+ and the highest values of temperature in the central zone of the lake (Figures 5 and 7). The sample L-22 is located in an area of green and blue color, which contains the highest values of Cl- and NO3 - and it has the lowest values of F- and Al3+for Group II (Figures 4, 6, 7 and 8).
For group III, the end members are: L-1, L-13 y L-16. The sample L-1 is located in a region that presents a greyish blue color. In this sample are intermediate values of Cl-, the lowest values of F- and NO3 -, and the highest values of Al3+ (Figures 4, 6, 7 and 8). The sample L-13 is located in an area of intense blue color. It is characterized as having the highest values of Cl-, intermediate values of F-and NO3 - and high values of Al3+. The third end Member (L-16) is characterized by a bluish green color. This sample presents intermediate values of Cl-, the highest values of NO3 - and F- and intermediate values of Al3+ (Figures 4, 6, 7 and 8).
All the end members of group IV show a red color. The sample L-10 presents the lowest values of F-, intermediate values of Cl- and NO3 - and high values of Al3+ (Figures 4, 6, 7 and 8). The sample L-6 is characterized as having the highest values of F-, intermediate values of Cland high values of NO3 - and Al3+. The third end Member (L-4) presents high values of F- and Cl-, the low values of NO3 - and intermediate values of Al3+ (Figures 4, 6, 7 and 8).
3.3 Hydrogeochemistry Characterization
Kriging interpolation obtained the distribution of different physical and chemical components of water in Chapala Lake. The maps of the variability showed that the concentration of these components in the lake is not homogeneous and not gradual. Towards the Eastern part of the lake in the mouths of Duero and Lerma rivers are the highest values of chemical components. Then, towards the central part, there is a decrease or increase interrupting the first trend observed in the eastern part and once again, the trend changes to the west side of the lake (Figures 6 and 8).
In general, all physical and chemical components present higher values in the Eastern edge of the lake and the lowest values in the Western part. There are some exceptions where Cl- and Mg+2 have the highest values in the Western side of the lake and NO3 -has the highest values toward the central part of the lake (Figures 6 and 8).
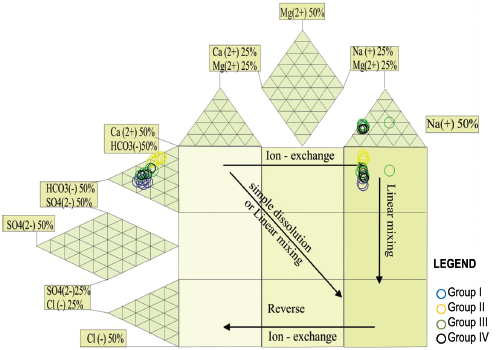
Durov expanded diagram (Figure 9) shows the relationship between different groups of water. The samples located in region 3 indicate the predominance of Na-HCO3. Furthermore, a linear distribution was observed, that is, there is a little variation in anions and cations. Based on the distribution of samples in Chapala Lake, it can be suggested that the primary process in the lake water is the mixture between groups of different water quality (Figure 7).
Gibbs diagram used for the study of surface water shows three regions based on the chemistry of water: Rain (Precipitation domain); Weathering reactions (water-rock); and Evaporation-crystallization process (Gibbs, 1970).
The composition of the global rain dissolved solids concentrations is found in the lower right corner (Figure 10). Groundwater has increased due to water-rock interaction caused by weathering, thereby, increasing the proportion of dissolved solids concentrations and affecting the Calcium - Sodium Bicarbonate and Chlorides content. Finally, evapotranspiration in farming areas or dry surfaces receiving subsurface water runoff from the agricultural return, elevate the content of Na+ and total dissolved solids (TDS). Similar results were reported for lakes Nakuru, Elementaita and Naivasha in Kenya (Njenga, 2004).

Figure 10 Gibbs diagrams for the samples of Chapala: a) TDS - Na / (Na + Ca) and b) TDS - Cl / (Cl + HCO3).
The diagram Gibbs diagram was with samples of Chapala Lake (Figure 10), which are distributed horizontally in the domain of water-rock interaction, and it can invariably be interpreted that groundwater influences the process of mixing water in the central region of the lake. In Figure 9a (TDS-Na / (Na + Ca)), little variation in TDS and greater variation in Na / (Na + Ca) is due to water-rock interaction. In Figure 9b (TDS - Cl / (Cl + HCO3)), linear movement towards the water-rock interaction is also observed.
In general, the graph of Gibbs showed that the water of Chapala Lake has mixing processes with groundwater due to water-rock interaction. On the other hand, groundwater flows discharging into Chapala Lake are poorly understood and are only visible at close range.
To understand these variations and origin of groundwater, the mixture models were used, considering it as a system consisting of EM, that is, those with the minimum and maximum concentrations in the system. Two conservative elements (Cl- and F-), which do not react in the system was used to identify the EM.
4.-DISCUSSION
The relationship between the different EM; generate mixing groups of water into the lake, which when combined give rise to the chemical composition in different areas of the lake. Mixtures of water in surface water bodies and groundwater have been extensively studied by other authors (Barthold et al., 2011; Long & Valder, 2011; Hooper, 2001; Barth &Veizer, 2004; Moran-Ramírez& Ramos-Leal, 2014). In addition, some of the findings regarding the sources that determine the water quality in rift lakes have been discussed for Africa (Rango et al., 2009; Ndungu et al., 2015). However, Chapala Lake is not yet a standard for this type of analysis. In this paper, four groups were established based on their mix of water which has different qualities, using various statistical and geospatial analysis methods.
Group I, distributed to the West edge of the lake, is a ternary mixture composed of EM A1 = L-32, A2 = L-30 and A3 = L-35 which has little variation of F- (0.5 to 0.7 mg L-1) and a more significant difference in Cl- (37 - 60 mg L-1). The L-32 sample (West of lake and NE of the Tesistan town) is influenced by surface currents flowing into the lake from Sierra of Tesistan. L-3 (West of lake and NE of Soyatlán) shows high values of Cl- and is related to groundwater flow. The L-30 sample, located in South of Cosala, represents the EM of surface water.
Group II exhibits linear dispersion in ME. L-20 and L-22 both have little variation in EM Cl- (5 to 10 mg L-1) and larger variation in F (0.2 to 0.8 mg L-1); the sample 20 is located at the center of the lake and is associated with groundwater flow. The origin of this groundwater flow is associated with the fracturing generated during the development of Chapala rift. This behavior is similar to that observed by Rango et al., (2009) in the region of Ziway-Shala, where the highest concentrations of F- were related to the interaction water-rock derived from the rift environment. On the other hand, the L-22 located at the south-central portion of the lake shows low values of F- and Cl- associated with slightly contaminated water discharges in the town of Tizapan.
Group III represents a ternary mixture between EM, L-1, L-13 and L-16. The L-1 shows relatively low values of F- (0.3 to 0.5 mg L-1) and Cl- (24-52mg L-1), located in the Eastern part of the lake, near the discharge of the Lerma river and is associated with contaminated surface water at the mouth of the Lermariver. The L-13 is located at the eastern part of the lake near the northern edge of the lake, and is related to groundwater flow. The L-16 sampling location is in the eastern part of the lake near the northern edge of the lake, while the water quality of this location is mainly influenced by groundwater flow. This group like the group II have low values of F and Cl-.
Group IV to Group III share similar characteristics, but samples of this group are located in the eastern part of the lake and are associated with the direct discharge of the Duero and Lerma rivers. This group has a ternary mixture with the end members samples, L-10, L-6 and L-4, with variations in the values of F- (0.2-0.6 mg L-1) and Cl- (23-52 mg L-1). Although, the sample L-10 is close to the discharge area of the Lerma river, it has contributions from superficial water from the town of Palma. This sample has relatively low values of F-, which helps to ascertain that the contribution of surface water have also been observed in other bodies of water. Moreover, the L-6, located in the Eastern part of the lake is related to the direct input of the polluted waters of the Lerma river and its dynamics is of little movement. For this reason, high values of F-, Cl- intermediate values and high values of temperature, NO3 -, Fe and Al3+ are presented with respect to other samples from Chapala. The L-4 is located in the NE part of the lake and is related to polluted waters of the Lerma river. This sample shows high values of Cl-, Na+, Mg2+ and Al3+. The chemical complexity and variability of these groups are similar to that reported by Chemet et al., (2001) for some Lakes of Ethiopia and for two Estonian shallow lakes (Tuvikene, 2018).
Considering the fractions of the mixture for each sample of Group I, EM A1 corresponding to contributions of surface water contributes 52%, the A2 related to the entry of groundwater in the lake participates with 38% and A2 also associated with another entry of groundwater flow in the lake contributes 10% (Table 4).
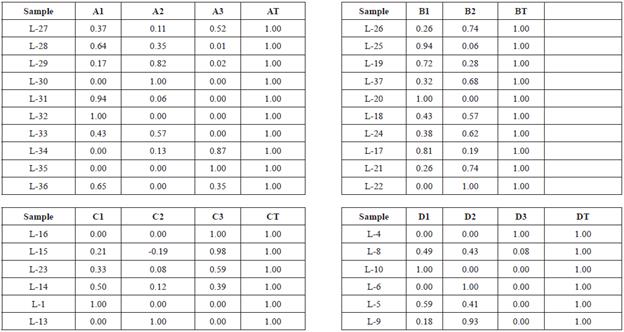
In Group II, the EM B1 corresponding to contributions of groundwater provides 58%, the B2 related to contaminated water in the lake, near the town of Tizapan, participates with 42% (Table 4).
In group III, the EM C1 corresponding to contributions of contaminated water provides 34%, the C2 related to the entry of groundwater into the lake participates with 20% and C3 also associated with another entry groundwater flow in the lake contributes 46% (Table 4).
In group IV, the EM D1 corresponding to water contributions preceding contamination of the town of Palma provides 45%, the D2 related to the entry of contaminated water from the Rio Lerma participates with 53% and D3 also associated with the entry contaminated water from the town of Ocotlan contributes 2% (Table 4).
From the fraction of mixture, which is based on each of the ends in the groups, the chemical composition of members in each sample is obtained from the system and chemical reactions are not considered in this mixing process.
The comparison between the estimated fractions from mixing and the chemical composition of the actual sample data (Table 5), reveals that there are slight variations between the two results.
Table 5 Ion difference between measured samples and calculated values for Groups I, II, III, and IV.D: Difference symbol.
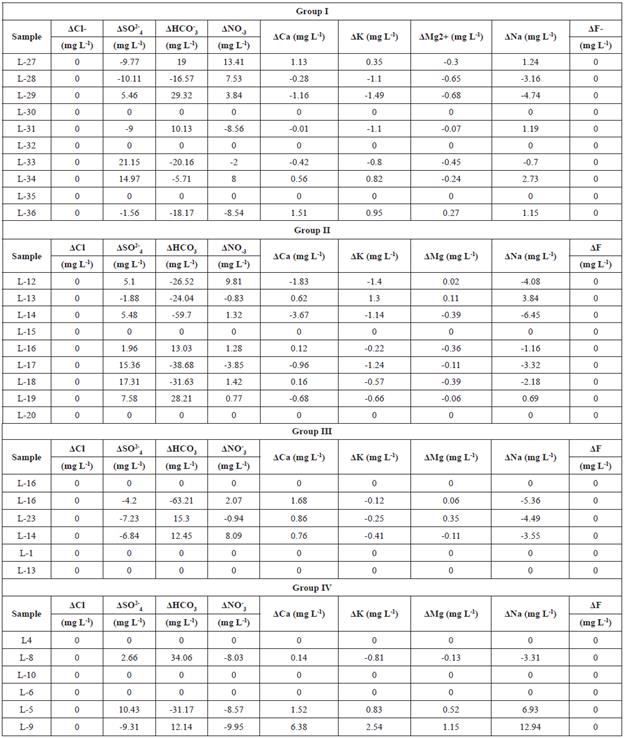
In some individual cases, the ionic delta may be close to zero indicating the mixture as the dominant process in the system. In other cases, differences between some parameters of actual and estimated samples were observed, this behavior is related to other inputs of organic matter in the lake water as discussed in the work of Trujillo-Cardenas et al., (2010). Moreover, discoloration observed in Chapala corroborates the presence of water in different compositions. Some of these compositions correspond to contaminated water, which has already been reported in Chapala Lake for other works (Vargas and Mollard, 2005; Hernandez-Garcia, 2006; Cifuentes et al., 2011). As in other studies, a relationship between the colorimetry of water and physical-chemistry composition was observed in Chapala Lake, thus having different compositional areas, based on the color displayed by combining three bands of Landsat 7 ETM+ (Kallio et al., 2008; Verpoorter et al., 2012; Fukushima et al., 2014). The results of variability observed with the Landsat image are consistent with the data obtained from multivariate analysis and geostatistical estimations. Therefore, there is a consistency in the results obtained by the different techniques applied in this study. Also, in this paper, it was shown that Landsat images are deemed suitable for spatial observations of shallow water quality. This observation is consistent with that reported by Giordiano et al., (2014) for Garda Lake.
Finally, the hydraulic barrier related to the tectonic origin, and the interactions among the different groups of water quality of Chapala Lake suggest the implementation of management plans which consider the significant contributions from groundwater to the system of the lake as an advantage for the control of contaminated effluents.
5.-CONCLUSIONS
Tectonic origin of Lake Chapala influences water mixing processes developed into the lake. This condition was verified by applying different techniques, such as multivariate analysis, geostatistical estimation and geospatial visualization with satellite images. The results obtained by the different methods are in agreement with each other.
Four mixing groups were identified, associated with the origin of the sources that feed Lake Chapala. Group I has a strong influence on surface water. The main contribution of group II is groundwater. Group III is powered mainly by contaminated waters of the Lerma River. Group IV has as main tributary the Duero river.
The groundwater contributions toward the central part of the lake, operate as a hydraulic barrier, which prevents the progress of pollutants from Lerma river, either by its thermal gradient and by the large volumes of groundwater discharged into the middle of the lake, diluting the pollution in the central and western parts of the lake.
The Lerma river has significant contributions of contaminated water on Chapala Lake. Nevertheless, the primary pollution is only perceived in the eastern portion of the lake, thus confirming that not all the contamination of the Lerma river is distributed throughout the lake. The flow of the Lerma river practically continues directly on the Santiago river, so the most contaminated water is sent to the metropolis of Guadalajara.
Some effects of contamination are also related to the discharge of municipal waters of some populations, chiefly on the Southern border of the lake. The contributions of surface water to the West and Northwestern part of the lake come from the mountainous areas close to the lake.
The diagrams of Gibbs and Durov-expanded helped to identify the processes of interaction of water-rock into the lake. Alternatively, multivariate analysis allowed the identification of four groups whose EM represent changes in the chemical composition of the water due to contributions of sources of different chemical nature. The results obtained by different methods showed the mixing of water of different origins as the dominant process for Chapala Lake. However, in some cases, the microbial activity and the organic matter alter the chemical composition of these mixtures.
The image of false color (RGB) allows the confirmation of different inputs of water on Chapala Lake. The colors observed are the product of the spectral behavior of the water, which can be related to the different chemical compositions found in Chapala Lake. This result is also corroborated by other methods explored in this study as the diagrams of Durov-expanded, Gibbs and the diagrams of Cl- vs. F-. The spectral signatures of the four groups show marked differences in the values of reflectance and, group IV show a spectral behavior characterized by high values of reflectivity in the range from 830 to 1300 nm. This response is not present to the rest of the group.
The results of this study suggest that the chemical variability of the lake is not only due to human activity. In the region, there are at least four factors that contribute to the chemical character of the water in the lake. In the Western portion of the lake, the surface water is the primary source. In the central part of the lake, the groundwater is the dominant source, and in the East region of the lake, the contaminated water of the Lerma River is the main contributor. Also, there are the contributions of polluted water from the urban areas along the whole shoreline of Chapala Lake. The dynamics observed in the Chapala Lake suggests the implementation of management plans which consider the tectonic origin of the lake with its substantial contributions from groundwater as an advantage for the control of pollution from human activity.
This work also made it possible to differentiate between the dynamics of Chapala Lake regarding the rift lakes of the world. Although, the tectonic scenario is similar for all places, the environment and social issues are different, which determines its significant differences in chemical variability and water quality. However, the mechanism of the interaction surface water and groundwater is similar in all cases.