English (pdf)
 Article in xml format
 Article references
 Send this article by e-mail
 Cited by SciELO
  Cited by Google
  Similars in
SciELO
Similars in
SciELO  Similars in Google
 Permalink
Introduction
The Erzincan Basin is the largest sedimentary basin on the North Anatolian Fault Zone (NAFZ). Many earthquakes have ruptured the NAFZ within the Erzincan Basin and caused major damage. In the last century, there were two of them (Ms = 8.0 in 1939 and Ms = 6.8 in 1992) (Barka and Kadinsky-Cade, 1988; Fuenzalida et al., 1997). The 1992 event claimed 541 lives (Barka and Eyidoğan, 1993) and had a peak ground acceleration of 0.5 g, and the Mercalli intensity was estimated as IX (Erdik et al., 1992; Gundogdu et al., 1992). Pinar et al. (1994) pointed out the 1992 earthquake have occured at the eastern end of 1939 earthquake in 350 m long rupture zone. The amount of amplification depends on the thickness and geometry of the basin. Geophysical constraints can be used to image basin depth and causative discontinuties. The seismic hazard in Erzincan from future earthquakes on the NAFZ is significant because the unconsolidated sedimentary basin can amplify the ground motion during an earthquake (Kaypak, 2008).
The analysis of Bayrak et al. (2005) suggested that earthquakes up to magnitude 7.5 could be expected in the Erzincan Basin, and Hartleb et al. (2006) estimated the earthquake recurrence interval as 210-700 years from paleoseismic studies.
The strength of ground motion depends primarily on the thickness of sediments in the basin, with the largest amplification occurring in the deepest parts of the Electronic supplementary material. The thickness and shape of the sedimentary basin are important parameters to predict the amplification of the ground motion. Furthermore, the depth of the basin is an important parameter for improving 3D earthquake relocation (Aktar et al., 2004). Several seismic tomography experiments have attempted to map the thickness of the Erzincan Basin. Some of these studies used the 1992 aftershocks and reported the thickness of unconsolidated sediments as 2-4 km. They determined that the boundary between the upper sedimentary layer and basement was at a depth of 6-12 km. (Aktar et al., 2004; Gokalp, 2007; Kaypak, 2008).
The region's evolution was won by the closure of Paleo-Tethys and its emplaced Karakaya Ocean before Liassic, and the different arms of the Neo-Tethyan Ocean at the end of Cretaceous. After the Neo-Tethys closure, the area became largely land and covered with shallow seas in Eocene and Lower Miocene. Both marine environments, however, did not have a long life due to the thrusted structure and rise of the zone with a north-south compression. In the neo-tectonic period beginning from the end of the Lower Miocene, the escape tectonics of the region were effective and lateral strike-slip faults with different strike and extension were developed (Barka and Gulen, 1989).
Hartleb et al. (2006) conducted paleosismological studies on Çukurçimen on the NAFZ in the north-western part of the Erzincan Basin. They say that there are at least six and possibly seven or more surface fractures over the last 3500 years. In the last 2500 years time period, there are five surface fractures in the earthquakes that have occurred in this region and that the interval of earthquake recurrence has changed between 210-700 years.
Kaypak and Eyidoğan (2002, 2005) have studied to determine the upper crustal velocity of Erzincan and its surroundings. When new aftershocks calculated by the seismic velocity structure are examined, they have found that they usually fall on the North Anatolian Fault Belt, but the seismic activity is directed to the south towards Pülümür. These studies reveal that there may be a new zone of weakness between the southern part of the basin and Pülümür. They have identified six layers at different seismic velocities in the Erzincan Basin, 20 km above the shell. In addition to the aftershocks of the 1992 Erzincan earthquake, the regional seismic activity after the 2003 Pülümür earthquake indicated that a new fault called the Avcidag Fault antithetically to the North Anatolian Fault Zone similar to the Ovacik Fault developed.
Akpinar et al. (2016), paleomagnetic samples were taken from the lavas in the Quaternary volcanic outlet centers closely related to the NAFZ, especially on the northern edge of the Erzincan Basin. When paleomagnetism results of samples taken from 43 different stations in Erzincan Basin are examined, it is seen that all of the samples show a positive inclination value and thus contain a normal polarity. These results show that all of the young volcanic rocks in the Erzincan Basin are in Brunhes Chron.
Berge-Thierry (2001) simulated the 1992 Erzincan depremination with kinematic source model. They did this work for a 60 km x 60 km area, including the Erzincan Basin, and as a result they formed theoretical acceleration map. According to the results obtained from this map, especially the western part of the basin has shown that the level of strong ground movements that can occur in the future will be higher than 1992 level.
Volcano-sedimentary Guaratubinha Basin in southern Brazil was evoluted in late Neoproterozoic due to collisional strike-slip tectonics. Aeromagnetic anomalies were investigated to present fault lines with similar methods in this study (Barao et al., 2017).
The aim of this study is to determine depth and geometry of the basin and extention of the buried surface fractures that may have developed during the historical period, which can not be detected any geomorphological and geologic signs in the surface of the young basin fill deposits today. Within the scope of this study, data obtained from geophysical studies were evaluated by geophysical and geological studies carried out in Erzincan Basin to date.
Erzincan Basin is modeled in three dimensions using gravity data of the study area. Thus, the deep structure of the Erzincan Basin has been determined, and derivation based boundary detection filters have been applied to the gravity data to reveal the discontinuities and geological boundaries of the region. The obtained information was compared with the existing surface geology and the compatibility between the formations was checked. In addition to the discontinuities determined from surface observations, new discontinuities were found in the light of the obtained results.
General Geology of Erzincan Basin
The Erzincan Basin is the largest of several strike-slip basins formed along the NAFZ on the pre-Pliocene basement located on the sidelines of the Eurasian plate and Anatolian plate. Pre-upper Cretaceous (Aktimur et al., 1995) or pre-Maastrichtian (Rice et al., 2009) basement is divided into two divisions comprising northern and southern blocks (Aktimur et al., 1995). The northern block includes Permo-Triassic metamorphic rocks, Liassic-Dogger volcano-sedimentary rocks and Upper Jurassic-Cretaceous limestone, marl and clay. The southern block is composed of Permian to Cretaceous limestones underlain unconformably Palaeozoic metamorphic rocks consisting of gneiss and muscovite-quartz-calc schists (Aktimur et al., 1995; Okay and Sahinturk, 1997; Rice et al., 2009) (Figure 1). Ophiolitic nappes of Lower Campanian-Lower Maastrichtian rock units are also observed in both blocks (Yilmaz, 1985; Aktimur et al., 1995; Kocyigit et al., 2001; Rice et al., 2009).
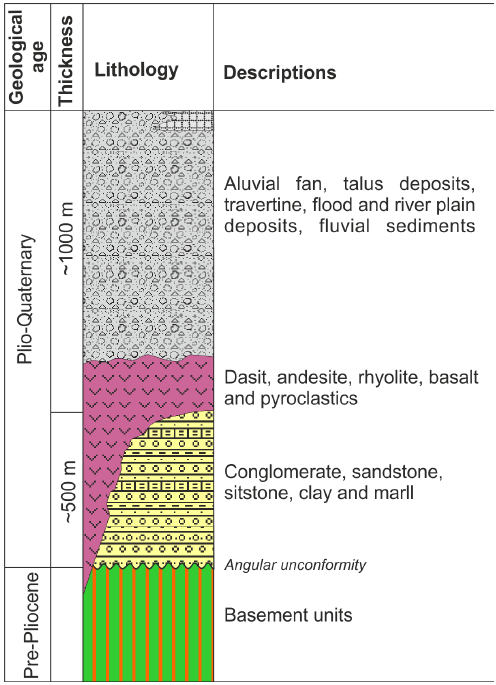
Figure 1 Generalized stratigraphic section of the study area and its vicinity (modified from Aktimur et al., 1995).
These older units in the study area is unconformably covered by Upper Cretaceous-Early Eocene turbiditic calcarenite, sandstone, laminated mudrock, volcaniclastic sedimentary rocks that includes rare andesitic lava (Yilmaz, 1985; Aktimur et al., 1995; Kocyigit et al., 2001; Rice et al., 2009). The youngest part of the basement is Miocene cover rocks including limestone, marls, green clay, evaporites and fluvial deposits (Tuysuz, 1993; Westaway and Arger, 2001; Kocyigit, 2003; Rice et al., 2009) overlay pre-Eocene units.
The Erzincan Basin is filled by Plio-Quaternary sediments consisting of playa deposits, clastics and basin margin conglomerates. The conglomerates along the NW margin of the basin are composed of ophiolitic melange clastics and Cretaceous-Miocene carbonates (Barka and Gulen, 1989). The thickness of the basin infill is a controversial subject and changes from 500 to 4000 m (Irrlitz, 1972; Hempton and Dunne, 1984; Buyukasikoglu, 1992; Gaucher, 1993; Bernard et al., 1997; Aktar et al., 2004; Kaypak and Eyidoğan, 2005; Gürbüz, 2010; Avsar et al., 2013) (Figure 2).
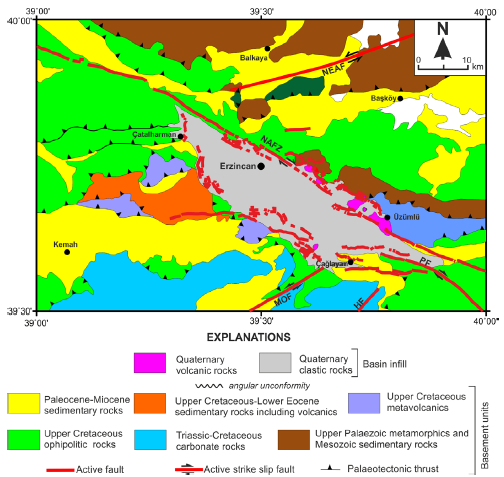
Figure 2 General geological map of Erzincan Basin and its surrounding (modified from Tarhan, 2002; Rice et al., 2009; Emre et al., 2012; Akpinar et al., 2016). HF: Heltepe Fault, NAFZ: North Anatolian Fault Zone, NEAFZ: North Eastern Anatolian Fault Zone, MOF: Malatya-Ovacik Fault, PF: Pülümür Fault.
Tectonics and seismotectonics of the study area
It is known that the volcanic outcropping centers with Neogene-Quaternary age on the north side of the Erzincan Basin, which is one of the youngest sedimentary basins developed on the NAFZ which is one of the most active strike-slip fault zones in Turkey, are closely related to the NAFZ. The Erzincan Basin is different from the other basins on the NAFZ due to its long axis being NW-SE and related with young structures. The NW-SE extent of the basin is parallel to the extent of the NAFZ and the main segment of the NAFZ extends along the northern edge of the Erzincan Basin. The volcanic cones lined up along the northern margin present an approximate parallel to the course of this main segment. The NAFZ contains three main segments in the region (Figure 3). The location and geometry of these segments is important for understanding the origin and development of the Erzincan Basin (Akpinar, 2010).
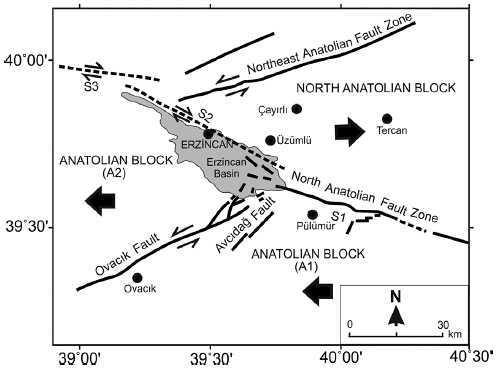
Figure 3 Tectonic blocks in Erzincan Basin and surrounding area and the direction of movement of these blocks (simplified from Barka and Gulen, 1989; Barka and Eyidoğan, 1993; Kaypak and Eyidoğan 2002). S1, S2 and S3 are the segments of the North Anatolian Fault Zone (NAFZ) (Akpinar, 2010).
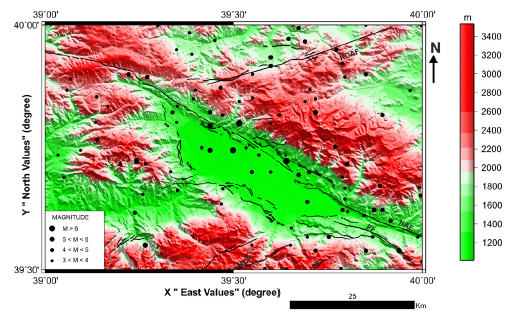
The eastward movement of the Northeast Anatolian Block causes complex deformations for the block and the left-lateral movements in the Northeast Anatolian Fault Zone (NEAFZ), which forms the northern boundary of this block. The left-lateral strike-slip Ovacik fault intersects with the NAFZ in the southeast of Erzincan Basin. The Erzincan Basin is a NW-SE directional pull-apart type (Allen, 1969) with a length of about 50 km and a width of up to 15 km. The part of the NAFZ near Erzincan consists of many segments. The first of these segments extends from Karliova to the west of Yedisu and the second extends from the west of Yedisu to the southeast end of Erzincan Basin. The third constitutes the northeastern border of the Erzincan Basin and continues northward with a second segment. The geological and seismic properties of these fault segments are discussed in detail (Allen, 1969, Toksoz et al., 1979). The North Anatolian Fault Zone (NAFZ), Northeast Anatolian Fault Zone (NEAFZ) and Ovacik Fault (OF) form the most important tectonic structures in this area, forming a geometric conjugation with each other in the Erzincan Basin and its immediate vicinity. Most ofthe historical earthquakes are closely related to these three major faults movements. Earthquake distribution and topographic map of the study area are given in Figure 4.
Gravity Data and Process
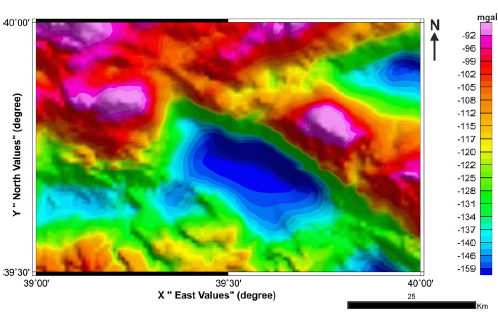
Gravity data for the study area was obtained from the General Directorate of Mineral Research and Exploration (MTA) with a spacing of 2.5 km measured annually ground survey campaigns in 1970s and all corrections were made by the MTA. The density value of 2.67 gr cm-3 was reconstructed according to the density value of 2.40 gr cm-3 for the reason that the basin filling material is composed of alluvium. The gravity anomaly map of the study area is given in Figure 5.
Upward continuation
The effects of the infinite number of masses at different depths and at different points of the earth are measured as gravity anomalies on the surface. The gravity values measured from the surface are gravity anomalies originating from the densities of the masses found both on the surface and in the deep. In order to detect the anomalies originating from the masses in deep, the effect of shallow masses close to the surface must be removed, for which the "upward continuation" method has to be applied.
Potential area farther from the source at any point of the known potential area on the surface can be calculated by upward continuation method. It is necessary to measure at different heights due to various reasons, but it is desirable that these measurements be at a certain level. The values are moved to a fixed surface with the upward continuation process. Furthermore, deep anomalies due to anomalies originating from the masses in the surface may not be observed clearly. In this case, the anomalies formed by the deeper masses are brought to a more prominent position by the upward continuation process (Blakely, 1995).
The effects on the anomalies of the shallow structures were removed and the structures in the vicinity were allowed to be seen clearly by the upward continuation method in this study. Upward continuation of 0.25 km, 0.50 km, 0.75 km, 1 km, 2 km and 3 km was applied to the gravity data shown in Figure 5. It was observed that many effects were lost for 2 km and 3 km according to other continuation applications in the data. For this reason, 0.25 km, 0.50 km, 0.75 km and 1 km upward continuation were taken into consideration.
Derivative methods
The subtle details in the potential field anomaly maps can be made more visible through some derivative based filters (Ekinci and Yigitbas, 2012 and 2015, Ekinci et al. 2013). Many boundary detection filters have been proposed to determine the boundaries of potential field sources. Application of total horizontal derivatives and analytic signal filters, the first generation of boundary detection filters, is now standard. Total Horizontal Derivative (THD) filter is given by equation (1) (Cordell and Grauch, 1985).
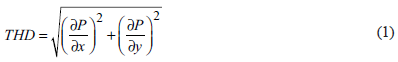
Where, P is the gravity field, x and y are directions. The highest amplitude values of the THD output pass over the source limits. The analytical Signal (AS) amplitude is given by Nabighian (1972) for the 2B state with Eq. (2), by Roest et al. (1992) for the 3B state with Eq. (3).
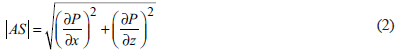
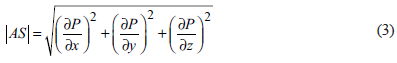
Where, P is the gravity field. x, y and z are directions. The AS filter is often used in potential area data collection especially for close surface exploration. The AS amplitude provides bell-shaped anomalies on the source structures. Researchers have developed filters under the heading of normalized derivative methods in recent years.
The first developed filter in this concept is the Tilt Angle (TA) filter and given by the following Eq. (4) by Miller and Singh (1994);
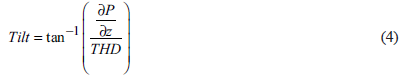
The TA is the normalized form of the vertical derivative proportional to the THD. The TA is a filter that gives the effects of both near surface and deep sources at the same amplitude level. The amplitude of the TA is positive when it is on the structure, zero when it is on the structure edge and negative values when it is outside of the structure. Amplitude values range from - П/2 to П/2 and are very easy to interpret on this. The TA is mainly a plan or shape-determining filter. For this reason, Verduzco et al. (2004) showed that the total horizontal derivative of the TA can be used to determine the boundary. Total horizontal derivation of TA is given by Eq. (5).
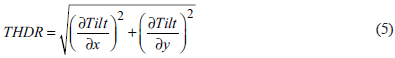
The total horizontal derivation of the TA causes an increase noise on data because of a derivation-based filter is calculated again. Another weakness is that it can not produce effective results against deep structures. On the other hand, the most useful feature is that it is independent of magnetization direction. For this reason, it is a filter that is often referred to in practice.
Another filter developed under the concept of normalised derivatives is Theta-Angle (Cosθ) filter. Theta Angle (Cosθ ) filter is given by Wijns et al. (2005) with Eq. (6)
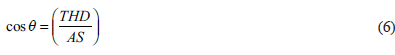
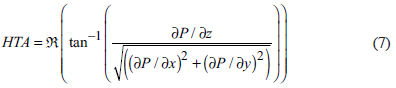
Theta Angle is the normalized form of THD using the analytical signal amplitude. Theta Angle ranges from 0 < θ < π/2. For this reason, it is quite easy to interpret. The weak point of the method is that it shows scattered effects of deep structures. Another approach is the Hyperbolic Tilt Angle (HTA) filter proposed by Cooper and Cowan (2006) and is given by Eq. (7).
In Figure 6, five derivative filters were applied to the gravity data which was applied 0.25 km upward continuation.
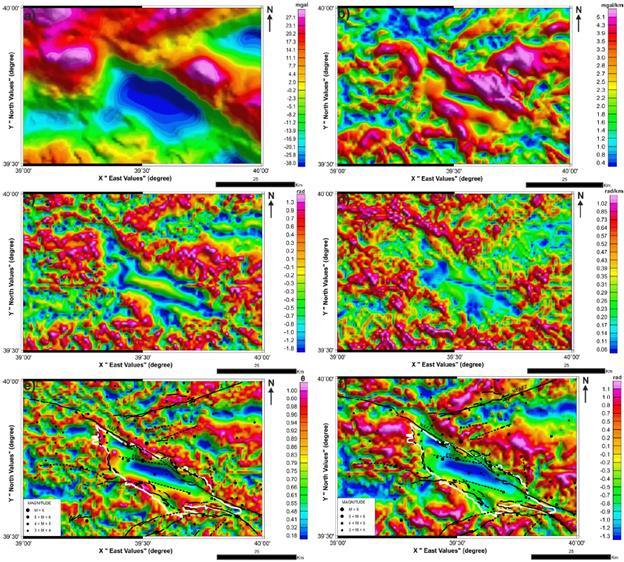
Figure 6 (a) 0.25 km upward continued gravity anomaly map (b) Application of Total Horizontal Derivative (TDH) filter applied to 0.25 km upward continuated gravity data shown in Figure 6a. (c) Application of Hyperbolic Tilt Angle Derivative (HTA) filter applied to 0.25 km upward continuation applied gravity data shown in Figure 6a. (d) Application of Total Horizontal Derivative (THDR) filter of 0.25 km upward continuation applied gravity data shown in Figure 6a. (e) Application of 0.25 km upward continuation applied gravity data Theta Angle Derivative (cos 8) filter shown in Figure 6a. (f) Application of Tilt Angle Derivative (Tilt) filter Aapplied to 0.25 km upward continuation applied to gravity data shown in Figure 6a. AF: Avcidagi Fault, EBF: Erzincan Basin Fault, HF: Heltepe Fault, NAFZ: North Anatolian Fault Zone, NEAFZ: North Eastern Anatolian Fault Zone, MOF: Malatya-Ovacik Fault, PF: Pülümür Fault. White line shows boundary of Erzincan Basin.
Five derivative filters were applied to the gravity data which was applied 0.50 km upward continuation. The map of the gravity anomaly applied to the derivative filters is shown in Figure 7.
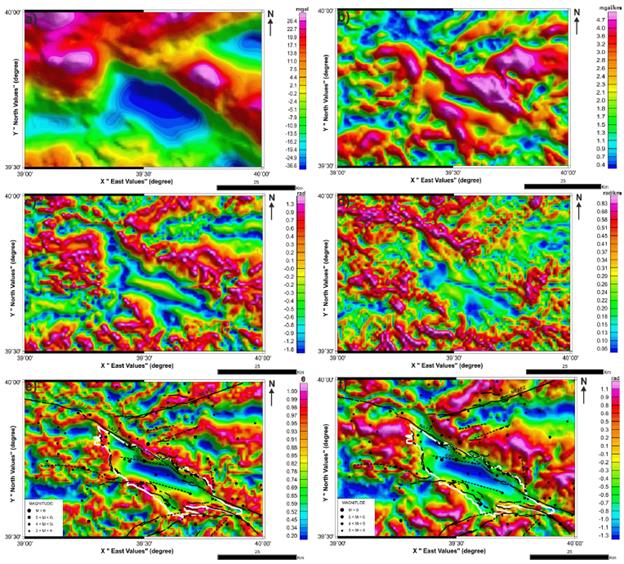
Figure 7 (a) 0.50 km upward continued gravity anomaly map. (b) Application of Total Horizontal Derivative (THD) filter applied to 0.50 km upward continuated gravity data shown in Figure 7a. (c) Application of Hyperbolic Tilt Angle Derivative (HTA) filter applied to 0.50 km upward continuation applied gravity data shown in Figure 7a. (d) Application of Total Horizontal Derivative (THDR) filter of 0.50 km upward continuation applied gravity data Slope Angle shown in Figure 7a. (e) Application of 0.50 km upward continuation applied gravity data Theta Angle Derivative (cos 8) filter shown in Figure 7a. (f) Application of Tilt Angle Derivative (Tilt) filter applied to 0.50 km upward continuation applied to gravity data shown in Figure 7a. AF: Avcidagi Fault, EBF: Erzincan Basin Fault, HF: Heltepe Fault, NAFZ: North Anatolian Fault Zone, NEAFZ: North Eastern Anatolian Fault Zone, MOF: Malatya-Ovacik Fault, PF: Pülümür Fault. White line shows boundary of Erzincan Basin.
Five derivative filters were applied to the gravity data which was applied 0.75 km upward continuation. The map of the gravity anomaly applied to the derivative filters is shown in Figure 8.
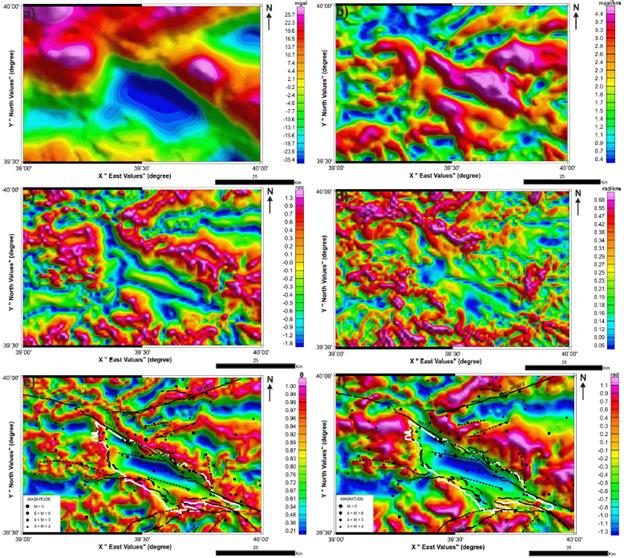
Figure 8 (a) 0.75 km upward continued gravity anomaly map. (b) Application of Total Horizontal Derivative (TDH) filter applied to 0.75 km upward continuated gravity data shown in Figure 8a. (c) Application of Hyperbolic Tilt Angle Derivative (HTA) filter applied to 0.75 km upward continuation applied gravity data shown in Figure 8a. (d) Application of Total Horizontal Derivative (THDR) filter of 0.75 km upward continuation applied gravity data Slope Angle shown in Figure 8a. (e) Application of 0.75 km upward continuation applied gravity data Theta Angle Derivative (cos 8) filter shown in Figure 8a. (f) Application of Tilt Angle Derivative (Tilt) filter Aapplied to 0.75 km upward continuation applied to gravity data shown in Figure 8a. AF: Avcidagi Fault, EBF: Erzincan Basin Fault, HF: Heltepe Fault, NAFZ: North Anatolian Fault Zone, NEAFZ: North Eastern Anatolian Fault Zone, MOF: Malatya-Ovacik Fault, PF: Pülümür Fault. White line shows boundary of Erzincan Basin.
Five derivative filters were applied to the gravity data which was applied 1.0 km upward continuation. The map of the gravity anomaly applied to the derivative filters is shown in Figure 9.
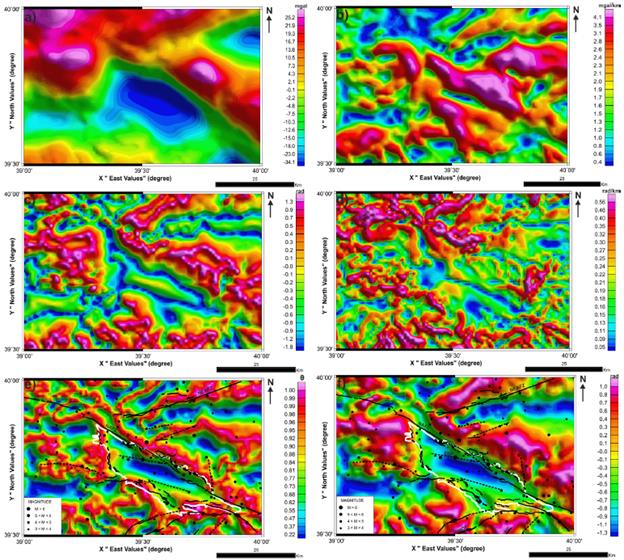
Figure 9 (a) 1.0 km upward continued gravity anomaly map. (b) Application of Total Horizontal Derivative (THD) filter applied to 1.0 km upward continuated gravity data shown in Figure 9a. (c) Application of Hyperbolic Tilt Angle Derivative (HTA) filter applied to 1.0 km upward continuation applied gravity data shown in Figure 9a. (d) Application of Total Horizontal Derivative (THDR) filter of 1.0 km Upward continuation applied gravity data Slope Angle shown in Figure 9a. (e) Application of 1.0 km upward continuation applied gravity data Theta Angle Derivative (cos 8) filter shown in Figure 9a. (f) Application of Tilt Angle Derivative (Tilt) filter applied to 1.0 km upward continuation applied to gravity data shown in Figure 9a. AF: Avcidagi Fault, EBF: Erzincan Basin Fault, HF: Heltepe Fault, NAFZ: North Anatolian Fault Zone, NEAFZ: North Eastern Anatolian Fault Zone, MOF: Malatya-Ovacik Fault, PF: Pülümür Fault. White line shows boundary of Erzincan Basin.
When the maps obtained as a result of the derivative methods applied for each level given in this section are examined, the derivation methods in which the structure boundary and discontinuities are observed most clearly in accordance with the purpose of the study are determined as Tilt and Theta Angles. For this reason, the results of Tilt and Theta Angle derivation methods are compared with the existing surface faults in five different derivation methods. In addition, the discontinuities that are not seen on the surface and compatible with the existing earthquakes are shown with cut lines on Tilt and Theta Angle maps of each extension level (Figures 6e,6f, 7e,7f, 8e,8f and 9e,9f).
Three dimensional (3D) model of depth
In Cordell and Henderson's (1968) 3D modeling method, gravity anomaly is rectangularly gridded. Here, each grid point is the center of the vertical prismatic structure, and the cross-sectional dimensions of the prisms are the grid spacing. In this way the data is divided into equal prisms as grid point. The first approach model of structure is derived from the Bouguer slab relationship. The gravitational field of the first model is calculated and the ratio of the calculated gravity value with the measured value at each grid point is used to modify the initial structure model, thus leading to the second model of the structure. This process is repeated until the best fit between measured and calculated gravity data. In this method, the model building is assumed to be homogeneously distributed in its density and limited along a reference plane at a certain depth. Most of the iterative modeling methods consist of three steps. These
1) The initial model,
2) Calculation of the gravitational effect of the experimental model,
3) Modification of the model.
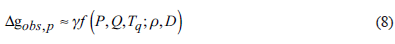
The second and third steps are repeated until sufficient alignment is achieved. The position of each prism element is established by a regular relationship for a specified horizontal reference surface. There are three modes for the reference surface of the prism elements. These are the upper surface, the lower surface and the midpoint. These are the upper surface, the lower surface and the midpoint. Firstly, the density and the reference plane are specified, and the gravity effect P (x, y, 0) on the vertical prism Q (x ', y', 0) at the qth grid point is only a function of the prism thickness Tq and the corresponding position (Eq. 8).
and the gravity effect of the input causal structure at the pth grid point expressed by Equation (9). Here
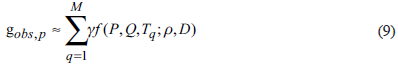
γ = gravitational constant
p = density
D = depth of reference plane
M = the total number of grids.
If tn is the thickness of the prism element under the qth grid point as a result of qth iteration,
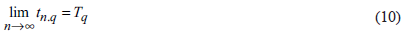
is expressed as Eq. (10). Initial model thicknesses at each grid point
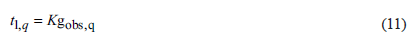
is expressed as Eq. (11). Here

Thus, the calculated gravity anomaly of the first model,
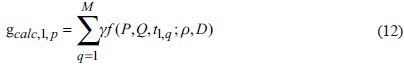
is expressed as Eq. (12). In the next iteration, the thickness is defined by the following equation (13).
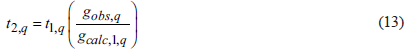
or in general
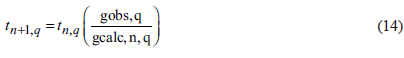
and so
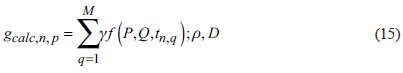
can be written Eq. (15). The rms values are calculated to determine the fit between the measured and calculated data.
Thus, the iteration step, which is the smallest value of rms, is considered as a solution.
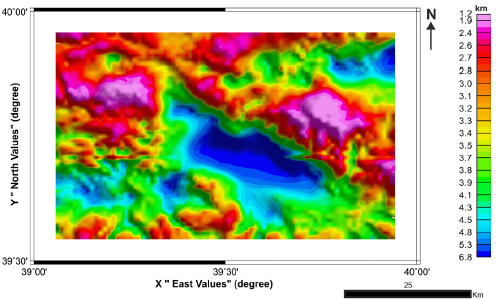
The method developed by Cordell and Henderson (1968) to determine the change of alluvium thickness of the Erzincan Basin was applied to the gravity data shown in Figure 5. The intensity value given by Akpinar (2010) was used as the density difference value (-0.86 gr cm-3) when three-dimensional modeling was performed. As can be seen from the 3-D depth model shown in Figure 10, the thickness of the alluvial unit forming Erzincan Basin is determined as approximately 7 km. It is also observed that the alluvium thickness decreased in the northwest part of the basin and the basin became two parts.
Results and Discussions
When the map of the gravity anomaly of the study area is examined, it is seen that it has low gravity values (-160 mgal) in comparison with the construction around the alluvium unit forming the Erzincan Basin. It is compatible with the surface geology map shown in Figure 3. Upward continuation of gravity anomalies are usually based on the Poisson integral and its iteration. By using the method of domain decomposition, a local function can be used for upward continuation of gravity data. This approach decomposes the total area into small domains, and uses local functions to model the disturbing potential within each of these domains. The results of the domain decomposition approach are compared to the Poisson integral for upward continuation in a flat area. In reality, gravity data are measured on the Earth's physical surface, not on the geoid, and the geoid is not a sphere. The numerical integration of Poisson's integral is time consuming. Also, the fast Fourier method can not be directly applied, if the computation points are not at the same altitude. In order to avoid large topographic effect in the Erzincan Basin, the upward continuation method was applied to the gravity data shown in Figure 6 for 0.25, 0.50, 0.75, and 1 km continuation levels. When the upward continuation map of each level is examined, it has been observed that near 2 km and 3 km upward continuation have been lost in the applied data. Therefore, 0.25, 0.50, 0.75 and 1 km upward continued gravite anomalies have been considered.
In order to determine the structure boundaries and discontinuities in the study area, five derivative filters were applied; Total Horizontal Derivative (THD) filter, Tilt Angle Derivative (Tilt) filter, Total Horizontal Derivative (THDR) filter; Angle Derivative (cos ®) and Hyperbolic Tilt Angle Derivative Filter (HTA). When all the maps shown in Figures 6 to 9 are examined, it has been determined that the boundary of the structure and the derivative methods in which the discontinuities are observed most clearly are the Tilt and Theta Angles. For this reason, The results of the Theta Angle derivative method applied to each level of upward continuation (0.25, 0.50, 0.75 and 1 km, respectively) shown in Figures 6e, 7e, 8e, 9e were compared with the current discontinuities in the study area. When all the maps are examined, it has a value of+1 (n / 2) (pink color) on the amplitude of the Theta Angle and is consistent with the Theta Angle values of the discontinuities shown by continuous black lines (AF, MOF, HF, NAFZ, NEAFZ and PF). The discontinuities indicated by the black lines are discontinuities determined within the scope of this study, taking into account that the values of + 1 (n / 2) (pink color) in the Theta Angle maps are in line with the distribution of the existing earthquake epicenters. Furthermore, it is seen that in the northwestern part of Erzincan Basin in the Theta Angle maps, the basin is deformed and therefore two parts. In this part of the basin, it is seen that this deformation is consistent with the direction of earthquakes. For this reason, a new discontinuity is defined as EBF (Erzincan Basin Fault) in this part of the basin.
The results of Tilt and Theta Angle derivative methods are compared with the existing surface faults in five different derivation methods. The results of the Tilt Angle derivation method were applied to each of the continuation levels (0.25, 0.50, 0.75 and 1 km respectively) shown in Figures 6f, 7f, 8f 9f were compared with the current discontinuities in the study area. When all the maps are examined, the amplitude of Tilt Angle is as + 1.5 (π/ 2) (pink color) on body and as 0 on edge of body. The discontinuities (AF, MOF, HF, NAFZ, NEAFZ and PF) are shown with continuous black lines are correlated with Tilt Angle amplitude. It is in line with the values of the angle. The discontinuities indicated by the dashed black lines are the discontinuities determined within the scope of this study, taking into consideration that the values of+1 (π/ 2) (pink color) and 0 (yellow color) in the Tilt Angle maps are compatible with the existing earthquakes. Furthermore, in the Tilt Angle maps it is seen that in the northwest part of the Erzincan Basin there are two parts, which are not a whole as contemplated to date. In this part of the basin, it is seen that the earthquake epicenter distribution agrees with this deformation direction. For this reason, a new discontinuity is defined as EBF (Erzincan Basin Fault) in this part of the basin.
Some of the discontinuities obtained from the Tilt and Theta Angle maps are consistent with the discontinuities (continuous black lines) determined by Akpinar (2010). In this study, in addition to the results of Akpinar (2010), new discontinuities which are not seen from the surface shown by cut black lines have been determined. As a result of 3 dimensional gravity model, the thickness of the alluvial unit forming Erzincan Basin is determined as 7 km. It is also observed that the alluvium thickness decreased in the northwest part of the basin and the basin became two parts. This situation is consistent with the situation in the Tilt and Theta Angle maps. Akpinar (2010) determined the depth of the basin to be about 7.5 km from the two-dimensional gravity models formed from the gravity profiles taken perpendicular to the basin extension, and both study results are compatible with each other.
Conclusions
In this study, the extensions of the surface fractures developed in the young basin fillets of the Erzincan Basin, which can not be detected any morphological and geologic signs on the surface today, especially during the historical earthquakes, were determined by using the potential field data and the information about the three dimensional geometry of the basin. Erzincan Basin is modeled in three dimensions using gravity data of the study area. Thus, the deep structure of the Erzincan Basin has been determined, and derivation based boundary detection filters have been applied to the gravity data to reveal the discontinuities and geological boundaries of the region. The obtained information was compared with the existing surface geology and the compatibility between the formations was checked. In addition to the discontinuities determined from surface observations, new discontinuities were found in the light of the obtained results. The obtained results show that there are other extensions of the active North Anatolian Fault Zone inside and around the basin, which can not be observed on the surface today, and new data on earthquake hazard of Erzincan urban settlement area are obtained. These data have to be taken into account when working in the region. It is expected that new information and findings that will be detected in this region bearing a great earthquake risk will contribute to reducing the loss of life and property that may occur in future earthquakes.