English (pdf)
 Article in xml format
 Article references
 Send this article by e-mail
 Cited by SciELO
  Cited by Google
  Similars in
SciELO
Similars in
SciELO  Similars in Google
 Permalink
Introduction
In recent years, as the coal mine is gradually entering the deep mining stage, higher requirements of advanced detection in tunnel face are put forward due to geological environment changes such as high geostress, high temperature, high karsts water pressure, mining strong disturbance and so on (Liu, Liu & Yue, 2014; Cheng, Li, Peng, & Sun 2014). In Chinese coal mine disaster accidents, according to statistics, more than 90% of the accidents occur in the process of roadway constructions, so it is very necessary to carry out the effective advanced prediction of the geological anomalies (Zhang, & Hu 2015; Liu & Wang, 2016). The advanced detection method of the reflected waves is used to predict the geological conditions of the advanced tunneling zone of the roadway by using the reflections generated from seismic waves' propagation in inhomogeneous geological structures (Lüth, Buske, Giese, & Goertz, 2005; Bohlen et al., 2007).
The advanced detection methods of the reflected waves in mine roadway are as follows: Shen (2006) proposed seismic prediction method of laneways, which is to achieve the imaging according to the superposition principle of diffraction and the principle of mirror imaging. Liu, Guo & Zhang (2006); Zhang & Wu (2006), y Wang et al. (2016) proposed mine seismic prediction method, which adopts the roadway observation system with high covering number to acquire seismic data. These data are processed by the methods of energy synthesis and decomposition and migration superposition to predict a variety of geological structures within 120m ahead of the tunnel face. He (2008) developed mine multi-component seismic data processing system to provide the support for the seismic advanced detection with multiwave. Liang & Song (2009) put forward the multi-component advanced detection method with multiwave, which can detect the situations such as rock broken zone etc, within 100m ahead of the tunnel face (Reyes-Mendoza et al., 2016).
In addition, the advanced detection methods of reflected waves in traffic tunnel are sometimes used in underground coal mine roadway, mainly including seismic negative apparent velocity method (Zeng, 1994), land sonar method (Zhong, 2012), tunnel seismic prediction method (Dickmann & Sander, 1996), and the Japanese OYO company (Inazaki, 1999), the German GFZ company (Borm, Giese, & Otto, 2001), American NSA company (Otto, BuRon, Bretterebner, & Schwab, 2002) also developed seismic prediction system based on the reflected waves method in the tunnel. The advantages of these seismic reflected waves method include long detection range, high resolution, abundant information and being sensitive to geological anomaly.
Due to the limitation of narrow observation space of the roadway and the interference of the near-source seismic wave field (Cheng et al., 2014), the result of wavefield separation and migration imaging is not accurate, which lead to the fact that the fine imaging of geological anomaly is difficult (Wang et al., 2016). Based on this problem, the polarization migration that integrates wavefield separation with migration imaging in full space condition is put forward in this paper and the fine imaging is achieved by using the advanced detection method of reflected waves through the physical simulation and the field survey.
Wavefield Separation
The advanced detection method of reflected wave is carried out with sources and receivers in rock or coal seam. The method have the characters of broadband excitation and three components reception, which provides the possibility for seismic exploration with high resolution and multiwave attributes, while due to the limited offset, the complex seismic information makes the data processing be difficult. In multiwave seismic exploration, the data contains P-wave, S-wave, converted wave, surface wave, acoustic wave and so on. Effective wavefield separation is the key to data processing. The common wavefield separation methods include: linear Radon transform filtering, frequency wavenumber domain filtering, polarization filtering, etc.
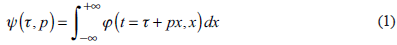
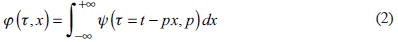
τ - p Filtering
τ - p filtering is to transform seismic records from time-spatial (τ - x) domain into τ - p domain and separate the effective wave energy in τ - p domain, and then transform it into time-spatial (t - x domain again. The integral formulas of Radon transformations can be defined as:
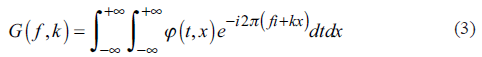
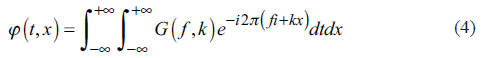
F - K Filtering
F - K filtering is the method to carry out wave field separation by using the difference of spectrum and apparent velocity of effective wave and interference wave. The effective waves of frequency band f 1 - f 2 (frequency filtering) and apparent velocity v1 - v2 (apparent velocity filtering) are reserved, and the interference wave are suppressed when v < v 1 , v > v 2 , f < f 1, and f > f 2. Two-dimensional Fourier transformations are as follows:
Polarization Filtering
Polarization filtering is also known as spatial directional filtering which is used to filter P- and S-waves by using the difference of polarization characteristics. P- and S-waves are represented as linear orthogonal polarization, while the polarization direction of P-wave is parallel with the propagation direction of wave, and polarization directions of S-wave are perpendicular to the propagation direction of waves.
Comparative Analysis
Kinematic separation method of P- and S-waves is based on the relatively clear phase axes of P- and S-waves in the time domain. However, the actual data, especially underground roadway seismic records are complex. Various types of waves are intertwined, including information of positive apparent velocity features such as roof, floor, rear and so on, thus phase axes of P- and S-waves with clear negative apparent velocity are rarely, so it is difficult to separate P- waves and S-waves simply by using t - p filtering.
A combination of kinematics apparent velocity features and dynamics frequency features is used by F - K filtering to separate P- and S-waves. On the one hand, because of the lower frequency of surface waves and S-waves, they could not be separated effectively in the separation process because the frequency between surface wave and S-wave is close. On the other hand, when P-wave is obtained through high-pass filtering, it easily leads to the fact that some effective S-wave is lost.
Because the polarization filtering is not the band-pass filtering of frequency domain, the bandwidth of effective waves is not affected, and the polarization filtering is to use mathematical statistical method to carry out wavefield separation on basis of the polarization difference of P- and S-waves, which makes the polarization filtering method become the commonly used separation method for P- and S-waves. However, in the process of calculating eigenvalues and eigenvectors and setting filtering function, corresponding relations between XYZ coordinate axes and P, SH, SV directions are usually artificially, without considering the corresponding relationship between the principal polarization direction of real-time particle in each receiver and propagation direction of seismic wave, which makes the results of unclean separation of P- and S-waves in the roadway.
Therefore, through the real-time computation of principal polarization directions of particles in each receiver, starting from the difference between real-time particle vibration directions and P- and S-waves propagation direction, setting P- and S-waves separation filter should be an effective method to extract P-wave or S-wave.
Migration
Migration imaging method can be divided into ray and wave equation migration. The ray migration is mainly as the prestack diffraction migration, which is based on Huygens principle. Wave equation migration mainly includes Kirchhoff integral migration method, reverse-time migration method and so on. However, wave equation migration like reverse-time migration, etc., has lower calculation efficiency, so the prestack diffraction migration is mainly adopted for migration imaging of mine roadway seismic exploration.
According to Huygens principle, each reflection point G in the grid can be regarded as a secondary source, while carrying out diffraction scan migration, any discrete grid point should be regarded as a reflection point, and travel time of reflected wave or diffraction wave is as follows:
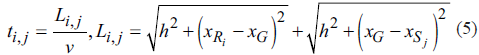
Where i =1, 2, 3,......m, and m is the recording trace for superposition
calculation; v is the seismic velocity, h is the vertical depth of the scanning point G i,j , while t i,j is the travel time of diffraction wave of the j th shot in the i th receiver at the scanning point G i , j . The amplitude value A ¡ of signal in different traces in the time of t¡ are carried out with superposition to get the amplitude value of G i , j j point.
Principle
As shown in Figure 1, X direction denotes tunnel face, Y direction denotes the left side and Z direction denotes the roof. The grid division is carried out with the advanced space of the roadway, and the black mark is a hypothetical reflection point in the spatial grid; the same side behind tunnel face is set up with several sources and receiver.
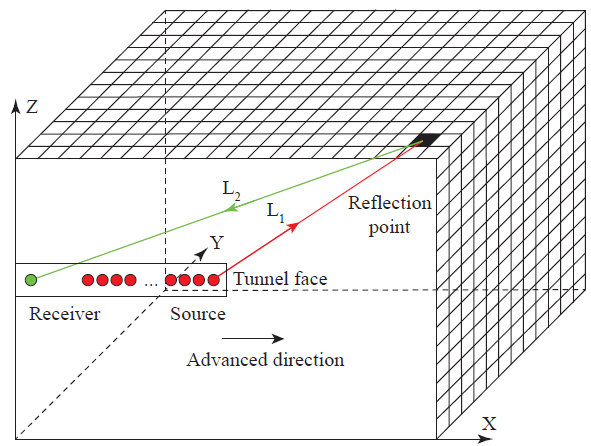
Assuming that the propagation time is represented as t, and the propagation path is shown as the ray direction in figure; in the spatial coordinate system, the incident path is as L 1 and the propagation time is as t1; the reflection path is L2 and the propagation time is as t2; the ray path ofL1 and L2 in homogeneous space can be calculated by the spatial coordinates among source, the reflection point and the receiver.
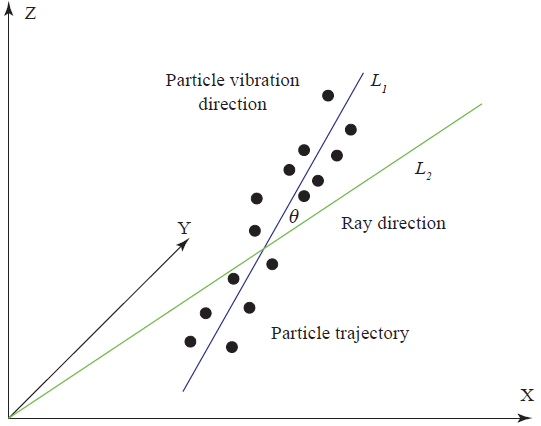
According to the spatial position of source, reflection point and receiver and spatial velocity parameters, based on ray tracing technology, it can calculate the total time t = t1 + t2. Based on three-component amplitude at t time, particle spatial vibration direction L i at t time of a receiver can be calculated by polarization analysis method. The angle 6 can be calculated by using particle spatial vibration direction L i and the ray direction of reflection path L2 (as shown in Fig. 2), and then based on the difference of angle 6 between P-wave and S-wave, the filter is set up in real time to realize dynamic polarization filtering. The dynamic filtering computation is integrated into prestack migration.
Polarization Analysis
Hilbert transform polarization analysis method is a kind of complex number field polarization analysis method based on Hilbert Transform to construct the complex covariance matrix and then to obtain principal polarization parameters. Among them, taking the two-dimensional space as an example, the calculation steps of the principal polarization direction L i at the t time are as follows:
Hilbert transform is calculated:


Where x(t) and z(t) are seismic records of components X and Z respectively, while the symbol U represents Hilbert transform,

Hermitian matrix is constructed:

Where,
 , the symbol * represents complex conjugate transpose of matrix.
The maximum eigenvalue λmax of the matrix and its normalized corresponding eigenvector (x max ,z max ) are obtained.
The principal polarization angle a is calculated:
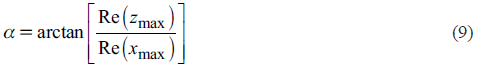
Where Re(x max jand Re(z max ) are respectively as the real parts of xmax and zmax, α indicates the main polarization direction L i.
Polarization Migration
Prestack depth migration is often expressed as a diffraction integral in a scalar wave field. On the basis of integral migration, a modified function is introduced into polarization migration, and the migration formula can be defined as:
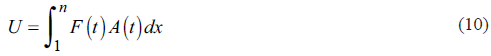
In the above equation, F (t) = cosq θ, F (t) is a modified function of amplitude value for any reflection point during P-wave imaging ( sin q θ for S-wave imaging), and A (t) is the amplitude. The acute angle θ represents the angle between the ray direction from any reflection point and the principal polarization direction. The q is valued in a range of 1 to 10.
Physical Simulation
In order to simulate the seismic advanced detection field with the size of 160m * 160m * 80m (as shown in Figure 3), the experimental physical model is designed according to scaling factors in Table 1 with the size of 1.6m * 1.6m * 0.8m. The model velocity parameters are consistent with the actual detection field, and the sampling frequency is 1MHz, namely that the sampling interval is 0.001ms, while receiver line layout is also scaled down by 1: 100.
The advanced linear observation system is shown in Figure 3-b. The excitation transducer slides on the receiver line to simulate excitation with multiple shots according to the moving step of 0.01m, and the position of three-component receiving transducer is fixed. In the process of the experiment, the offset trace is 0.059m with the total excitation of 21 times, and the sampling frequency is 1MHz, namely that the sampling interval is 0.001ms. The three-component ultrasonic data with 21 shot are collected in the experiment. The components of X, Y and Z are respectively of 21 channels.
The interference of reflected waves from the sink sides and bottom is avoided effectively in the process of designing model, so the original signals are mainly direct waves and reflected waves from abnormal interfaces. Figure 4 is obtained through τ-p transform and F -- K transform with the combination of filtering.
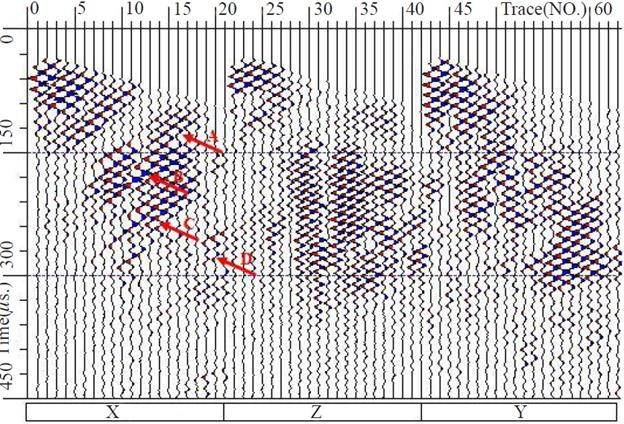
From the signals of component X in Figure 4, four groups of reflected waves can be observed, respectively as A, B, C and D, which are all performed with negative apparent velocity characteristics. From the analysis of the propagation time, A and B are respectively as reflected P-wave, whose time length of the signals between 1st to 21st shot is within 100-200 and 150-250 μs, while C and D are respectively as reflected S-wave, whose time length is within 200-380 and 260-440 μs. Among them, signals of C and D in wave transducers of Y and Z are more obvious.
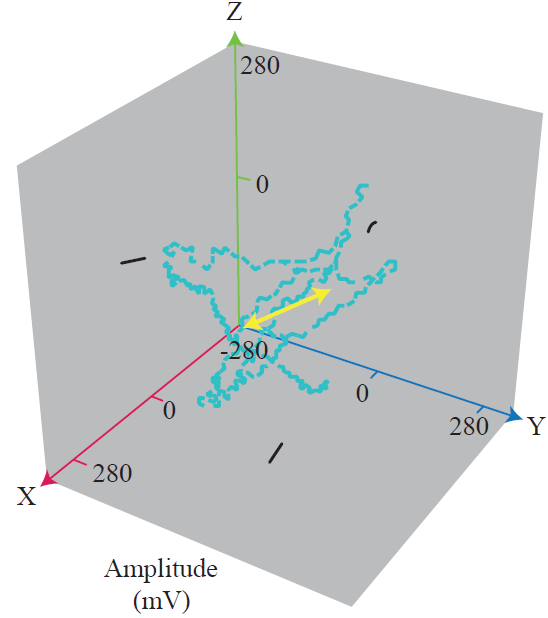
The three-component signal of the 21st shot of A reflected P-wave is selected to make the polarization diagram (Figure 5). The angle between projection of the principal polarization direction of A reflected P-wave in the XZ plane and the X axis is 10° (it should be 0 degree in theory and there is a 10 degree error). The principal polarization direction in XZ plane is parallel with the wave propagating direction (wave propagating direction is represented by a yellow arrow), while the principal polarization direction in XY plane is parallel with the X-axis, and the principal polarization direction in YZ plane is nearly parallel with the Z-axis. Thus, it can be deduced that the principal energy is in the XZ plane, which is parallel with the receiver line (along the X axis). Those features conform to the characteristics of P-P wave.
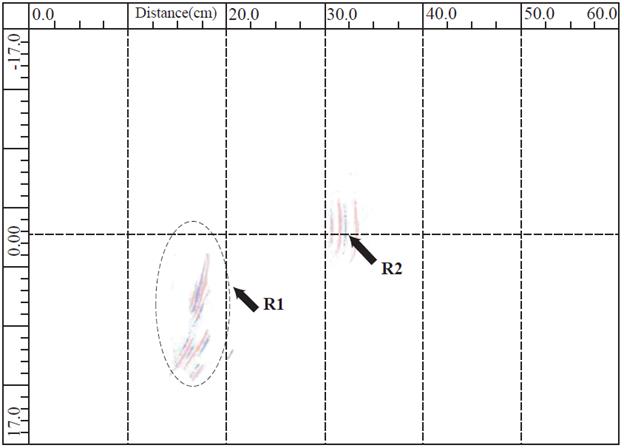
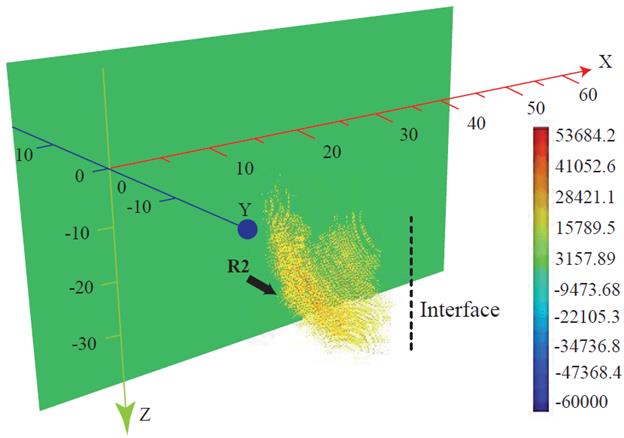
Imaging by using polarization migration is shown in Figure 6. It is analyzed from the figure that there are two groups of appear abnormal interfaces around in 0.2m and 0.32m, respectively as R1 and R2, where 0.32m is the designed model interface between the concrete and saturated fine sand, while the 0.2m is cracking zone of the model with developed fracture. Similarly, three-dimensional polarization migration is carried out in order to describe the spatial morphology of the interface R2 after filtering energy anomaly signal of R1. Figure 7 is the spatial profile of R2 energy anomaly interface.
Field Survey
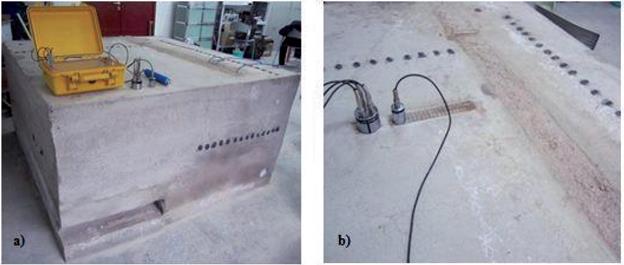
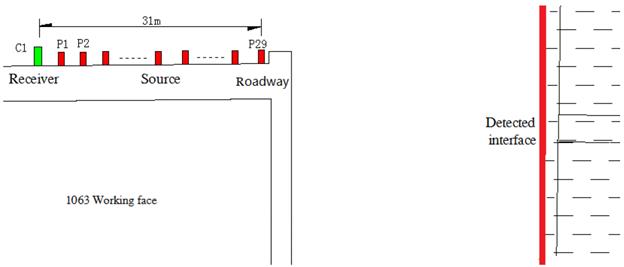
The multiwave seismic instrument was adopted to record seismic data. A three-component geophone arranged in left side of open-off cut roadway of 1063 working face. There are 29 sources in left side and the spacing of two sources is 1m. Figure 8 is the site survey layout. The sampling length is 2048 points and the sampling interval is 0.08ms, finally the 29 shots seismic data were recorded.
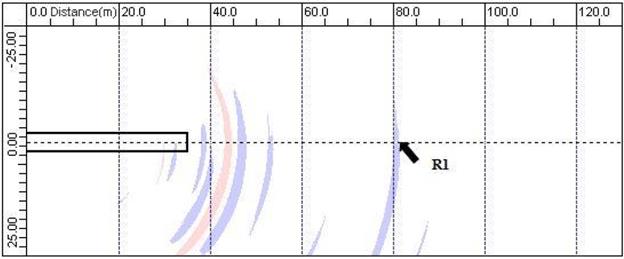
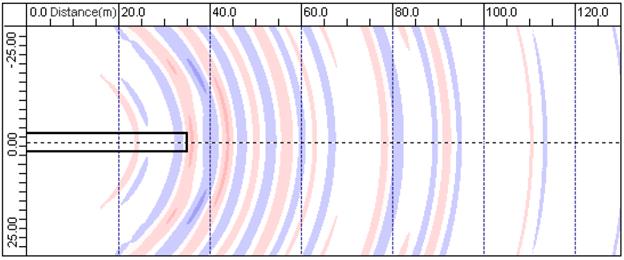
Spectrum analysis shows that the main frequency of the data is within 100-400Hz. The velocity of P-waves was obtained as 2200m/s based on the first break picking. The advanced reflected waves were acquired through τ - p and F - K transform. Two groups of negative apparent velocity characteristics can be analyzed from the figure, which are respectively located at 30-50ms, 70-90ms. Figure 9 was obtained by using polarization migration. It can be seen clearly from Figure 15 that there is an abnormal energy interface R1 at 47m ahead of tunnel face, while the energy near the tunnel face is obviously abnormal. Combine with field exploration data, there is a water tank near the tunnel face, so the interpretation of R1 interface is the goaf boundary. Figure 10 indicates the result of prestack diffraction migration, and there exist energy anomaly of 0-30m, 40-60m, 75m in the front. P- and S-waves could not be effectively separated without the polarization migration, thus the imaging resolution is low, which can not effectively determine location of goaf in the front. Verified by field drilling, it is confirmed that the location of advanced goaf boundary is located at about 49m, which is close to the detection result and the error is 2m.
Conclusion
On the basis of the three-component seismic data, the real-time polarization analysis was carried out. Based on the difference of polarization parameters, extraction of advanced seismic reflection wavefield were carried out with the combination of τ - p and F - K filtering. Dynamic polarization migration imaging method was proposed in this paper, and wavefield separation of effective wave was completed in the migration imaging process, which solves the problem of multiple abnormal interfaces when detecting the complex wave field of the roadway. The method effectively improves the spatial resolution and detection precision.