


 English (pdf)
 Article in xml format
 Article references
 Send this article by e-mail
 Cited by SciELO
  Cited by Google
  Similars in
SciELO
Similars in
SciELO  Similars in Google
 Permalink
Introduction
The western continental margin (including state of Gujarat) of India evolved mainly during the drift stage of the Indian plate in Late Cretaceous-Tertiary times, following the Late Triassic rifting of the eastern Gondwanaland. Kachchh, Saurashtra, Cambay and Narmada are four pericratonic basins which evolved during the upper Gondwana time. These basins are located in the northern part of the western continental shelf (Biswas, 1987, 2005).
The state of Gujarat comprises three distinct zones: Mainland Gujarat, Saurashtra and Kachchh. The Kachchh zone is one of the most seismically active zones in India. During the last 200 years, since 1819, this zone has produced two largest devastating intraplate earthquakes, the June 1819 earthquake Mw 7.8 and the January 2001 earthquake Mw 7.7 (Fig. 1) (Kayal et al., 2002a). In addition, this zone was hit by a strong earthquake Mw 6.0 in 1956 (Fig. 1) (Chung and Gao, 1995), which also caused severe damages and loss of lives. Some parts in the Saurashtra zone are also found to be producing minor to moderate magnitude local earthquakes. After the January 2001 large earthquake, the Institute of Seismological Research (ISR) has established a local close spaced Gujarat Seismic Network (GSNet) since 2006. This network comprises of some 60 broadband seismographs and 50 strong motion accelerographs. The network provides data of large aftershock sequence of the 2001 event till date, and many local, regional and teleseismic events.
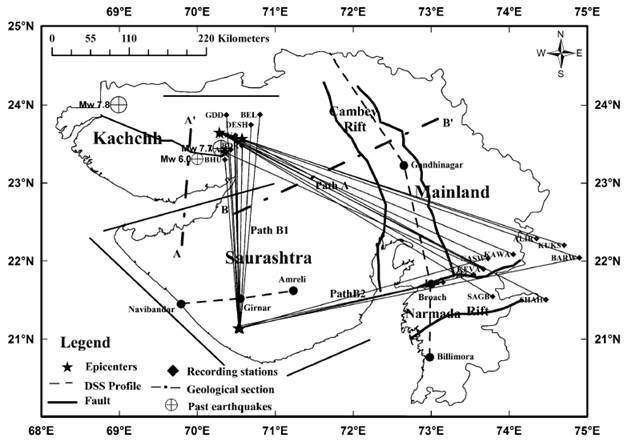
Figure 1 Map shows three clusters of wave paths: A, B1 and B2. The DSS profile, geological section, major fault lines, Pericratonic rift basins and past damaging earthquakes (1819, 1956 and 2001) are also shown.
A few studies have been done to find out crustal structure in the epicenter area of the 2001 earthquake using temporary network and the GSNet data by seismic tomography (Kayal et al., 2002b; Mandal, 2006; Singh et al., 2011). From early 1980s to 1990s, a few Deep Seismic Sounding (DSS) profiles were undertaken to investigate crustal structure in different parts of the Gujarat region (Fig. 1) (Kaila et al., 1981, 1985, 1989, 1990). In the recent years, some limited studies have been done to find out crustal structure using surface wave data of the local networks (Mandal, 2006; Prajapati et al., 2011; Joshi and Rastogi, 2015). In this study, data of the GSNet was used and an attempt was made for comprehensive study on the crustal velocity structure beneath the whole Gujarat region through inversion of both Love and Rayleigh wave group velocities. The results of this study are highlighted in this paper. The present study will provide detailed knowledge about the structure of seismogenic layer of this active intraplate region.
Geological setup of Gujarat region
The state of Gujarat with unique physiographic features comprises the three distinct zones, i.e. 1) Mainland Gujarat, 2) Saurashtra and 3) Kachchh. Its physiography has remained very dynamic with alterations and modifications taking place throughout the geological history of the region. It illustrates an interesting example of a terrain endowed with geologic, physiographic and climatic diversities. The geological evolution of the northern and eastern parts of Mainland Gujarat has been controlled by the Precambrian orogenies Aravalli and Delhi cycles, and the older crystalline rocks ideally show folds, faults and magmatism related to the two orogenies. A major part of Mainland falls within the Cambay and the Narmada grabens and the eastern and northeastern Precambrian rocks mark a tectonic boundary (Merh, 1995). The central and southern parts are dominantly covered with thick pile of Quaternary sediments. The peninsula of Saurashtra has been described as a horst, foundered between the fractures related to the three intersecting rift trends, viz, Delhi (NE-SW), Narmada (ENE-WSW) and Dharwar (NNW-SSE) (Biswas, 1987). The triangular shape of the Saurashtra horst is a reflection of the various bounding faults on all sides (Merh, 1995). In case of Kachchh the main structural features that have played a vital role in its geological evolution include a group of E-W trending uplift (highlands and islands) surrounded by a residual depression, plains of the Great and the Little Ranns. Six major uplifts namely Pachcham, Khadir and Bela islands, Chorar hills, Wagad highlands and the Kachchh Mainland occur along three sub-parallel trending E-W lines (Merh, 1995).
The Kachchh-Saurashtra, Cambay and Narmada basins are pericontinental rift basins in the western margin ofthe Indian craton. These basins were formed by rifting along Precambrian tectonic trends. Interplay of three major Precambrian tectonic trends of the western India, Dharwar (NNW-SSE), Aravalli-Delhi (NE-SW) and Satpura (ENE-WSW), controls the tectonic style of the basins. The geological history of the basins indicates that these basins were formed by sequential reactivation of primordial faults. The Kachchh basin opened up first in the Early Jurassic (rifting was initiated in Late Triassic) along the Delhi trend followed by the Cambay basin in the Early Cretaceous along the Dharwar trend and the Narmada basin in Late Cretaceous time along the Satpura trend (Biswas, 1982, 1987). The evolution of the basins took place in four stages. These stages are synchronous with the important events in the evolution of the Indian sub-continent-its breakup from Gondwanaland in the Late Triassic-Early Jurassic, its northward drifting during the Jurassic-Cretaceous and collision with the Asian continent in the Early Tertiary. The most important tectonic events occurred in Late Cretaceous time. The present style of the continental margins of India evolved during Early Tertiary time (Biswas, 1982, 1987, 2005). The Saurashtra arch, the extension of the Aravalli Range across the western continental shelf, subsided along the eastern margin fault of the Cambay basin during the Early Cretaceous. It formed an extensive depositional platform continuous with the Kachchh shelf, for the accumulation of thick deltaic sediments. A part of the Saurashtra arch was uplifted as a horst during the main tectonic phase in the Late Cretaceous (Biswas, 1987).
The continental flood basalts (Deccan volcanics) cover large parts of northwest India. These consist of several flows of mainly tholeiitic lava that extruded from the Reunion plume during the passage of the Indian Plate over the plume in cretaceous- Early Tertiary time (Morgan, 1981; Rao et al., 2005). It has been proposed that the volcanic eruption from the Reunion plume at ~65 Ma was mainly responsible for the widespread volcanic activity in western India (White and Mc Kenzie, 1989; Rao et al., 2005). The center of the plume at that time was close to the west coast of India. The Saurashtra peninsula was close to the trace of this plume on the earth's surface, during the passage of India over it, in late Cretaceous. The trace of the plume passed through the Cambay Basin to the immediate east of the Saurashtra peninsula (Campbell and Griffiths, 1990; Kaila et al., 1990; Kennett and Widiyantoro, 1999; Rao et al., 2005; Rao et. al., 2013).
Thus, whole Gujarat region is tectonically complex, geologically in much diversity and seismically most active compared to any other part of the intraplate region in peninsular India.
Data
Surface wave data used in this study was recorded by the GSNet. Study area with selected earthquakes and recording stations are shown in Figure 1. Eight stations data of SSNNL (Sardar Sarovar Narmada Nigam Limited) network for the Path A, four stations data of SSNNL for path B2 and seven stations data of Kachchh region for Path B1 have been used. Observatories at Kachchh are equipped with broadband triaxial seismometer CMG3T (Guralp) and those at SSNNL are equipped with Trillium 120 (Nanometrics) connected to 24-bit recorder with GPS time synchronization. The hypocentral parameters of earthquakes used for the surface-wave dispersion study are listed in Table 1. Epicentral distance range for path A, B1 and B2 are 361-505 km, 241-306 km and 277-461 km respectively.
Group Velocity Measurement
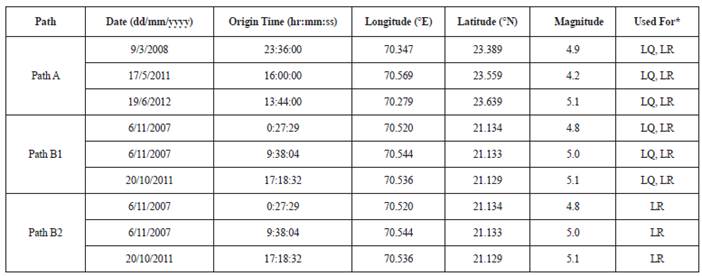
The broadband data of earthquakes listed in table 1 were used to obtain the group velocity measurements. The digital waveform records were decimated to 5 samples per second, corrected for the seismograph response, and converted to vertical, radial, and transverse components with known back azimuth. Then, the group velocities were measured using a technique called the frequency time analysis (FTAN) following Bhattacharya (1981, 1983). Vertical components are used to obtain the Rayleigh wave group velocities, and transverse components are used to obtain the Love wave group velocities for each cluster. The measured Love wave group velocities sample periods from 4-62 s and 4-50 s for path A and B1 respectively and Rayleigh wave group velocities sample periods from 4-66 s, 4-46 s and 4-72 s for paths A, B1 and B2 respectively. Fig. 2 shows observed dispersion data of both Love and Rayleigh wave at different stations for path B1, similarly we get dispersion curve data for path A and B2 also.
For path B2 only Rayleigh wave dispersion curves are used because the quality of dispersion curves of Love wave was not good. The mean and standard deviations of the observed data is shown in Figures 3, 4 and 5. These data are used to retrieve the average shear-wave velocities along the wave paths.
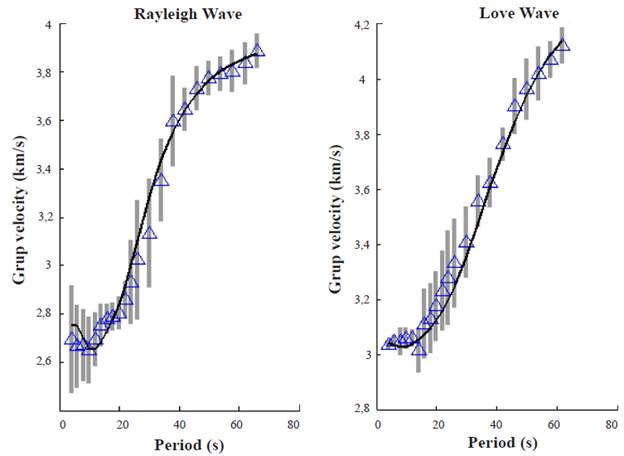
Figure 3 Observed group velocities across path A are shown by small triangles; vertical lines show corresponding standard deviations. The theoretical group velocity curve for the accepted model is shown by the continuous line. Misfit φ of accepted model is 0.80 and estimated thickness of the crust is 38.2 ± 1.2 km.
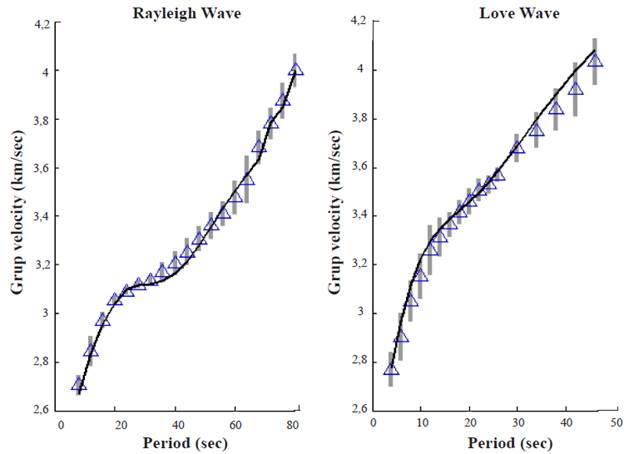
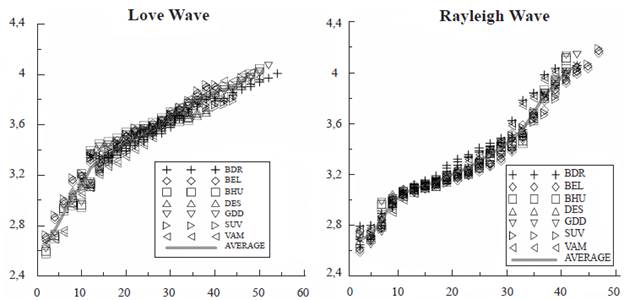
Figure 4 Observed group velocities across path B1 are shown by small triangles; vertical lines show corresponding standard deviations. The theoretical group velocity curve for the accepted model is shown by the continuous line. Misfit φ of accepted model is 0.84 and estimated thickness of the crust is 36.2± 1.0 km.
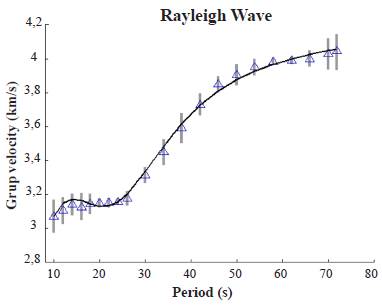
Figure 5 Observed group velocities across path B2 are shown by small triangles; vertical lines show corresponding standard deviation. The theoretical group velocity curve for the accepted model is shown by the continuous line. Misfit φ of accepted model is 0.79 and estimated thickness of the crust is 41.6 ± 0.7 km.
Inversion
To retrieve the crustal shear-wave velocity models, a nonlinear inversion with the Genetic algorithm (GA) following Suresh et al. (2008), Bhattacharya (2009), Prajapati et al. (2011) has used as, the surface wave dispersion curve is a nonlinear function of medium parameters. The GA inverts the dispersion and gives a fully nonlinear solution in a large model space (Lomax and Sneider, 1995). The GA does not improve a solution, but it works on a population of possible solutions. However, the GA is an iterative directed search operating on a population of trial solutions within a user defined search space to find new solutions with lower misfit in each generation; the misfit is obtained from the difference between observed data and theoretical values based on a solution (Suresh et al., 2008).
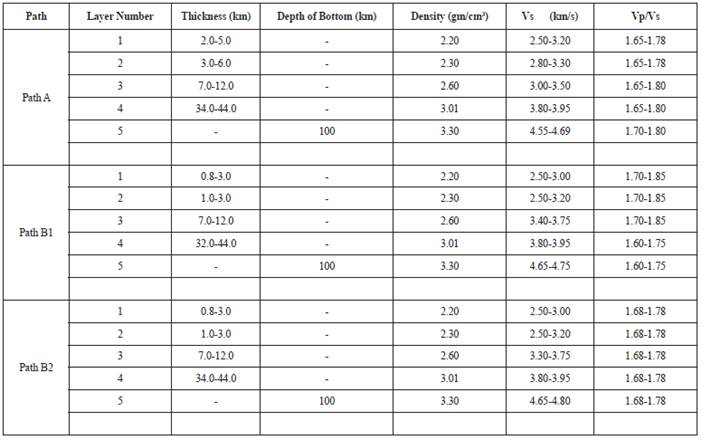
For inversion through GA, adequate knowledge of starting model is required. In present study, the model evaluated by Prajapati et al. (2011) has been used as starting model. Since the travel paths used to evaluate crustal model by Prajapati et al. (2011) crosses the present study area, it is presumed that the structure along the present study region is similar to the model evaluated by them. This model is taken as a starting model, which consist of 4 layers of crust and a layer of subcrust, whose base is fixed at 100 km depth. The ranges of model parameter were set around the corresponding parameters of this model. Theoretical group velocities were obtained for an isotropic elastic layered medium following Bhattacharya (1987). The 14 variables in our GA search are (1-4) thickness of the top four solid layers of the crust, (5-9) Vs of the top five solid layers, and (10-14) Vp/Vs of the top five solid layers (Table 2). Here, Vp is P-wave velocity, and Vs is S-wave velocity.
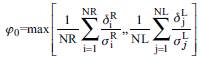
The density in each layer has been kept constant because it has the least effect on the dispersion curve (Bloch et al., 1969; Suresh et al., 2008). The density in this region is based on Prajapati et al. (2011) and Radhakrishna et al. (2002). The misfit function is considered as similar to Prajapati et al. (2011) as
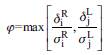
Where δ R i is the absolute difference between the observed and theoretical group velocities of a given structure, and σ R i is the standard deviation (S. D.) of the observed group velocity at period Ti (i = 1, 2,..., NR) for Rayleigh waves. δ L j and σ L j are the corresponding values at period T (j = 1, 2,..., NL) for Love waves. NL and NR are the numbers of observations for Love and Rayleigh waves. The misfit φ gives a measure of closeness of the theoretical curve to the observed data with respect to standard deviation. If φ < 1, the theoretical curve is within the standard deviation at each observation (Prajapati et al., 2011). However, study done by Suresh et al., (2008) and Prajapati et al., (2011) considered a misfit function as
According to Bloch et al., (1969), the partial derivatives of group velocities with respect to the model parameters show that the group velocities at different periods are affected by different depth regions of the structure. Thus, the group velocity at each period has its own importance in evaluating model parameters of different depth regions of the structure. The misfit φ gives equal importance to δ/σ for each period of Rayleigh and Love waves so, is better than φ The misfit φ0 considers the averages, so the importance of individual data is ignored; further, if φ0 < 1, the theoretical curve is not necessarily within the standard deviation at each observation. (Prajapati et al., 2011).
The GA searches with a random initial population of K models within the search limits. 100 generations, with the population size K =300 at each generation is considered for all the path, and the best model of the last generation is accepted if the misfit value <1. This procedure is repeated 50 times for each path. The mean and S.D. of each variable of all the 50 accepted solutions for each path are obtained and accepted as final solutions. Figures 3, 4 and 5 show the observed group velocity curve and the theoretical group velocity curve of the model obtained through GA for path A, B1 and B2 respectively.
Results and Discussion
In this study, crustal velocity models have been obtained for three different paths (A, B1and B2) that crosses through three different tectonic blocks of the region as mentioned above. The average thickness of the crust estimated for Paths A, B1 and B2 are 38.2 km, 36.2 km and 41.6 km respectively and the estimated S-wave velocity in the lower crust is ~ 3.9 km/s for all the paths.
The path A that crosses through Cambay basin; opened up in the early Cretaceous along the Dharwar trend (Biswas, 1982, 1987), and it has developed in three structural stages. The lower stage is represented by Mesozoic rocks, middle stage by thick basaltic lava flow during late Cretaceous which is better known as Deccan trap and finally the upper stage is represented by Cenozoic sequences. The total thickness of the crust estimated for path A is 38.2 ± 1.0 km with S-wave velocity of 3.9 km/s. The top most sedimentary layer is 3.2 km thick followed by 4.6 km thick Deccan trap. Similar results were found by Biswas (1987), he identify ~4 km thick Deccan trap in Cambay Graben (Geological section BB' in Fig. 1). Through Deep Seismic Sounding (DSS) study, Kaila et al. (1981, 1990) found Moho at ~38 km depth in the Cambay basin, where our path A crosses their DSS profile between Gandhinagar and Broach (Narmada basin) (Fig. 1). These results are much in agreement with study done by Biswas (1987) and Kaila et al. (1981, 1990).
Second path B1 is along the Saurashtra; which was uplifted as a horst during the major tectonic phase in the Late Cretaceous (Biswas, 1987). This event was followed by eruption of the Deccan volcanics due to interaction between the reunion hotpot and the overlying lithospheric plate (Mckenzie and sclater, 1971; Raval and Veeraswamy, 2000; Rao and Tewari, 2005). Almost entire Saurashtra is covered by this volcanics (Rao and Tewari, 2005). The estimated average thickness of the crust for path B1 is 36.2 ± 1.0 km with S-wave velocity of 3.9 km/s. The top most layer of Deccan trap is 2.0 km thick, which is followed by 1.6 km thick volcanic upper crust. These observations are comparable with those of Biswas (1987) (Geological section AA' in Fig. 1). Further the crustal thickness estimated through DSS study along Navibandar and Amreli profile shows ~36 km thick crust beneath Junagadh (Rao et al., 2005). Which is also in a good agreement with present estimate, as present path crossing the profile near Junagadh (Fig. 1). Moreover through receiver function study Mandal (2006) found Moho at the depth of 35-42 km.
Path B2 is along the Narmada basin that, opened up during Late Cretaceous along the Satpura trend. It separates the region of Proterozoic Vindhyan deposition to the north from Gondwana deposits to the south. According to Biswas and Deshpande (1983, 1987) widespread volcanic eruption towards the end of the Cretaceous covered the Mesozoic sedimentary rocks of all the (Kachchh-Saurashtra-Narmada) basins. The estimated average thickness of the crust for path B2 is 41.6 ± 0.7 km with S-wave velocity of 3.9 km/s. According to Tewari et al. (2000), the Deccan Traps thickness in this basin varies from 1000 to 2700 m. Moreover, through DSS study along Dharimanna-Billimora profile Kaila et al., (1981, 1985, 1990) and Tewari et al. (1995) revealed ~40 km thick crust near Broach (Narmada basin) where present path crosses the profile (Fig. 1). Another DSS study along Thuadara-Sendhwa-Sindad profile done by Kaila (1989) across Narmada basin found 38-43 km Moho depth variation. Which indicates the results of present study are fairly comparable with the results of Kaila et al., (1981, 1985, 1989, 1990) and Tewari et al. (1995).
Structural parameters of all the paths are shown in Table 3. In present study, Standard deviations for the estimated thicknesses vary from 0.8 to 1.3, 0.2 to 1.0 and 0.2 to 0.7 km for the paths A, B1 and B2 respectively.
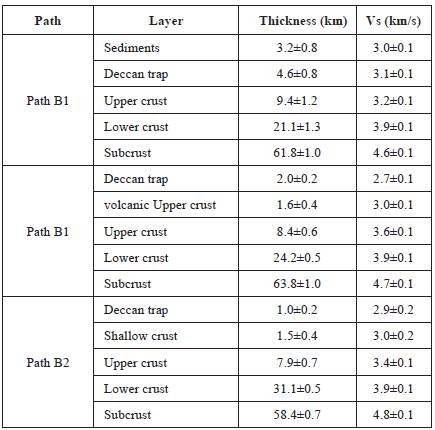
Standard deviations for the S-wave velocity vary from 0.1 to 0.2 km/s for path A, B1 and B2. For each solution Vp is obtained from Vs and Vp/Vs. Standard deviations for the P-wave velocity vary from 0.1 to 0.4 km/s for path A, B1 and B2. Misfit φ of the accepted model is 0.80, 0.84 and 0.79 for path A, B1 and B2 respectively. These show that present observations are fairly well constrained, and within acceptable errors.
Variations of S-wave velocity with depth for the three paths (A, B1 and B2) are illustrated in step plot (Fig. 6).
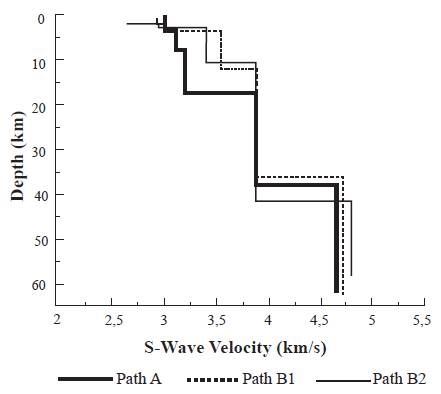
The maximum Moho depth (~ 42 km) is found along the path B2 beneath the Narmada basin. The Moho depth is minimum at ~36 km along the path B1, below the Saurashtra horst, and an average Moho depth ~38 km along the path A, below the Cambay basin, Mainland Gujarat. The plot further illustrates the marked variations in S-wave velocity in the upper crust at depths between 5 km and < 20 km. It is much low beneath the Cambay basin (path A) compared to that beneath the Saurashtra horst (path B1) and Narmada basin (B2). Presence of Mesozoic sediments below the Deccan Traps might be the possible reason for the low S-wave velocity beneath the Cambay basin Kaila et al., (1981, 1990). On the other hand, the S-wave velocity in the lower crust at depth below 20 km, is much consistent along all the paths A, B1 and B2 beneath all the tectonic zones studied here.
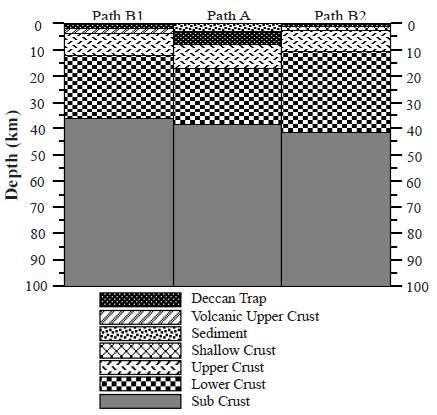
Observations have summarized in Figure 7 with inferred geological sections for each path.
According to Merh (1995), the geology of Gujarat comprises a Precambrian basement over which younger rocks of Jurassic through Cretaceous, Tertiary and Quaternary are deposited. Further, the Jurassic rocks are found only in Kachchh basin, so the major geological events of Gujarat are confined to Mesozoic and Cenozoic. Uplift of Saurashtra as horst and formation of Cambay Graben is shown in first two columns of Figure 7. From the stratigraphy succession given by Biswas (1987) and Merh (1995) it is concluded that the top two layers along all three paths are formed during Cretaceous to Quaternary, and the layers below top two layers were formed in Proterozoic because Paleozoic era are totally absent.
If present results are supplemented with other geophysical and seismological investigation, it can provide better understanding about the seismogenic depth and related hazard for this active intraplate region.
Conclusions
Crustal structure of Gujarat region has been investigated by inverting group velocity measurement of fundamental mode Rayleigh and Love waves using a Genetic Algorithm. Important outcomes of this study are as follows:
i) The maximum estimated crustal thickness is 41.6 ± 0.7 km, beneath the Narmada basin, followed by 38.2 ± 1.0 km beneath the Cambay basin and 36.2 ± 1.0 km beneath the Saurashtra horst.
ii) The Deccan Trap thickness is maximum in the Cambay basin (path A) as compared to Saurashtra horst (path A) and Narmada basin (path B2).
iii) The Cambay basin exhibits maximum sediment layer thickness of about 3km while it is absent for in the Saurashtra horst. It may be mentioned that the Cambay basin is an oil producing basin.
iv) The S-wave velocity at the lower crust remains constant at 3.9 km/s, while it varies from 3.2 to 3.6 km/s in the upper crust. The younger formations above the upper crust (say surface to 5 km depth) have different lithology as these are formed after the evolution of the basins and horst in the Cretaceous.
The velocity models retrieved through the present study would be much useful in seismic hazard assessment and to understand the crustal configuration and to understand evolution and tectonic history of the western part of India.

