


 English (pdf)
 Article in xml format
 Article references
 Send this article by e-mail
 Cited by SciELO
  Cited by Google
  Similars in
SciELO
Similars in
SciELO  Similars in Google
 Permalink
Introduction
With a heightened level of global oil and gas exploration, fractured hydrocarbon reservoirs have become an important new field for exploration (He & Wei, 2007; Pu & Qin, 2008) The identification, accurate description, and semi-quantitative-qualitative study of the tectonic fractures in reservoir strata are the keys to their effective development at a later stage (Pu et al., 2008). Consequently, the quantitative prediction of fractures has become an effective research method at present.
Researchers have undertaken numerous studies in connection with fracture prediction methods. Dai & Wang (2003) and Pu et al. (2008) have summarized fracture prediction methods, covering the early conventional logging method and seismic method as well as the presently commonly used type theory method and the stress field simulation method. Wang et al. (2016); Yu et al. (2016) and Gao et al. (2015) used the finite element method for stress field simulation to make predictions on fractures. Wang, Dai, Sheng, Qiao & Li (2009) and Wang (2007) applied the fractal dimension method to carry out predictions. These methods have all made major contributions to fracture prediction, but there are still deficiencies in terms of the quantitative prediction of fractures. The fracture development zones in tight reservoir strata are important targets for oil and gas exploration. Tectonic fractures are the main reservoir spaces and seepage channels, and the extent of fracture development has a major effect on the quality and oil and gas production capacity of reservoir strata. Therefore, on the basis of existing research, a "binary method" that combines the rock breaking criteria with the energy method is used in this paper to carry out a study on the quantitative prediction of fractures for the Longmaxi Formation in the Dingshan area. This study aims to predict the development and distribution situation of the tectonic fractures in the reservoir strata of the study area and to provide a new geological reference and basis for oil and gas exploration and development in the area.
Geological background of the study area
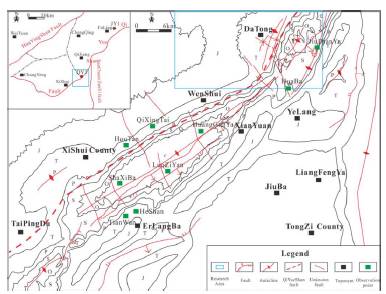
The Dingshan area is located in Qiongjiang City at the juncture between Xishui County of Guizhou Province and Chongqing and is affiliated with Shizhen, Chongqing County, Qiongjiang City. Tectonically, the Dingshan area is located in the down warping fold region of southeast Sichuan, with the southern portion crossing over the juncture between the eastern edge of the waning folded belt and the sloping belt in southern Sichuan (Figure 1), and a Triassic system is exposed on the surface. Dingshan is tectonically subjected to the comprehensive influence of the Huayingshan fault, the Qiyueshan fault, and the Zunyi fault. The tectonic shape is complex, with more developed folds and faults composed of a series of high-dipping anticline belts and fault zones in trough-like folds in the northeastern and north-northeastern directions (Sun et al., 2010). The tectonic structure is now located near the intersection of the north-south and northeastern tectonic belts, with a tectonic belt in the northeastern direction formed under the action of the Jiangnan uplift during the Late Cretaceous epoch and advanced superpositioning of the tectonic structure near the north-south direction. The overall shape of the Dingshan tectonic plane is in the shape of a nose with broken anticlines (Huang, Wei & Wang, 2017; Mei, Liu, Tang, Shen & Fan, 2010; Yuan, 2008) .
The strata of the study area have comparatively complete development. The Proterozoic Sinian system, the Early Paleozoic and Late Paleozoic Permian system, and the Mesozoic Erathem developed from bottom to top. The shale thickness of the Longmaxi Formation is approximately 158-334 m, is generally 250 m, and can be divided into two sections-upper and lower-with the lower section being graptolite shale facies and the upper section interbedded with gray-dark gray calcareous shale and calcareous mudstone with thin gray layers of argillaceous limestone or marl. Since 2013, major breakthroughs in oil and gas exploration have been attained in the field of marine shale gas exploration in the Dingshan area, as daily productions of 3. 4><104 m3 and 10. 5><104 m3 in industrial gas flows were obtained at the DY1 and DY2 wells, respectively, reflecting the good exploration prospects for shale gas in this area.
Fracture development characteristics
Fracture dip
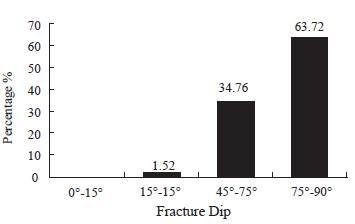
In accordance with the classification criteria of fracture dips, fracture dips less than 15° are horizontal seams, fracture dips of 15°-45° are low-angle seams, fracture dips of 45°-75° are high-angle seams, and fracture dips greater than 75° are vertical seams. A statistical analysis of the field observation data shows that the surface development of seams in the Dingshan area are mainly centered on high-angle seams as vertical seams with fracture dips greater than 75° account for 63. 72%, high-angle seams with fracture dips of 45°-75° account for 34. 76%, and low-angle or horizontal seams did not develop as they only account for 1. 52% of all observed fractures (Figure 2).
Extent of fracture filling
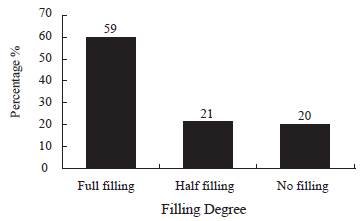
According to core observations and a statistical analysis of image logging data, among the fractures in the reservoir strata of the Longmaxi Formation in the study area, the proportion of unfilled fractures account for approximately 20%, the proportion of partially filled fractures account for approximately 20%, and the proportion of fully filled fractures account for approximately 60%; partially filled fractures and unfilled fractures account for a total of approximately 40%, and these partially filled fractures and unfilled fractures play a comparatively important role in oil and gas seepage (Figure 3).
Fracture density
Fracture density is an important parameter for quantitatively characterizing the extent of fracture development. There are mainly three common ways to express fracture density: linear density, fracture density by area, and fracture density by volume. In this study, linear density is used to describe fracture density. Linear density (LfD) refers to the ratio of the number of fractures nf intersecting with a straight line (perpendicular to the direction of flow or referring to the centerline of the rock) and the length of this straight line LB (Formula 1), which is also called the fracture frequency or linear frequency.
The expression for counting the centerline density of the core is the ratio of the number of observed core fractures and the length of the core, the units are bar(s)/m.
According to the description of core observations and analysis of the logging data and based on the statistical analysis of the core observation results, a statistical analysis was carried out on the core fracture density of the area to describe and analyze the fracture development situation in the study area. It can be seen from the histogram on fracture development density that the density values obtained from the core statistics generally tend to be small, and the fracture densities are mainly concentrated in 0. 5-1 bar/m, 1-1. 5 bars/m, and <0. 5 bar/m. Fractures with densities between 0. 5 and 1 bar/m and fractures with densities between 1 and 1. 5 bars/m account for approximately 32% and 23% of all fracture development sections, respectively. Fractures with densities <0. 5 bar/m and between 2. 5 and 3 bars/m account for 21% and 19% of all fracture development sections, respectively (Figure 4).
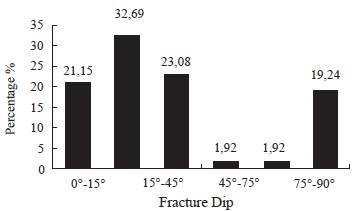
In summary, the vast majority of the fracture densities in the area are less than 1. 5 bars/m; the density is generally small. In analyzing the reason, the first may be related to the proportion of high-angle seams occupying this area as the existence of high-angle seams reduces the drilling ratio; the second may be related to the tectonic site where the observation well is located.
Fracture orientation
Figure 5 is the rose diagram of the overall fracture orientations for all wells in the Longmaxi Formation produced based on the fracture interpretation results of image logging. Overall, the fracture orientations of the study area are mainly in four bearings: northwest-west (290°±10°), near south-north (0°±5°), north-northwest (345°±5°), and northeast (40°±10°).
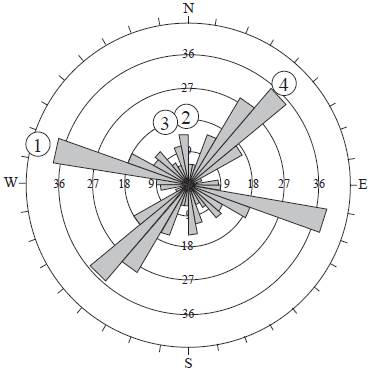
Of those, the fractures in the northwest-west direction (290°±10°) and the northeast direction (40°±10°) are the most developed, followed by near south-north (0°±5°), and the extent of fracture development in the north-northwest direction (345°±5°) is relatively poor.
Fracture distribution and quantitative prediction
Prediction methods
(1) Principal curvature method: Researchers defined the principal curvature method as a mathematical method that portrays the distribution of tectonic fractures in the reservoir strata developed on the basis of the tectonic fracture formation mechanism, which predicts the extent of fracture development in accordance with the extent of the curvature of the layered rock. Huang, Peng, & Wang, thought that the greater the tectonic stress on the strata, the stronger the strata bending action and the higher the principal curvature value, which can further reflect the enhancement of the strata breaking effect and the increase in the extent of tectonic fracture development. Therefore, the principal curvature value can become a characteristic parameter for predicting the interwell distribution of tectonic fractures. In usual situations, the tectonic fracture prediction results obtained through the principal curvature method are often only applicable to longitudinal fractures derived from the bending and deformation of rock layers under force. For most of the oil and gas fields, the tectonic fractures in the reservoir strata are mainly shear fractures formed under the action of tectonic compression, and the proportion of longitudinal fractures is very limited. Therefore, the advantages of using the principal curvature method to carry out qualitative or semi-quantitative predictions on the tectonic fractures are more obvious, but there is a certain level of difficulty in carrying out quantitative predictions.
(2) Rock breaking method: According to the findings in the study on the strength theory of rock mechanics by Zhiying Xu, Shuai Yin, et al. , the stress-strain function is generally used to characterize rock failure conditions-that is, the breaking strength criteria-of which there are generally five categories based on the criteria proposed by Mohr (1900): the maximum positive strain theory, Mohr's strength theory, the shear strain energy intensity theory, the octahedral stress theory, and Griffith's strength theory. Each criterion category has different conditions and different criteria, and the breaking criteria used also differ as environmental conditions differ. The shale gas reservoir strata are generally buried deeper with a greater confining pressure, and the Mohr-Coulomb criterion can usually be used as the basis for determining rock breakage.
According to Mohr's theory, the expression for the rock failure proximity coefficient is η=f (σ)/ K (κ), and the meanings expressed by its parameters are shown in Figure 6.
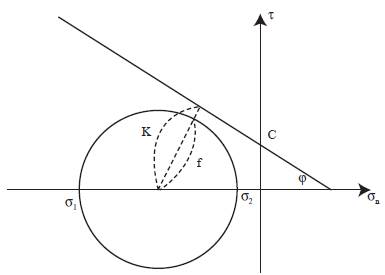
The specific expression is
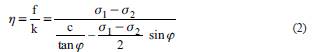
In the formula, σ1 and σ2 are the maximum and minimum principal stresses, respectively, c is the cohesive force of the rock, and φ is the internal friction angle of the rock.
When η ≥ 1, the rock begins to break and generate a fracture; the greater the value of η, the stronger the breakage of the rock and the more developed the fracture.
When η<1, the rock is stable, no breakage is generated, and a fracture does not develop.
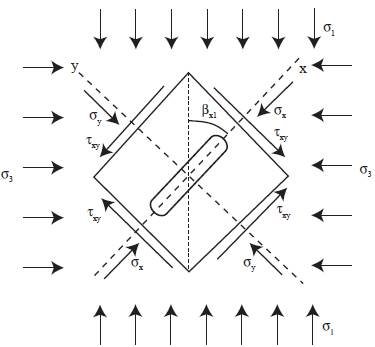
The values of c and φ reflect the state of molecular cohesion within the rock and indicate the brittleness of the rock, which is an important factor when studying the extent of rock fragmentation. In principle, it is believed that the greater the comprehensive breaking value of the rock, the more developed the tectonic fracture system, wherein the state of local stress near the fracture is as shown in Figure 7, in addition to the maximum and minimum principal stresses near the fracture, the internal friction angle also has an effect, which is the main factor for the generation of fractures.
(3) Energy method: For fracture prediction, Ju W. and Huizhen Song et al. proposed a rock energy method that uses the specific energy of strain to carry out predictions on fractures. To compensate for the deficiency in the inability of η to independently determine the extent of fracture development after the rock breaks, the deformation energy value is used as a supplementary criterion of the breakage criteria to jointly study the extent of tectonic fracture development. When breakages occur in rocks, those with large energy values may develop more fractures.
The specific energy of strain per unit volume in the strata (that is, the deformation energy value) is given by the following formula:
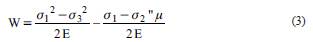
wherein E is the elastic modulus, and μ is Poisson's ratio
The specific energy of strain can become the supplementary criterion of the breaking criteria to compensate for the deficiency in the inability of the η value to independently determine the extent of fracture development after breakage, reflecting the high or low extent of tectonic fracture development.
(4) Binary method: The rock breaking value represents the possibility of tectonic fracture development, and the energy value represents the size of the ability for tectonic fractures to develop. The use of the rock breaking value alone cannot determine the extent of tectonic fracture development after a rock breaks. Similarly, when considering only the energy value, the extent of tectonic fracture development also cannot be accurately judged. The simulation results of these two methods also often complement one another, and both must be combined to enable accurate judgment of the extent of fracture development in the rock strata.
Therefore, when predicting the tectonic fracture distribution in this study, the research outcomes of Ding (1998) and Xingui Zhou et al. were used to comprehensively consider these two methods-the rock breaking method and the energy method-and a "binary method" was proposed (the extent of tectonic fracture development is jointly determined by two aspects-the rock breaking rate and the strain energy density); the rock breaking rate represents the possibility of tectonic fracture development, and the strain energy density represents the size of the ability for tectonic fractures to develop. When the rock breaking rate is comparatively low, not reaching the critical value that causes macroscopically obvious shear breakage to occur to the rock, the extent of tectonic fracture development is primarily determined by the rock breaking rate; after the rock breaking rate reaches the critical value, macroscopically obvious shear breakage has already occurred in the rock, and the extent of tectonic fracture development is primarily determined by the strain energy density at this time. In actual application, the rock breaking rate and the strain energy density are used together with the linear density of tectonic fractures in carrying out fitting calculations, and the fitting relationship formula is then used to carry out predictions on the distribution pattern for the tectonic fracture density of the reservoir strata. According to the guiding ideology of this method, the rock breaking rate η and the strain energy density W together with the linear density of tectonic fractures D are fitted in accordance with the following equation to establish a mathematical model for the quantitative prediction of tectonic fractures based on the rock breaking value and the energy value:
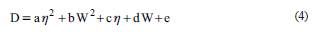
In the formula, D is the predicted value for the linear density of the tectonic fracture in bar(s)/m, η is the dimensionless rock breaking coefficient, W is the energy value, and the others are the fitting coefficients.
Distribution prediction results
Through the rock breaking criteria and the energy formula, the rock breaking values and the energy values of the Longmaxi Formation in the Dingshan area were calculated. The rock breaking values of the Longmaxi Formation were greater near the DS1 well, the DY4-S2 well, and the DY3 well, with a maximum of up to 2. 1 J/m (Figure 8); the energy values were greater near the areas of the DS1 well, the DY1 well, and the DY1-5 well, with a maximum of up to 1. 03 J/m (Figure 9). As a whole, the overall trend of the rock breaking values and energy values for the Longmaxi Formation in the Dingshan area was a gradual decrease from a southeast to a northwest direction, and the fractures in the southeastern portion of the study area were more developed.
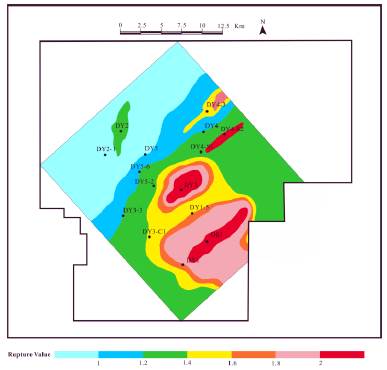
Figure 8 Late Yanshanian-middle Himalayan rock rupture value distribution of the Longmaxi formation in Dingshan area
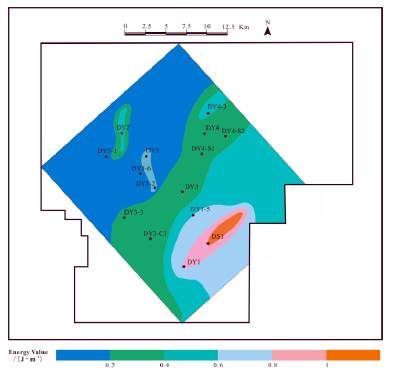
Figure 9 Late Yanshanian-middle Himalayan rock energy value distribution of the Longmaxi formation in Dingshan area
There are certain limitations to carrying out quantitative predictions using any one of the breaking values or energy values alone as it is impossible to completely include the possibility of fracture development and the size of fracture development from a quantitative perspective. The comprehensive breaking value and energy value can complement each other in the simulation calculations.
Therefore, through the statistics on the rock breaking coefficient and specific energy of strain for every well (Table 1), analysis and fitting were carried out using actual measurements of tectonic fracture density with the rock breaking coefficient and energy value-that is, the specific energy of strain-of the corresponding well through Formula 6 to obtain the mathematical model for predicting the tectonic fractures of the Longmaxi Formation in the Dingshan area in the Late Yanshan-Middle Himalayan Period.


In the formula, D represents the tectonic facture density of the Longmaxi Formation, W represents the strain energy, η represents the rock breaking value, and R represents the fitting correlation coefficient.
Based on the tectonic fracture prediction model, the development and distribution situation of the tectonic fractures for the Longmaxi Formation in the Dingshan area can be obtained (Figure 10). It can be seen through the prediction results that the fracture densities are higher near the DS1 well, the DY3 well, and the DY4-S2 well, being up to 2. 22 m-1, and the overall trend shows a gradual decrease from a southeast direction to a northwest direction.
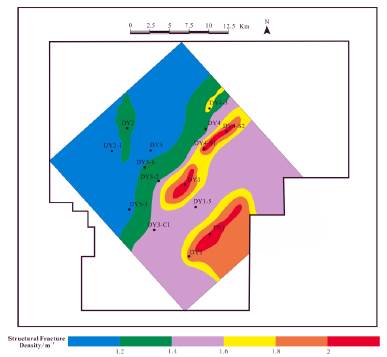
Figure 10 Late Yanshanian-middle Himalayan structural fracture density predictive distribution of the Longmaxi formation in Dingshan area
The accuracy of the prediction results was verified by using relative error (f) to reflect the degree of accuracy of the tectonic fracture predictions. It is generally thought that if the relative error results do not exceed 25%, then the prediction model is considered good and can be established, and the prediction results obtained for the fracture distribution are also credible.
The relative error formula is
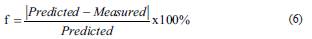
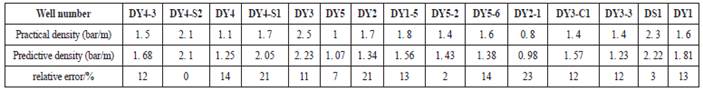
Through an analysis and comparison of the actual measured values of the fracture densities and the predicted densities of the Longmaxi Formation in the Dingshan area, the relative errors for all wells in the Dingshan area were found to be all within 25% (Table 2). The actual measured values basically coincided with the observed values, and the overall conformity effect was very good. The prediction results were satisfactory, and the fracture distribution prediction results were credible.
Conclusions
(1) The tectonic fractures of the Longmaxi Formation in the Dingshan area were found to be centered on high-angle and vertical seams, the main developments are fractures in the northwest-west direction and the northeast direction, and the fracture filling was found to be comparatively severe as most were invalid fractures.
(2) On the basis of a survey of the tectonic fracture methods, a binary method that comprehensively utilized the rock breaking method and the energy method was used to carry out fracture formula fitting and prediction on the strata of the Longmaxi Formation in the Dingshan area and to establish a mathematical model for the quantitative prediction of fracture distribution. The prediction results showed that the density errors were all within 25% and that the prediction results were satisfactory.
(3) On the basis of the mathematical modeling results of quantitative prediction, the distribution pattern of the Longmaxi Formation in the Dingshan area was studied. The study showed that the overall fracture density of the Longmaxi Formation in the study area is relatively high and that the fracture densities near the DS1 well, the DY3 well, and the DY4-S2 well are up to 2. 22 bars/m, and the overall trend showed a gradual decrease from a southeast direction to a northwest direction.

