


 English (pdf)
 Article in xml format
 Article references
 Send this article by e-mail
 Cited by SciELO
  Cited by Google
  Similars in
SciELO
Similars in
SciELO  Similars in Google
 Permalink
Introduction
With the technology of satellite remote sensing ground observation developing in these years, high temporal resolution, hyper-spectral resolution and multi-platform remote sensing images data increase rapidly; remote sensing images in different resources are different in spectral resolution, radiance resolution and spectral resolution (Fang, Huo & Ma, 2016; Sun, Fu & Wang, 2011); Leading different remote sensing images have diversities in images fusion algorithm (Luo & Du, 2017; Zhao, Li & Lei, 2016; Chen, Zhang, Zang & Dong, 2016; Chen, 2016; Xie, Zhang, Sun & Pan, 2016; Du, 2015) . Some researchers have studied and disposed the GF-2 remote sensing images data fusion. By using HIS transform, PCA transform, wavelet transform, HIS+wavelet transform, HIS+PCA transform, PCA+wavelet transform, HIS+PCA+wavelet transform, the fusion experiments on GF-2 images data by Wang Aiyun, and "HIS + PCA + wavelet transform" was finally selected as the best fusion method of GF-2 images data in mountainous area (Wang, 2016) . Ren Jintong, Yang Wunian and others evaluated the different fusion effects of GF-2 images by using commonly used image fusion methods such as HSV transform, Brovery transform, PCA transform, Gram-Schmidt Pan Sharpening (GS) and color normalized (CN), the results showed that the comprehensive performance of GS fusion was best, and it could meet the needs of the general image fusion processing (Ren, 2016) . Meng Fanxiao, Chen Shengbo and others choose eight fusion methods such as Gram-Schmidt, HCS, HPF, Pansharp, High Pansharp, PCA, Multiplicative and Subtractive to fuse GF-2 images, the results showed that: (1) All eight methods increased the spatial information, while maintaining the original spectral information. (2) Among them, HPF method was the best fusion method, followed by Gram-Schmidt method, followed by Multiplicative, PCA, Subtractive, HCS and High Pansharp. The Pansharp method was the worst (Meng, Chen & Zhang, 2016) . However, these research can only evaluate qualitatively or quantitatively the quality of fusion images; the adaptation of classification algorithm in fusion images is still needed to be analyzed.
In this study, the common image fusion algorithms were used to fuse the GF-2 images data, such as PCA, Pansharp, Gram-Schmidt and NNDiffuse. After that, the fusion images were evaluated from subjective qualitative evaluation and objective quantitative evaluation. Moreover, different machines are based on object-oriented learning classification algorithm for classifying fusion images to study different fusion dispose methods, and classification algorithm to the precision influences and classification adaptation in urban areas GF-2 satellite remote sensing images.
Study Areas Condition and Remote Sensing Preprocess
Study Areas Condition
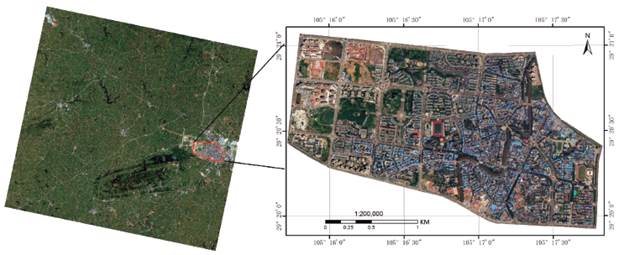
Longchang city is located at the south of SiChuan basin of China, its location is east longitude 105°02׳105°26-׳, northern latitude 29°11׳29°32-׳, it is in subtropical humid monsoon climate, the annual average temperature is 17. 6 °C (Wang, 2016) . The geomorphology in Longchang is the low hilly system of Huaying mountains extending to the southwest. The terrain is gentle, which generally presents high north to low south trend. The average elevation are 300-400m and the relative height are 20-50m. This area has four geomorphologies: PingBa, high hill, low hill and low mountain (Ren, 2016) .
This study was based on GF-2 satellite remote sensing image data(GF2_ PMS2E105. 2_N29. 4_20160720_L1A0001709692)which was provided by Sichuan High Resolution Ground Observation System Data and Application Center to launch projects. The experimental data includes 1m panchromatic and 4m multi-spectral data. The scale of panchromatic band spectrum: 0. 45-0. 90 μm, and the scale of multi-band spectrum: blue (0. 45-0. 52 μm), green (0. 52-0. 59 μm, red (0. 63-0. 69 μm) and infrared (0. 77-0. 89 μm). Longchang city images needed to be cropped to acquire study areas, for instance picture 1: The major ground objects features in Longchang city were vegetation, water, road, bare land and building sites.
GF-2 Remote Sensing Images Data Preprocess
In order to improve the visual effect and interpretability accuracy of the images, such as image enhancement, radiation calibration, orthorectification, atmospheric correction, image registration, cropping and resampling Preprocessing works had been applied to pre-processing of GF-2 satellite image data.
(1) The linear stretching treatment (Linear 3%) was used in the ENVI5. 3 software because the original GF-2 satellite remote sensing images data has low brightness value and dim hue. (2) These images data which was disposed by othochromatic correction was based on RPC documents (provided by GF-2 satellite remote sensing data) and ASTER GDEM V2 DEM data (provided by http://www.gscloud.cn/ website, 30m resolution). (3) In order to decrease influences of atmosphere to images data, the GF-2 satellite remote sensing data were irradiated and calibrated by using the "2016 National Terrestrial Observing Satellite Absolute Radiation Calibration Coefficient" which is provided by China Resources Satellite Application Center, and then the ENVI5. 3 software rapid atmospheric correction model was used to do atmospheric correction. (4) The Image Registration Workflow correction tools were applied to dispose multi-spectral bands which were based on GF-2 satellite remote sensing images panchromatic band. (5) In order to study ground features in survey regions, cropping and resampling were good methods to acquire panchromatic and multi-spectral images data.
Methods of fusion remote sensing images and results.
Methods of fusion remote sensing images (1) PCA fusion
PCA (Principal Component Analysis) is based on no unidimensional multi-linear orthogonal transformation (Meng et al., 2016) , it does principal component on multi-spectral data, then the first principal component band is replaced by high resolution bands and fusion images are acquired through principal component (Liu, 2014) .
Because the PCA fusion models are always used in different types of sensor data fusion or the same sensor which has multi-phase data contrast analysis. This fusion method is able to be used in more than 3 bands images fusion and integrate high resolution images spatial information. However, it has some weaknesses. Comparing with the original spectral images, this method may lose spectral information like color distortion (Yang & Yang, 2015) .
(2) Pansharp fusion
This method uses least squares to match fusion bands and combines with statistics to decrease dependencies in data sets to accomplishes domestic fusion automation (Yilihamu, Xie & Kong, 2014). The features of this method are to have high spatial resolution, to have good spectral fidelity and to apply into many bands which are not limited by numbers. This is a good method in high resolution remote sensing fusion due to the high fidelity of spectrum and its details (Deng, Chen & Du, 2014).
(3) Gram-Schmidt fusion
It is the multidimensional linear orthogonal transformation which transforms multi-spectrum or high spectrum to orthogonal spatial (Yu, 2015). Then replace the first component of the vector by high images. At last, results are shown by using inverse transformation (Yilihamu et al., 2014). This method is not limited by the number of bands, which can avoid to gathering information in one or more bands. It has high spectral fidelity.
(4) NNDiffuse fusion
The NNDiffuse (Nearest-Neighbor diffuse) method is provided by Rochester Institute of Technology (Liu, Fu & Li, 2015) , which adopts OpenMP and CUDA technologies to increase performance. It has highlights in the quality of fusion images and processing speed. NNDiffuse method can reserve great color and texture and the original images have little change (Wang, Li, Zhang & Dou, 2015). When the spectral response function of multi-spectral bands have the minimum overlap and all the spectral bands cover the scale of spectrum of panchromatic color bands, this method works best.
Evaluating the effect of remote sensing images fusion
Subjective qualitative evaluation
This evaluation focuses on comparing images' spectrum, edge and textures before and after fusion(Zhang, Liu, Yang & Luo, 2015). As can be seen from the Figures 2 and 4, different images are fused in ENVI software to do the RGB false color fusion. Some typical areas which show in Linear 2% stretching to present details are selected. Doing subjective qualitative evaluation in GF-2 which adopts four different fusion images, it can be found that (1) Comparing original multi-spectral images data with fusion images data, the original images have low brightness value, blurred edge of streets and not obvious textures; the panchromatic bands have high resolution, high brightness value and clear edge of the ground, but the color performance is worse than the fused images. (2) The results of Gram-Schmidt fusion are the worst: vague images and large color distortion in false color synthesis of the ground. The Pansharp fusion method is good: clear ground and textures, comfortable brightness. (3) Comparing the NNDiffuse fusion with the PCA fusion, the NNDiffuse fusion looks darker than the PCA fusion, but the ground details and textures clarity are clearer than PCA fusion.
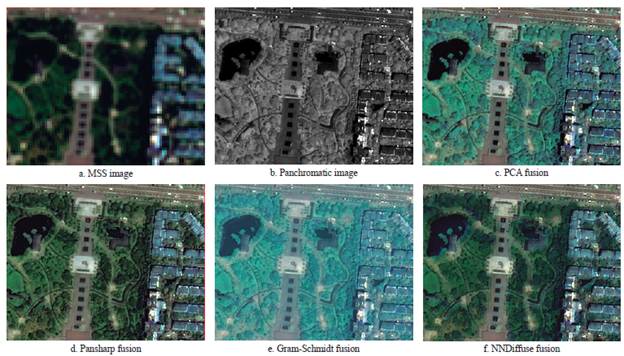
Figure 2 Comparison of the different fusion effects on the original multi-spectral and panchromatic of GF-2
Objective qualitative evaluation
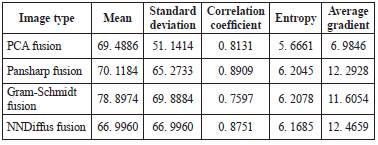
This evaluation is based on measuring the quality of fusion images by statistics(Sun & Messinger, 2014). The study selects mean values and the standard deviation of the brightness information from images, the correlation coefficient of the spectral information, the information entropy of the image information, and the average gradient of the image clarity on the different fusion effects of the PMS data of the GF-2 satellite remote sensing image to do quantitative evaluation.
As can be seen from the Tab. 1: (1) The Gram-Schmidt fusion images have the largest mean value and standard deviation in brightness information, the second are Pansharp fusion images. The NNDiffuse fusion images have the smallest mean value and standard deviation. (2) The correlation coefficient of the spectral information shows that the Pansharp fusion images have the highest correlation with original images. The second are NNDiffuse fusion images and the worst are Gram-Schmidt fusion images. (3) Gram-Schmidt fusion images cover the largest amount of information, then are the Pansharp fusion images. PCA fusion images cover little information. (4) NNDiffuse fusion images have the great average gradient, then are Pansharp fusion images which are no big difference from NNDiffuse fusion images. PCA fusion images have the smallest average gradient.
Extraction
The object-oriented classification method and results
Many scholars use object-oriented classification technologies to do the number of work in algorithm optimization and interpretation(Dong, Zang, Wu & Li, 2017; Wang & Zhang, 2015; Yang, 2016; Yang & Ming, 2016; Wang, Meng, Yang, Yang & Fang, 2016; Jiang & Li, 2016; Zhao, 2016). The eCognition, a good object-oriented classification remote sensing images software which is invented by Definiens Imaging corporation, provides many object-oriented classification algorithms.
This study uses KNN (K-NearestNeighbor, KNN), SVM (Support Vector Machine, SVM) and Random Tress object-oriented classification algorithms to research different GF-2 remote sensing images fusion.
KNN classification algorithm
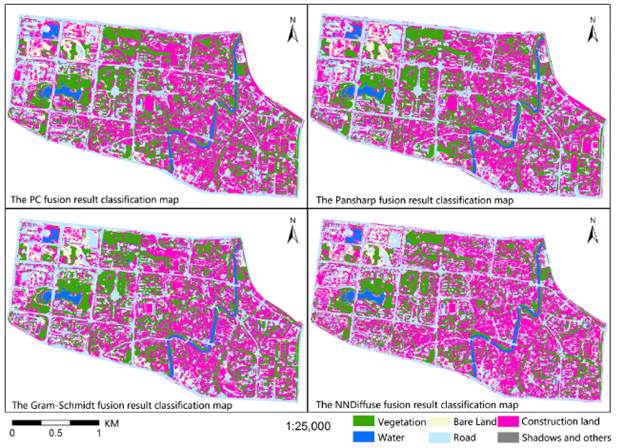
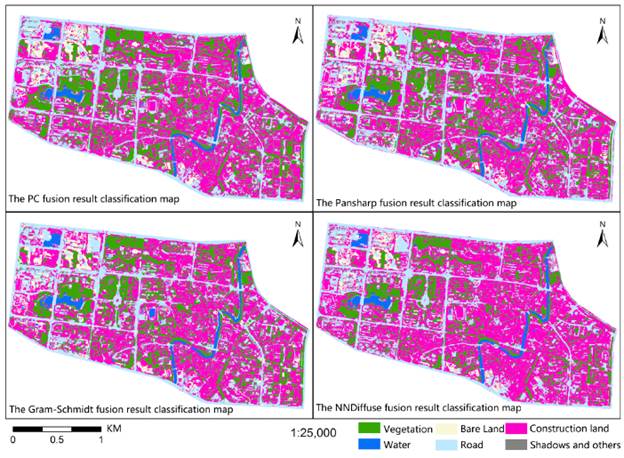
KNN algorithm is one of the mature theory algorithm. It is similar with the traditional supervised classification. Calculating partitioning samples and training samples in the distances of special feature spatial to determine of partitioning samples. These partitioning samples will be determine to classes which have the shortest distances (Yang, 2016). The basic class unit of K-Nearest Neighbor algorithm is object images, which is different from the traditional supervised classification. When determine partitioning objects by KNN method, it is useful to find limited closed samples. The results are related to surrounding samples' distances and numbers. Therefore, it is more effective for crossover or overlapping objects to be classified, and there is no need to estimate parameters in the application process. It is easy to implement and suitable for multi-classification problem (Chen, Shao, Mei, Deng & Hou, 2016). Based on the KNN classification algorithm, the classification results of four different types of fusion images in the study area are shown in Figure 3.
SVM classification algorithm
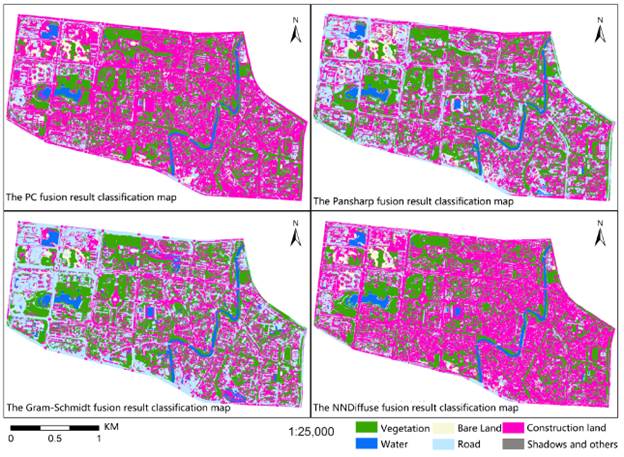
SVM is one of machine learning classification algorithm in supervised classification. Its main goal is to project the sample through the non-linear mapping to the high-dimensional feature space, with the minimization structural risk principle. Vapnik-Chervonenkis Dimension which describes the function sets or learns the complexity of the machine, minimize the classification of the super-plane as a classification surface, making the classification of the upper bound of the risk minimization, so that the classification algorithm has the best ability to be promoted (Liu, 2016). SVM is the most important method in statistics pattern recognition. At first it is come out through linearly separable two classification problems. Then it is applied to non - linear separable problems, non - classifying problems, multi - class classification problems (Fan, 2015). The results which are based on SVM classification algorithm present as Figure 4.
Random Trees classification algorithm
Random Trees algorithm is also called Random Forest classification algorithm. It is a joint forecasting model which is combined by many decision trees. The core idea is to randomize the input samples on the use of recorded data (rows) and specific variables (columns) (Yang, 2015). Through the resampling method by returning the training samples, a number of training set sub-samples are selected from the original samples, and the decision trees are modeled using these sub-sample sets to generate multiple decision trees, the vote to draw the final classification or prediction results are according to the results of the forecast of each tree (Zhang, 2016). The advantages of the random trees algorithm are that they are suitable for the data processing of high dimensional and large data due to the randomness of the sample extraction and the feature tree of the decision tree node, the data is not preprocessed and the parameters are simple. High-dimensional feature data processing, better reflect its stable, efficient and accurate advantages. The results which are based on Random trees classification algorithm present as Figure 5.
Classification Accuracy Evaluation and Results Analysis
In order to do classification accuracy evaluation in different algorithm, this study selected 350 samples randomly by using visual interpretation. The study requires the selected sample areas as small as possible to ensure that it is a single ground feature. Quantitative evaluation of this study was based on the classification accuracy evaluation of general classification accuracy and Kappa coefficient. The overall classification accuracy represented the proportion of samples that were correctly categorized in all samples; the Kappa coefficients which utilized the information of the entire error matrix were generally considered to reflect the overall classification accuracy more accurately. The results of different fusion images classification precision based on different classification algorithms were presented in Tab. 2.
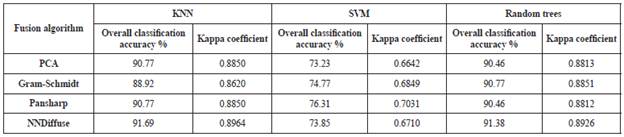
As can be horizontal compared from the Tab. 2. (1) Different classification algorithms were used to classify the images based on PCA fusion, Pansharp fusion and NNDiffuse fusion. The largest classification algorithm of the overall classification accuracy and the Kappa coefficient were the KNN object-oriented classification algorithm, followed by the Random Trees classification algorithm, and the SVM classification algorithm has the worst performance. (2) The best effect of Gram-Schmidt fusion image classification was the Random Trees classification algorithm, followed by KNN classification algorithm. SVM classification algorithm performance was the worst. Therefore, the KNN classification algorithm was the most suitable method for urban ground information classification based on PCA fusion, Pansharp fusion and NNDiffuse fusion. For the Gram-Schmidt fusion, It was useful to use Random Trees classification algorithm in urban ground information extraction; SVM classification algorithm was not useful for the urban ground information extraction in the four fusion methods.
As can be vertical compared from the Table 2. (1) The largest Kappa coefficient and overall classification accuracy were based on the KNN classification algorithm to classify the GF-2 images in NNDiffuse fusion, followed by the Random Trees classification algorithm in NNDiffuse fusion image classification; (2) By using the KNN classification algorithm and the Random Trees classification algorithm, the overall classification accuracy and Kappa coefficient of the image based on PCA fusion and Pansharp fusion were the same. When the SVM classification algorithm was used, the classification result of Pansharp fusion image was better than that of PCA Classification accuracy was higher; (3) Using the Random Trees classification algorithm to improve the accuracy of the image classification results of Gram-Schmidt fusion was better than that of PCA and Pansharp fusion using KNN classification algorithm, and the Gram-Schmidt fusion image classification ratio using KNN and SVM classification algorithm Other fusion effect was worse. Above all, the KNN classification algorithm was most suitable for GF-2 fusion images after NNDiffuse fusion, and then the Random Trees classification algorithm after NNDiffuse fusion was applied. For these four fusion algorithms, the SVM classification algorithm after the PCA fusion was the least useful method for urban ground information extraction.
Conclusion
PCA fusion, Pansharp fusion, Gram-schmidt fusion and NNDifuse fusion were applied to GF-2 satellite remote sensing images data to acquired different fusion results, and then subjective qualitative evaluation and objective qualitative evaluation had be done to estimate results. The KNN, SVM and Random Trees classifier algorithms which are based on the machine learning algorithm in eCognition object - oriented software were used to classify the four different fusion effect images and evaluated the accuracy of the classification results. Combined with the above research work, here are some conclusions:
(1) For the fusion images quality after these fusion methods: from the subjective qualitative evaluation, it could be seen that the best performance of the visual effect was Pansharp fusion image, followed by NNDiffuse fusion, PCA fusion, Gram-Schmidt fusion performance was the worst. From the objective quantitative evaluation, it is obviously that the mean value of Gram-Schmidt fusion was the best, the brightness information was the best, the information entropy was the largest, and the information was the highest after fusion. Pansharp fusion had the strongest correlation with the original multi-spectral image, NNDiffuse fusion and the quantitative evaluation indexes of PCA fusion images were lower than the other three fusion effects, and the quantitative evaluation effect was the worst.
(2) For the different fusion effect images of GF-2 satellite remote sensing images which were based on machine learning algorithm of the KNN, SVM and Random Trees object-oriented classification studied the classification of urban ground information extraction:
From the horizontal comparison, the KNN classification algorithm was the most suitable for PCA fusion, Pansharp fusion and NNDifuse fusion image classification, especially in urban ground information extraction, followed by Random Trees classification algorithm; for Gram-Schmidt fusion image classification effect the best was the Random Trees classification algorithm, followed by the KNN classification algorithm. For the classification of four kinds of fusion images, the SVM classification algorithm was poor and was not recommended for urban information extraction.
From the vertical comparison, it was obviously that GF-2 satellite remote sensing images adopt NNDiffuse fusion and the KNN classification algorithm had the best overall classification accuracy and Kappa coefficient, and it was the best in the urban ground information extraction, followed by the Random Trees classification algorithm. For the four fusion algorithms, the overall classification accuracy and Kappa coefficient of the SVM classification algorithm after PCA fusion processing were the worst, and it was not suitable for urban information extraction.
Above all, it is suggested that the NNDiffuse fusion method should be used for the fusion of GF-2 image data, and the fusion image should be classified by KNN or Random Trees classification algorithm. The SVM classification is not recommended to applied to PCA fusion. In order to ensure the classification results are comparable, this study in the classification of different classification process, the relevant parameters set the same.

