


 English (pdf)
 Article in xml format
 Article references
 Send this article by e-mail
 Cited by SciELO
  Cited by Google
  Similars in
SciELO
Similars in
SciELO  Similars in Google
 Permalink
Introduction
Radon gas is produced by the radioactive decay of 226Ra, which in turn is derived from the 238U series. Uranium is found in small quantities in all soils and rocks, although the amount varies from place to place. Since its discovery, at the beginning of the 20th century, the radon gas 222Rn (indicated as Rn or radon in the text), has awakened considerable interest due to its harmful effects on human health and its applications in geosciences. In the present study two areas of interest related to radon are combined: as a health hazard and as a natural tracer. The connection of radon with uranium makes it useful as a pathfinder element when searching for uranium rich minerals and indirectly, to identify radon-prone areas that may have the potential to generate high indoor radon levels.
Radon generated within the mineral grains of rocks and soils can escape from them by recoil into air or fluid filled cracks and into the contiguous pore space, respectively. This can be quantified by the emanation coefficient, which depends on the availability of 226Ra, porosity, moisture content and temperature (Nazaroff, 1992). Subsequent transport from the place of escape into the gas/fluid phase towards the earth surface occurs by diffusion and convection/advection. Radon transport is influenced not only by local geology as rock types, but by other geophysical and geochemical parameters as joints, fractures, hydrology, porosity, permeability and presence of other gas carriers. These characteristics are, in turn, determined by the character of the bedrock, glacial deposits, or transported sediments from which the soil was derived (Gundersen et al., 1992; Alonso et al., 2019). Soil-gas radon concentrations can vary in response to climatic and weather changes on hourly, diurnal, or seasonal time scales (Sundal et al., 2008; Zafrir et al., 2012). The most important meteorological factors appear to be barometric pressure, wind, relative humidity, rainfall, and temperature.
Geology is the most important factor controlling the source and distribution of radon (Appleton & Miles, 2010). The release of radon from rocks and soils is controlled largely by the types of minerals in which uranium and radium occur. Granite, metamorphic rocks, black shales, and some volcanic rocks may be enriched in uranium; these rocks, and the soils derived from them, are the most common sources of radon gas (Sprinkel & Solomon, 1990). Uranium concentrations in igneous rocks are usually higher compared to sedimentary ones, excepting shale, deep-sea sediments and phosphate rocks, while metamorphic rocks have concentrations similar to those of the rocks from which they were derived. The content of uranium in igneous rocks depends on the origin and composition of the rock, for example, high silica igneous rocks contain relatively higher U concentrations compared to such basic low silica igneous rocks as basalt (IAEA, 2014).
Because of its inert gas geochemistry and its radioactivity, radon has been recognized as a potential tracer of fault systems (Al-Tamimi & Abumurad, 2001; Walia et al., 2008), as an important tool to forecast earthquakes and volcanic eruptions (Zmazek et al., 2005; Neri et al., 2006; Giammanco et al., 2007; Pérez et al., 2007), as a good indicator of hydrocarbon leakage from reservoirs (Matolin & Stráník, 2006; Palacios et al., 2016), to wide range of applications as a tracer in marine and hydrological settings. Several studies have demonstrated that radon concentrations in soil and groundwater are controlled not only by types of rocks and geohydrological characteristics of rock mass but also by tectonic processes (Choubey et al., 1999; Choubey et al., 2010). Landslides, which result due to geodynamic processes, have also been considered as a source of radon (Purtschller et al., 1995).
Recent studies revealed that spatial distribution of indoor radon concentration in Lima City can be represented by two different areas: one with concentrations <100 Bq/m3 and the other in the range (100 - 300) Bq/m3 (Pereyra et al., 2018). Several factors may have influenced on this distribution, however the two major factors determining indoor radon concentration are the entry rate and the ventilation rate. The entry rate is the most important factor in determining houses with high radon levels (Nazaroff & Nero, 1988). It depends on soil gas radon concentration, on soil physical characteristics such as permeability, on meteorological circumstances such as temperature and pressure, and on building-related factors. Geogenic Radon Potential (GRP) provides information about the source of indoor radon concentration and depends on the equilibrium activity concentration (Rn concentration in soil gas at about 1 m depth), and soil permeability. Criteria have also been established for radon hazard assessment considering only the soil radon as the source of high indoor radon concentration (Åkerblom et al., 1984; Snih, 1992).
Most of the area of Lima City is built on alluvial deposits originating by the Chillón and Rímac Rivers, which eroded, transported and deposited materials from the geological formations present in their beds. Throughout their courses, these rivers interact with rock formations of different geological origin, and different chemical (e.g., uranium content) and mineralogical composition. It is to be expected, then, that one of the main source of variation of radon concentration in soil pores beneath and around dwellings in Lima City could be related to the type of rock originating the alluvial deposits. Thus, some association could be found between radon indoors and main parent material of the alluvial soil on which dwellings are located.
Indoor radon measurements in Lima City shows the highest concentration in houses located at northeast of the Rímac District (Pereyra et al., 2018). In this area, landslides and avalanches of rocks, debris and sediments caused by the floods of the Rímac and Huaycoloro rivers have historically occurred.
Although the alluvial parent material in the Lima City area is related to the occurrence of two lithologies, with rocks containing different amounts of uranium, the relationships between uranium content in parent material and soil gas radon in a given area is not obvious, since many factors and processes may contribute to influence the latter.
In this paper a study is made on the average spatial and temporal behavior of radon in alluvial soils of Lima City in order to evaluate the possible relationship between soil radon concentration and the origin of deposited parent material. In addition, to evaluate if temporal variations of soil gas radon were related to the seismic events and to the natural phenomenon "El Nino Costero" occurred during measurements.
MATERIAL AND METHODS
Characteristics of the study area
Lima City is located at the west central Peru, in a desert stripe between the Pacific Ocean and the Andes, mostly on flat terrain of the Peruvian coastal plain within the valleys of the Chillón, Rímac and Lurín rivers (Fig. 1). The Chillón River is to the north, the Rímac River in the center and the Lurín River is to the south. These rivers have contributed significantly to the erosion and transport of loose materials, resulting from the erosion of hills present along their channels. The geology of the Lima region reflects the subduction of the Nazca Plate under the South American Plate and consequent uplift and volcanic activity. This subduction zone is constantly generating seismic activity. The geomorphology of Lima is a tectonic and plutonic result superimposed by the processes of geodynamics. According to the lithology, in the northern area of Lima there are volcanic rocks along the Chillón River resulting from the presence of the chain of Huarangal and Quilmará volcanoes, formed at the end of the Mesozoic and beginning of the Cenozoic age (80 million years ago) and currently all are inactive (Hakl et al., 1992). The alluvial cones were the result of the accumulation of debris formed by blocks, clasts and gravels of volcanic-sedimentary origin with silty sandy matrix. In the central part of Lima, where the Rímac River flows, we find intrusive and metamorphic rocks, with little presence of plutonic rocks, predominating granodiorites that are found along the course of the Huaycoloro River (tributary of the Rímac River). From the upper part to the dejection cone, the Rímac River and its tributaries have eroded shale sedimentary rocks, Paleogene-Neogene volcanics, and Middle Cretaceous to Upper and Triassic-Jurassic limestones. At lower elevations and farther to the west, intrusives emerge at the edges of the dejection cone of the Rímac River, mostly of Upper Cretaceous intermediate composition. In the area of Lima City, volcanic rocks of the middle Cretaceous Casma formation, compact sedimentary rocks of sandstones, shales, and lower Cretaceous limestones emerge (Palacios et al., 1992). Unlike the main parent material deposited by the Chillón River, most of the material deposited in the alluvial fan of the Rímac River generally has low uranium content. In the south, the Lurín River, with similar characteristics to the Rímac River, transports meteorite material from the hills to the Lurín valley (farmland) until it reaches the sea (see Fig. 1).
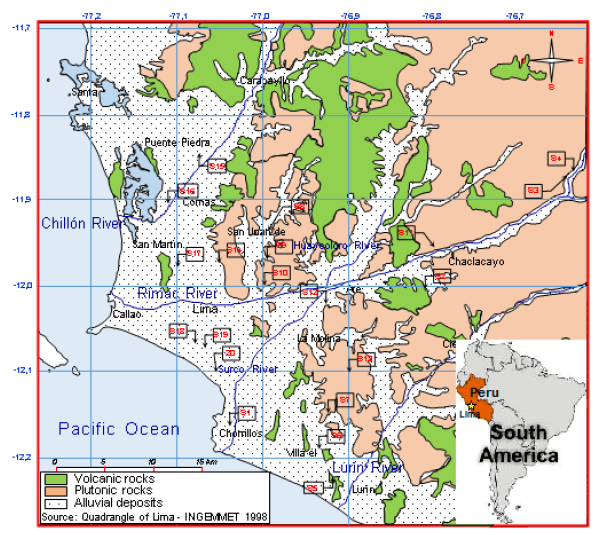
Figure 1 Map of Lima City quadrangle showing its lithology (Palacios et al., 1992), the main rivers that formed the alluvial fan deposits on which Lima City is situated, and spatial distribution of the 20 measurement points locations (holes) in the 15 districts.
Lima City has an arid climate, with deficiency of rainfall throughout the year, maintains a semi-warm temperature and a humidity of 64% to 75%. Because it usually does not rain and the atmospheric pressure practically does not change, the observed seasonal changes are possibly due to changes in temperature.
Uranium occurrences in Peru are distributed according to different geological environments (magmatic-sedimentary) that do not obey exclusively to a geological time. In Lima Region, five prospects of uranium deposits of relatively low average grade (0.060) were identified, totalling 10,556 metric tons of U3O8 (Rivera, 2010). They are located in the area of volcanic rocks northeast of Lima City (Fig. 1), particularly in andesitic lavas of Quilmaná Volcanic (Upper Cretaceous) that emerge in the Chillón River (Palacios et al., 1992; Perales, 1994). In this area, which has the Casma Group as the main host rock, deposits of massive volcanogenic sulphides of Pb-Zn-Cu were formed (Chira et al., 2018), confirming the behavior of these elements as pathfinders associated with uranium (Kurt et al., 2009). The Quilmaná and Huarangal formations present in the Chillón and Huaycoloro river basins are part of the Casma Group, which consists mainly of volcanic materials including rocky fragments of shales and sandstones, and andesitic lavas (Villacorta et al., 2015).
Previous analysis indicates that erosion materials deposited in the dejection cone of Chillón and Rímac rivers are associated to rock formations with different uranium contents.
Due to the natural phenomenon "El Nino Costero", intense anomalous rainfall caused multiple phenomena of mass movements (debris and sludge flows, landslides, rock falls, river erosion of hillsides, etc.) and floods (huaycos), which affected a large part of Lima City in summer of 2017. The erosion of slopes in the outcrops of volcanic and intrusive rocks, very fractured and weathered, provided material for transport and subsequent deposition. The most important forces and phenomena related to the physical processes of huaycos might be gravitational acceleration down slopes, the resistance experienced by the flow and the processes of erosion and deposition of particles, by which the flow exchanges mass with the underlying boundary. However, fundamental understanding of the mechanisms of particle erosion from an underlying substrate by a huayco is lacking (Hogg, 2018).
Radon measurement method
A hole of about 1.8 m deep was drilled at each site where radon will be monitored. This depth ensures the measurement of the equilibrium activity concentration, a determining factor of the GRP. The hole was sheathed with a PVC tube approximately 2 m long. The tube was inserted inside the hole and dropped to its bottom. The space left between the tube and the subsoil is filled with part of the extracted soil material. An integrating track detector, cellulose nitrate LR-115 type 2, was fixed at a distance of 20 cm from the bottom of the hole staying its sensitive side facing the soil radon emanating surface. In this configuration, the LR-115 detector was exposed just to the volume of gas within 20 cm under it, registering only the alpha particles emitted from the effective volumes of each airborne radionuclide. The effective volume of 222Rn is located approximately between 1 - 3 cm from detector surface, but approximately between 3 - 6 cm and 6 - 8 cm for the most energetic radon and thoron progenies, respectively (Rojas et al., 2018). Fig. 2 shows details of the installation of PVC tube in the hole and the sketch of the monitoring system. During the exposure period of detector, a cap screwed tightly on top of the tube housing isolates it from the outside. Bore-holes closed from environmental air exchange do not allow the soil gas to flow freely into the atmosphere, therefore, the rate of diffusion controls the radon migration process (Shweikani & Hushari, 2005; Papp et al., 2008). The detector assembly enclosed in a PVC pipe housing reduces the influence of environmental factors such as temperature, air pressure, wind and moisture. Using similar procedures, other authors have considered the method as stable since the atmospheric parameters have little influence on the radon concentration inside the hole (Ciotoli et al., 1998; King & Minissale, 1994; Papp et al., 2008).
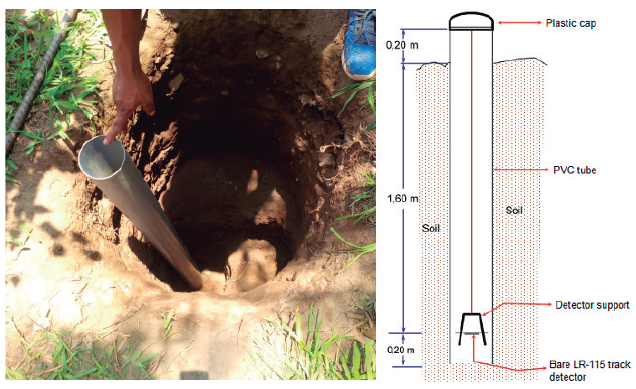
Figure 2 Installation of a measuring point in San Juan de Lurigancho district (left), and schematic view of the hole with closed PVC tube and the radon measurement system (right).
The distance of the LR-115 detector to the bottom of the hole causes negligible contribution of thoron gas to the track density because it decays before reaching the effective volume. The distribution of 220Rn atoms exhaling from soil surface decreases exponentially with the distance to the bottom of the hole, in a manner analogous to what happens in front of a wall (Godoya et al., 2002; Hadler & Paulo, 1994; Chauhan et al., 2017) or inside a diffusion chamber (Urosevic et al., 2008; Nikezic & Stevanovic, 2007). Since the main mechanism of gas transport within the PVC tube is diffusion, very few thoron atoms can reach 20 cm from the source because their diffusion length is approximately 2-3 cm for the commonly used air diffusion coefficient values. For example, assuming a diffusion coefficient in air of 1.2 10-5 m2/s, the diffusion lengths
 for 220Rn and 222Rn would be 3.1 cm and 239.2 cm, respectively (Huxol et al., 2012). Thus, at a distance (d) of 20 cm from a surface only 0.16% of the exhaled 220Rn atoms would arrive
 , while 92% of the exhaled 222Rn atoms could reach the same distance (Bonotto & Andrews, 1999). The first 220Rn progeny (216Po) behaves as its progenitor due to its very short half-life. The rest of the 220Rn progeny, and practically all 222Rn daughters, are almost completely deposited on all internal surfaces within the PVC tube due to the plate-out effect (Hadler & Paulo, 1994; Paulo et al., 2001; Nikezic & Stevanovic, 2007) such as the bottom hole, inner surfaces of the PVC wall and lid, and surfaces of detector support. In short, due to very short half-life (T1/2=55.6 s), 220Rn atoms cannot be homogenously distributed into the PVC tube and decreases exponentially with the distance from the bottom of the hole in opposite to the 222Rn atoms (T1/2=3.82 d) (Urosevic et al., 2008). Previous considerations seem to indicate that radon is the main contributor to track density in the LR-115 detector, so in this study no filtering membrane was used at the entrance of the radon cup. Kumar et al. (2017) used the same principle for soil radon measurement and discrimination of radon and thoron concentrations in soil gases. Furthermore, some negative aspects of the filtering membranes, such as large variation of their gas permeability with temperature and reduction of detector sensitivity to radon (Fleischer et al., 2000; Tommasino, 2016), supported the decision of not using them.
In summary, using the described setup the measurement of 222Rn is practically not influenced by the 220Rn soil gas concentration.
Spatial distribution of measurement sites
Radon measurements in soil pores were carried out in places near and far to Chillón, Rímac and Lurín rivers. The selection of the observation sites was conceived in order to cover all districts of Lima City. To get an idea of the potential contribution of soil to indoor radon, 20 measurement sites were distributed in the 15 districts of Lima City. Detectors located inside the PVC-tubes were coded from S1 to S20. Table 1 shows the coding of each one and the distances of each hole to the nearest riverbank. The minimum and maximum distances between a hole and the riverbank were 0.4 km and 9.4 km, respectively. The holes were drilled in ground of residential houses to ensure the ease and safety of access for the recovery and periodic change of detectors. Figure 1 also shows the locations of the measurement sites (tip of the arrows). Previsions were taken so that measurement sites were not affected by rains.
Table 1 Codes of measurement sites and distances of each detector hole to the nearest riverbank.
| Site code | District | Latitude | Longitude | Nearest river | Distance (km) |
| S1 | Chorrillos | -12.17 | -77.02 | Surco | 0.73 |
| S2 | Huaycan | -12.02 | -76.82 | Rímac | 3.00 |
| S3 | Santa Eulalia | -11.90 | -76.66 | Santa Eulalia | 0.17 |
| S4 | Cuspanca (Chosica) | -11.89 | -76.65 | Santa Eulalia | 0.06 |
| S5 | Villa el Salvador | -12.24 | -76.92 | Lurín | 2.81 |
| S6 | Villa María del Triunfo (1) | -12.19 | -76.94 | Lurín | 7.48 |
| S7 | Villa María del Triunfo (2) | -12.15 | -76.93 | Lurín | 8.72 |
| S8 | San Juan de Lurigancho (3) | -11.94 | -76.99 | Rímac | 9.40 |
| S9 | San Juan de Lurigancho (1) | -11.97 | -77.00 | Rímac | 6.13 |
| S10 | San Juan de Lurigancho (2) | -12.01 | -77.01 | Rímac | 1.90 |
| S11 | Chaclacayo | -11.98 | -76.80 | Rímac | 0.40 |
| S121 | Ate | -12.04 | -76.93 | Rímac | 2.06 |
| S13 | Manchay | -12.10 | -76.88 | Lurín | 7.06 |
| S14 | Independencia | -11.98 | -77.04 | Chillón | 6.84 |
| S15 | Carabayllo | -11.86 | -77.06 | Chillón | 2.67 |
| S16 | Puente Piedra | -11.93 | -77.10 | Chillón | 1.56 |
| S172 | San Martín de Porres | -11.99 | -77.09 | Rímac | 4.45 |
| S18 | Pueblo Libre | -12.07 | -77.07 | Rímac | 4.47 |
| S19 | Jesús María | -12.09 | -77.06 | Pacific coast | 2.44 |
| S203 | Miraflores | -12.11 | -77.04 | Surco | 4.74 |
1Also at 3.9 km of confluence of rivers Huaycoloro and Rímac
2Also at 5.34 km from Chillón River
3Also at 1.00 km from Pacific Ocean coast
Exposure time and detector processing
All detectors were exposed simultaneously during periods of 14 days in the PVC tubes installed permanently in soil. Data collection was conducted over 36 consecutive periods in the 20 holes from April 2016 to September 2017 (Table 2). After exposure, detectors were chemically etched in 2.5 N NaOH solution at 60°C during 90 minutes (Fleischer et al., 1975; Salama et al., 2006; Mehta et al., 2014; Pereyra et al., 2015). Etched detectors were analyzed in an automatic reading system (Polytrack) to determine the net track density. The calibration factor that converts the track density rate to time-averaged radon concentration was determined in a radon chamber. Environmental conditions within the chamber were similar to those existing in measurement holes. Reference radon concentration in the chamber was continuously measured by means of the AlphaGUARD DF 2000 monitor, traceable to the primary Rn standard in Physikalisch-Technische Bundesanstalt (PTB), Braunchweig, Germany.
Table 2 Codes of measurement periods.
| Code | From/to/year | Code | From/to/year | Code | From/to/year |
| P1 | Ap. 17/May 01/2016 | P13 | Oct. 2/Oct. 16/2016 | P25 | Mar. 19/Ap. 2/2017 |
| P2 | May 1/May 15/2016 | P14 | Oct. 16/Oct. 30/2016 | P26 | Ap. 2/Ap.16/2017 |
| P3 | May 15/May 29/2016 | P15 | Oct. 30/Nov. 13/2016 | P27 | Ap. 16/Ap. 30/2017 |
| P4 | May 29/Jun. 12/2016 | P16 | Nov. 13/Nov. 27/2016 | P28 | Ap. 30/May 14/2017 |
| P5 | Jun. 12/Jun. 26/2016 | P17 | Nov. 27/Dec. 11/2016 | P29 | May 14/May 28/2017 |
| P6 | Jun. 26/Jul. 10/2016 | P18 | Dec. 11/Dec. 25/2016 | P30 | May 28/Jun. 11/2017 |
| P7 | Jul. 10/Jul. 24/2016 | P19 | Dec. 25/2016/Jan. 8/2017 | P31 | Jun. 11/Jun. 25/2017 |
| P8 | Jul. 24/Aug. 7/2016 | P20 | Jan. 8/Jan. 22/2017 | P32 | Jun. 25/Jul. 9/2017 |
| P9 | Aug. 7/Aug. 21/2016 | P21 | Jan. 22/Feb. 3/2017 | P33 | Jul. 9/Jul. 23/2017 |
| P10 | Aug. 21/Sep. 4/2016 | P22 | Feb. 3/Feb. 19/2017 | P34 | Jul. 23/Aug. 6/2017 |
| P11 | Sep. 4/Sep. 18/2016 | P23 | Feb. 19/Mar. 5/2017 | P35 | Aug. 6/Aug. 20/2017 |
| P12 | Sep. 18/Oct. 2/2016 | P24 | Mar. 5/Mar. 19/2017 | P36 | Aug. 20/Sep. 3/2017 |
Results and discussion
Comments on results of soil gas radon concentrations and on the measurement methodology
The minimum and maximum values of soil gas radon concentration in the study area were 0.1 kBq/m3 and 64.3 kBq/m3, respectively, which show great variability of the data. The average radon concentration ranges from 1.5 kBq/m3 in winter to 11.9 kBq/m3 in spring. The average concentration of Rn in the 20 holes during the entire observation time was 5.6 kBq/m3. There is no history of Rn measurements in soil gases in Lima City. The obtained results are compatible with those reported in similar studies, both using active (Choubey et al., 2005; Szabó et al., 2013; Duggal et al., 2014; Cinelli et al., 2015) and passive methods (Kareem, 2016). They are also similar to those found in zones of fluvial deposits and poorly developed soils whose associated lithologies correspond to plutonic rocks, volcanic magmatic rocks and differentiated magmatic rocks (Alonso et al., 2019). Nevertheless, the average radon concentration of 5.6 kBq/m3 is quite low compared to that reported by Cothern & Smith (1987). The relatively low value could be explained considering that most measurement sites meet one or more of the following points: 1. disequilibrium between radium and uranium due to leaching action (valid for all alluvial surfaces), 2. although the permeability in alluvial soils is fairly high, low emissions of radon can occur in deposits of parent material of volcanic origin due to the low specific surface area of the uranium minerals, 3. generally fairly low uranium concentration in the parent material of plutonic origin, 4. very low bedrock, 5. low moisture content of the soil most of the time. One might also think that the relatively low value is because measurements made with passive nuclear track detectors do not represent the exact radon concentration in soil gas. However, Szabó et al. (2013) found even lower values of average radon concentrations in soils with similar characteristics to the alluvial soils of Lima City, and measurements were made by an active method. Furthermore, the relative low average radon concentration in soil pores is in agreement with the average radon concentration in dwellings of Lima City (83 ± 11 Bq/ m3), also relatively low (Pereyra et al., 2018). The minimum value, (11 ± 6) Bq/m3, was found in coastal districts away from rivers, while the maximum, (407 ± 55) Bq/m3, was in the Rímac District located to the northeast of Lima province, at the right margin of the Rímac River, in an area formed predominantly by andesitic volcanic rocks interbedded with sandstones and siltstones. The obtained maximum value (64.3 kBq/m3) is much higher than the median of made ground, typical of urban areas, even higher than the median of undisturbed soil according to values reported by Wiegand (2001). Elío et al., (2015) found lower values of radon by passive etched track detectors than those obtained using an active monitor, but, unlike the conditions in our study area, radon measurements were carried out for monitoring geological storage of CO2, i.e., detection of CO2 leakages, where CO2 acts as carrier gas. Other authors have used active and passive systems to measure soil gas radon and radon emanation factor, and results were in general agreement with each other (Giammanco et al., 2009, López-Coto et al., 2009). The values measured by different methods depend, among others, on the physical characteristics of soils. For example, Ruckerbauer & Winkler (2001) found no significant differences for active and passive procedures in a porous soil. Nevertheless, passive procedures yield soil radon concentrations significantly lower than obtained with the active procedure in an impermeable clay soil. It is important to note that soils of the study area in Lima City are mostly porous and permeable. A more detailed discussion on the use of active and passive methods for radon measurements in soil gas can be found in Palacios et al., (2016).
Time series of soil gas radon concentrations
Relationships whit seasons and some meteorological parameters
Time series of the average soil radon concentrations obtained biweekly from the twenty positions are shown in Fig. 3. Medium-term (the measurement periods) and seasonal changes in Rn activity concentration in borehole air were observed. Apparently, seasonal changes in radon activity concentration in borehole air were associated with atmospheric temperature changes. Winter is characterized by approximately twice less average soil gas radon concentration than the average for the other seasons. During the total period of measurements the atmospheric pressure remained almost constant, and rainfall occurred only during the "El Nino Costero" event.
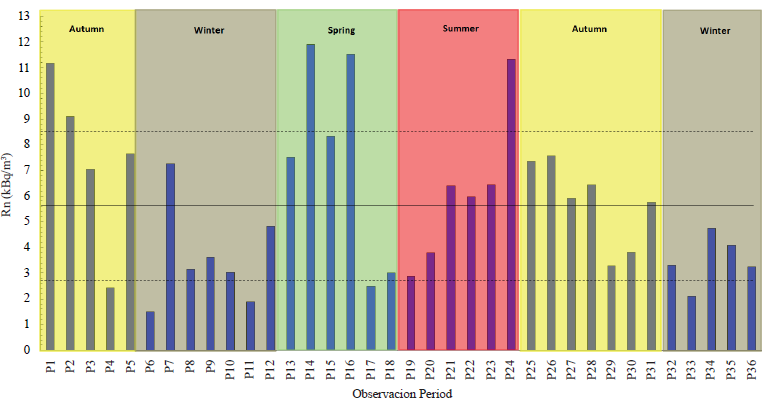
Figure 3 Average Rn concentration per observation period in the 20 wells. The horizontal solid line represents the radon concentration value averaged over the entire measurement period and the dotted lines represent the deviation (o) from the average value.
Descriptive statistics of radon concentration and some meteorological parameters is presented in Table 3. Meteorological parameters represent average values of data reported by nine meteorological stations distributed nearly uniformly in the study area. Radon levels in soil gas and atmospheric pressure were the variables that showed the highest and lowest variability, respectively. Variation of meteorological parameters (normalized to their maximum values) is shown in Fig. 4.
Table 3 Descriptive statistics of radon concentration and meteorological variables.
| Variable | Mean | SD | Min | Max | COV(%) |
| Rn concentration (kBq/m3) | 5.6 | 2.9 | 1.5 | 11.9 | 51.8 |
| Humidity (%) | 76.4 | 5.1 | 66.6 | 83.1 | 6.7 |
| Temperature (°C) | 19.8 | 3.3 | 15.9 | 25.9 | 16.7 |
| Pressure (mb) | 985.4 | 1.3 | 983.1 | 987.0 | 0.1 |
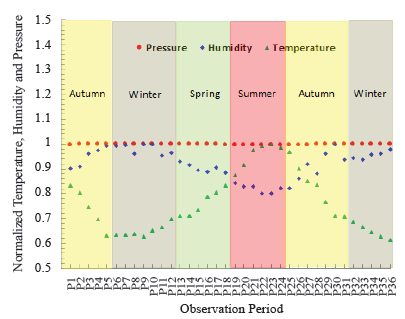
Figure 4 Plot showing the temporal variation of average values of pressure, humidity and temperature.
Dispersion graphs and the moderate correlation coefficients show the low relation between Radon and meteorological variables (Fig. 5). From Fig. 5 it is clear that the measured radon concentration shows low negative, positive, and negative correlations with relative humidity, temperature, and atmospheric pressure, respectively. These results support that the variation of soil gas radon concentration in time is only weakly influenced by the meteorological conditions at the surface. However, the level of significance (p) was less than 0.05 in all cases, indicating statistically significant correlations.
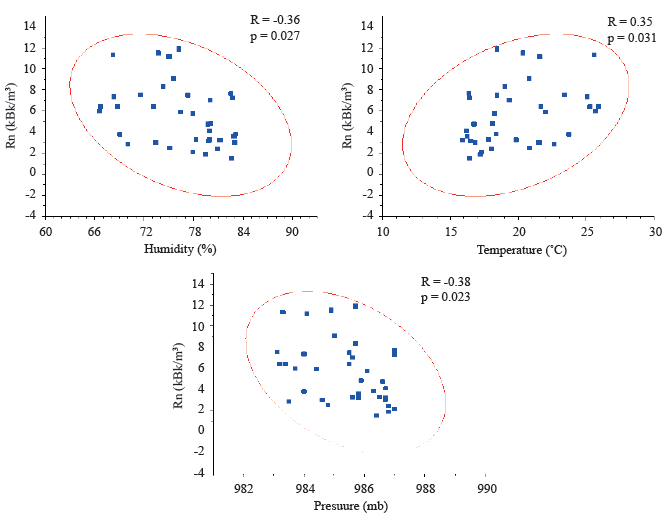
Figure 5 Dispersion graphs, Pearson correlations (R) and p-values (p) for soil gas radon and meteorological variables. Confidence level for ellipses is 95%.
PCA analysis of the data was performed to investigate the variability, both seasonal and throughout the study period, of radon concentration, relative humidity, temperature and barometric pressure. The results are summarized in Table 4. In most cases the variability of the four parameters showed differences between different seasons of the same year and between the same seasons of different years. From the higher variability of radon concentration compared to the variability of humidity, temperature, and barometric pressure it can be concluded that there should be other agents governing the radon concentration variation besides the analyzed meteorological variables.
Table 4 Results of the Principal Component Analysis.
| Time interval | Season | Percentage of Variance (%) | |||
| Radon concentration | Humidity | Temperature | Barometric Pressure | ||
| P1 - P5 | Autumn | 87.3 | 11.3 | 1.4 | 0.1 |
| P6 - P12 | Winter | 42.6 | 28.1 | 20.6 | 8.7 |
| P13 - P18 | Spring | 73.9 | 20.1 | 5.9 | 0.1 |
| P19 - P24 | Summer | 66.2 | 21.9 | 10.6 | 1.4 |
| P25 - P31 | Autumn | 87.5 | 7.9 | 4.1 | 0.5 |
| P32 - P36 | Winter | 58.7 | 33.8 | 7.2 | 0.3 |
| P1 - P36 | All periods | 76.0 | 20.0 | 2.8 | 1.2 |
Other factors having influenced the temporal variation of radon concentration in soil pores
Closeness to volcanic formations
As can be seen in Fig. 3, the average radon concentration in the 20 holes has high values in the first two measurement periods. The greatest contribution to these high values came from the hole located in Carabayllo district (S15). In those two periods, two of the highest concentrations measured throughout the study (53.1 kBq/m3 and 21.1 kBq/m3) were found in that hole. The S15 hole is near the Chillón River and is also the closest measurement site to the uranium-rich volcanic rocks of Quilmaná and Huarangal formations. No seismic activity or particular meteorological conditions were observed that could explain the high average values found during those periods.
Occurrence of earthquakes
The high values observed in October and November 2016 (P13 - P16 in Fig. 3) could be associated with the earthquakes occurred in Lima during those months. In addition to the large number of reports on radon anomalies prior to earthquakes, anomalies have also been registered during their occurrence (Petraki et al., 2015). A possible cause of the apparent simultaneity could be related to the time resolution of the radon measurement system. The time resolution of active systems, such as continuous radon monitors, can be as small as 10 minutes. However, passive systems, such as nuclear track detectors, integrate radon concentrations over long time intervals (at least > 1 - 4 weeks), i.e., they provide coarse time-series estimations. For example, as an illustration, suppose that the empirical equation of Sultankhodzhayev et al. (1980), which relates precursor time with earthquake magnitude and epicentral distance, is fulfilled as a first approximation. Thereby, for earthquakes of magnitudes 4 and 5, occurring at epicentral distances between 50 and 300 km, the maximum precursor times would be approximately between 1 and 28 days. Most of the seismic events perceived in Lima City during the study had magnitudes between four and five, and their epicenters were at distances from approximately 50 to 300 km from Lima City. Since soil gas radon concentrations are integrated in periods of about two weeks, anomalies could be recorded in periods prior to the earthquake or in the period in which the event occurred.
As can be seen in Fig. 6a, the number of earthquakes perceived in Lima City is greater during two consecutive periods in October-November 2016 (Seismic Bulletins, 2017), and in the period from the end of June to the beginning of July 2017. However, the magnitudes of the earthquakes of the last period were smaller, being much greater the energy released during the October earthquakes (Fig. 6b). The two earthquakes perceived most intensely in Lima City during the period of measurements (according to the Modified Mercalli Scale) occurred precisely in 2016, on October 19 and 28 (Fig. 7). A more detailed study on the association of seismic events with radon in soil gases is planned to be carried out in the near future.

Figure 6 Number of earthquakes felt in the Lima City (left) and energy released by earthquakes (right) during the period of measurements.

Rock and debris avalanches due to flooding of rivers during the "El Nino Costero" phenomenon
A significant peak in radon concentration was also observed during the exposure period of detectors from March 5 to 19, 2017 (P24 in Fig. 3). This could be associated with the natural phenomenon "El Nino Costero" which greatly affected several areas in Lima City. Heavy rains during this period triggered flows of detritus, rock falls and landslides. They also caused overflows and floods of the Chillón, Rímac and Lurín rivers, where large avalanches of rocks, debris and mud were generated. The increased flow in these rivers caused the dragging of rocks and debris. Rock motions, debris flows, rock and debris avalanches, rocks impacting on the ground, and rocks impacting or rolling on the channel bed generate ground vibrations, which could cause the increase of radon emanation in holes located near rivers and creeks.
Our assumption is supported by studies on the influence of vibrations on emanation and exhalation of soil gas radon, and on ground vibrations produced by rock motions and debris flows. Moharram (2000) found increased radon concentration in soil pores and enhanced radon exhalation in areas nearby railway and motor vehicle traffic tracks. The author considers the increased delivery of radon from the subsoil due to the enhanced upward diffusion. Cai et al. (2018) and Cai et al. (2019) studied the influence of low-frequency vibrations on the radon exhalation from uranium samples. The results showed that the radon exhalation increased with the rising vibration frequency until frequencies of about 50 to 70 Hz, but fell slowly after reaching the peak. Studying ground vibrations produced by rock motions and debris flows, Huang et al. (2007) found that ground vibrations caused by individual rocks were 10-150 Hz and that larger stones generate ground vibrations with lower peak frequencies. The frequency of the debris flows is lower than 50 Hz, but after the front passed, the frequency is between 50 and 100 Hz. In these frequency ranges there is an increase in radon emanation and exhalation according to Cai et al. (2018) and Cai et al. (2019). These authors confirmed that one of the main sources of ground vibration caused by debris flows is the interaction of rocks or boulders with the channel bed.
The following facts also support our assumption about the cause of the increased radon concentration in soil gas during the "El Nino Costero" event: 1- all the holes had the same depth; 2- detectors were placed at the same distance from the bottom of the hole; 3- in no hole there was water infiltration or water vapor condensation on detector surface that could affect the measurements; 4- in each measurement period all stations experienced approximately the same meteorological conditions since the measurements were carried out simultaneously; 5- overflowing of natural channels of rivers during floods did not affect any measurement site; 6- the lowermost PVC tube was never submerged because of rising groundwater levels; the groundwater level in the measurement sites is very deep (INRENA, 2004) and its possible fluctuations should have affected little the soil radon emanation; 7- if below the bottom of the hole the soil water content would have been very high, contrary to what happened, the radon concentration should have decreased considerably; 8- during the period P24 there was only one earthquake on 03/13/2017 at local time 10:46:00, latitude -12.63 and longitude -76.97, and 53 km depth (Seismic Bulletins, 2017). Although its magnitude was 4.5, it was perceived in Lima City with the lowest intensity an earthquake could be reported (II level) according to the Modified Mercalli Scale.
Combined spatial and temporal behavior of soil gas radon concentrations Radon concentration in different holes during the period of maximum flow of rives due to phenomenon "El Nino Costero"
To help interpret the results, in particular regarding the effect of floods on the increase of radon emanation from the base of the tube holes, the average radon concentration in each of the 20 holes is shown in Fig. 7 for three cases: 1. during the entire period of measurements (EPM), 2. during the entire period of measurements except periods of the "El Nino Costero" event (EPM-PEC), and 3. during the period of maximum flood of Chillón, Rímac and Surco rivers (MFR).
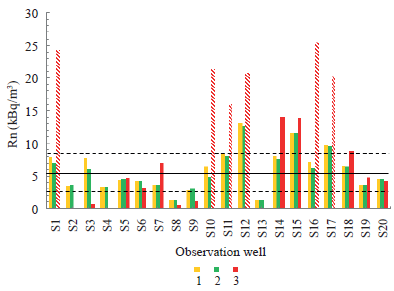
Figure 8 Average radon concentration in each hole during the entire period of measurements. (1). During the entire period of measurements except periods of "El Nino Costero" event. (2). And during the period of maximum flow of Chillón and Rímac Rivers (3) (bars with red inclined lines correspond to holes where very large increases in radon concentration occurred). Horizontal and dotted lines represent the same as in Figure 3.
As described, Lima City is situated on alluvial fan deposits of the Chillón and Rímac Rivers. Alluvial soils of the study area are mainly differentiated by deposited parent material, which is associated with the fluvial erosion of geological formations that contain different uranium content. Consequently, Figure 7 should provide information on the spatial distribution of deposited parent material, given by the spatial radon distribution, and on the temporal variation of radon in the most important considered periods.
Radon concentrations were generally higher than the total average concentration in most holes near rivers (S1, S10, S11, S12, S15, S16) regardless of the period of time in which they were averaged. In contrast, radon concentrations were below the total average concentration in most holes located far from rivers and they were approximately the same for the different averaging periods. Table 5 and the scatter plot in Fig. 8 show a significant negative correlation between soil radon concentration and distance from the hole to the nearest river bank for the different averaging periods, however, the correlation and gradient were higher for the period of maximum flow of rivers. For analysis, the 2-tailed test of significance was used.
Table 5 Pearson and Spearman correlation coefficients between soil gas radon concentration and distance from the measurement site (hole) to the nearest river bank for the different averaging periods.
| Pearson Corr. | p-value | Spearman Corr. | p-value | |
| MFR | -0,67* | 0,0049 | -0,76* | 0.0007 |
| EPM | -0.60* | 0.010 | -0.61 | 0.0089 |
| EPM-PEC | -0.55* | 0.0213 | -0.61 | 0.0089 |
*Correlation is significant at the 0.05 level
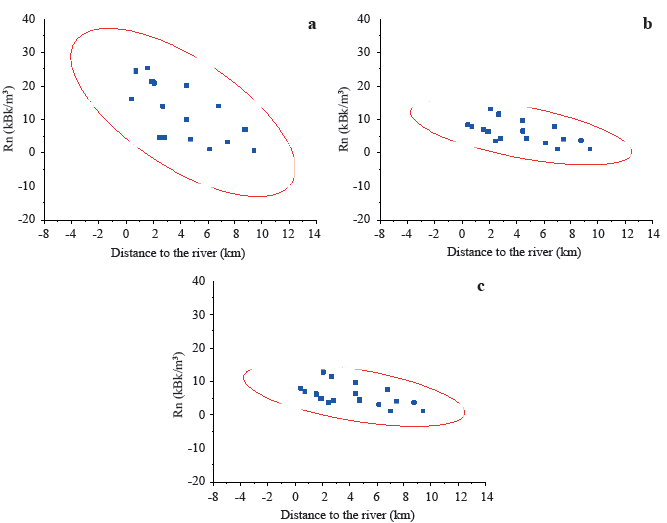
Figure 8 Scatter plot of soil gas radon concentration averaged during the EPM (a), EPM-PEC (b), and MFR (c) periods vs. distance from the hole to the nearest riverbank. The confidence level for ellipse was 95%.
As can be seen in Figure 7, radon concentrations averaged during EPM and during EPM-PEC were very similar in most of the holes. There was a large increase in radon concentration in the MFR period in most holes where radon concentrations averaged during the EPM were similar or greater than the total average concentration; those holes were located relatively close to rivers. Hence, the largest source of temporal variation of radon in holes located relatively close to Chillón and Rímac rivers was associated with the MFR period, where large floods occurred with avalanches of rocks, debris and mud.
The hole located near the Surco river in Chorrillos district (S1), the holes located along the channel of the Rímac River in San Juan de Lurigancho (S10), Chaclacayo (S11) and Ate (S12) districts, and the holes situated near the Chillón River in Puente Piedra (S16) and San Martin de Porres (S17) districts, showed large increase in radon concentration during the period of maximum flow (higher flood) of these rivers. Although the S17 hole was relatively far from rivers, it is located in an area historically affected by the overflow and flooding of the Chillón River. Rocks and debris transported during the period of maximum flow of the Chillón River reached an area close to this measurement site. The hole located in Independencia district (S14) showed relatively high radon concentration during the EPM, but the increase in radon concentration was not as great as in other holes during the MFR period. This hole was located far from rivers, however, the nearby steep and short distance creeks were activated during the period of higher intensity of rainfall, producing debris flows accumulated on their slopes and beds. Possibly, the intensity and frequency of resulting vibrations were different from those produced by the large avalanches of rocks and debris occurred during the floods of Chillón and Rímac rivers; this could be the cause of the lower increase in radon concentration in the hole.
Radon concentration in each hole averaged over all measurement periods
Results of radon concentration averaged over the entire study period could be related to the parent material of alluvial soils in the monitoring sites. Fig. 7 shows that the highest average radon concentration was registered in Ate hole. This may be related to the origin of alluvial deposits in the area around the hole, which are most likely associated with the material transported during the floods of the Huaycoloro River in the Pleistocene era (about 2.5 million years ago). This river has eroded in its course volcanic rocks rich in 238U (INGEMMET, 1999; Sebrier & Macharé, 1980). The high average values of radon emanation found in Carabayllo (S15) and San Martín de Porres (S17) holes, are due to the presence of alluvial deposits of Pleistocene and recent (less than 0.13 million years ago), corresponding to the floods of Chillón River that eroded the chain of volcanic hills located on its slopes. Soils around these holes are shallow and they have developed from hard, coherent and consolidated rock. The lithological composition of these soils is variable such as quartzites, sandstones, limestones, shales and volcanic rock; some of them commonly present high 226Ra content. Differently, the floods of Rímac River have contributed less in the deposition of materials with relatively high content of radon parents, since the predominant geological formation along its channel and slopes has lower uranium content compared to the Casma Group (where the Chillón and Huaycoloro rivers flow).
The inferred permeability of the medium confirms the direct association between the measured radon levels and the origin of the alluvial deposits. Most of the area of Lima City is covered by an alluvial gravel deposit which is composed of a medium to dense coarse gravel with a sandy matrix. These materials are mostly from the alluvial fan of the Rímac River. In such permeable deposits radon moves readily and could reach the measurement site from relatively large distances. In these circumstances, high radon levels would be generated at the measurement site if the emanation power of the medium is high. Since the measured radon concentrations were relatively low, the low emanation power of materials deposited in the alluvial fan of the Rímac River is confirmed. However, in the northern districts of Puente Piedra, Comas and Carabayllo, and in the eastern districts of La Molina and Ate Vitarte, there are silty sand deposits. In these less permeable deposits, the measured radon comes from shorter distances, thus providing more local information about the emanation power of the medium. Since the highest levels of radon were found in these sites, the high emanation power of materials deposited by the Chillón and Huaycoloro rivers is confirmed. Semkov (1990) and Sutherland (1994) have also suggested correlation between specific surface area and emanating powers of radon. Thus, particle-size fractions due to fracturing and crushing have possibly played a major role in increasing the radon emanation at the measurement sites of districts indicated above.
A significant contribution to the radon concentration was found when volcanic materials were present at the measurement sites. These materials have been transported and deposited by the Chillón and Rímac rivers and come from the disaggregation by meteorization and erosion of the Casma Group's volcanic rocks. However, measurements made directly on slope of hills of volcanic (S2) or plutonic origin (S8, S9, S13), yielded the lowest values of radon concentration. In these places there is no means of transport and thus erosion is slower compared to sites located in the riverbeds. According to Ennemoser et al. (1993), the emanation rate of radon from soil depends not only on the concentration of uranium and radium content but to some extent on emanating power and the diffusion coefficient of radon in soil. The alluvial deposits, compared to the rocky areas on the hill slopes, has an increased emanating power and diffusion coefficient due to intense fracturing, and crushing down to the grain and sub-grain size, resulting in an increased surface area and porosity (Purtschller et al., 1995).
Radon measurements in the studied area have shown that the highest levels of radon are in accordance with the type of lithological material present in riverbeds and with its disintegration, erosion, transport and distribution by the action and flooding of rivers. The grain-size reduction due to fracturing and further weathering of transported parent materials expose the uranium-rich mineral thus giving rise to high values of radon concentration in the zones of higher accumulation.
Floods of rivers associated with "El Nino Costero" have been repeated over thousands of years and have great responsibility in the geomorphology of the current Lima. Thus, the results of this study provide information not only on the effects of the event on soil gas radon during the period of measurements, but also help in understanding the causes of differentiated Geogenic Radon Potential in the study area.
Conclusions
Total average soil gas radon concentration (spatial and temporal) was 5.6 kBq/m3, while the minimum and maximum values for the whole set of measurements were 0.1 kBq/m3 and 64.3 kBq/m3, respectively. These results are included within values reported in similar studies.
Total average value of radon concentration in alluvial soil of Lima City is in correspondence with the relatively low radon values reported in dwellings. However, more studies are required to obtain statistical evaluation of spatially Geogenic Radon Potential with indoor radon.
The average radon concentration in soil gas is about two times lower in winter than in the other seasons. Although there is a moderate relation between soil radon concentration and meteorological variables, it was shown that other agents controlled the radon concentration variation.
High values of soil gas radon concentration during October/November 2017 apparently were related to the earthquakes perceived in Lima City in that period.
The highest radon concentrations were found in areas of alluvial deposits whose parental material has been removed from the volcanic Quilmaná and Huarangal by the Chillón and Huaycoloro rivers flowing through them. Soil gas radon concentrations were even higher in areas closer to volcanic and less distant from rivers.
In general, the lowest average concentrations of radon in soil gas were found in areas far from rivers, on hills of volcanic origin, and in geological formations where intrusive rocks predominate or in alluvial fans of rivers flowing through them (Rímac and Lurín rivers).
Anomalous high soil gas radon concentrations were found during the period of maximum flooding of rivers due to "El Nino Costero" phenomenon. They were associated with ground vibrations caused by rock and debris avalanches in rivers and creeks.
The study of radon emanation in pores of alluvial soils allowed to identify the sources of deposited materials. Thus, the application of this methodology could in principle help in the characterization of geodynamic events in geological and geomorphological contexts similar to that of our study area.
The identification and distribution of the parent material in alluvial deposits of Lima City, and the influence on them of the historical occurrence of "El Nino Costero", help to interpret the geogenic radon hazard variation defined by radon indoors studies.

