


 Inglês (pdf)
 Artigo em XML
 Referências do artigo
 Enviar este artigo por email
 Citado por SciELO
  Citado por Google
  Similares em
SciELO
Similares em
SciELO  Similares em Google
 Permalink
Introduction
The destructive earthquakes which have occurred in the world and in Turkey especially in recent years and large-scale losses of life and property as a result these earthquakes have necessitated studies to be carried out and precautions to be taken in relevance to earthquakes as an agenda. Despite the catastrophic seismic events of the past, the loss estimation and seismic risk assessment studies regarding Turkey generally focused on the north-western part of the country because of the higher concentration of population (Bommer et al., 2002; Strasser et al., 2008; Bal et al., 2008; Erdik et al., 2003; Erdik and Durukal, 2008; Ansal et al., 2009). This is rather understandable due to the high population density and economical activities; however, findings from the earthquakes that occur in other parts of the country with relatively less impact are still significant in terms of both the hazard and vulnerability points of view. The fairly frequent mid- to large-magnitude tremors that strike the region provide useful insights for i) the characteristics of the earthquakes and ii) the taxonomy and seismic response of the buildings in the region.
The potential damage of an earthquake will be directly influenced by the magnitude of it, buildings where proper safety measures are not taken and structures that were not built in compliance with the requirements stated in the regulations. It is not possible to prevent earthquakes or forewarn with the present technology. However, it is possible to take precautions reduce losses in the case of an earthquake. In determination of these precautions to be taken, earthquake scenarios have a significant place. The objective in earthquake scenarios is to numerically estimate the damage which will be created by an earthquake estimated for any region. Minimisation of losses may be achieved by estimating losses of life and property and taking necessary precautions. This is one of the basic elements of modern disaster management approaches (Işık 2010; Içik et al., 2017; Lednická et al., 2006).
When an earthquake scenario is created to make these calculations for a region; it is aimed to determine the damage which may occur in the buildings in the relevant region. Based on this, social and economic losses may also be calculated.
It is required to get ready for earthquakes which are expected to occur and calculate the areas and buildings which are foreseen to be affected by potential disasters, as well as economic losses. The most significant factor required for earthquake damage estimation is software which may apply the scenarios covering the whole region and conduct risk analyses based on these scenarios. There are various types of software developed for such analyses. In this paper, the Earthquake Loss Estimation Routine (ELER) software was used, and damage determination analyses were carried out for the province of Kırşehir in Turkey. Kırşehir was selected as a pilot province so that it could pose as an example for other provinces within the scope of the "Research and Development project of Automation System Based Geography Information System at which Data of Local Authorities for Determination of Urban Transformation Areas and Creation of Scenario Disasters." Only the province of Kırşehir was considered within the scope of this project. This research that was conducted for Kırşehir may be applicable for other residential areas. Kırşehir was selected not only because of its geometric location but also due to its seismic characteristics.
The study firstly provides information about loss estimation analyses. Information about the earthquakes and elements of earthquakes that have been experienced in an around the province of Kırşehir is provided. The characteristics of the Akpinar fault line and the Akpinar earthquake, which constitute the subject matter of the study, are explained. Considering the possibility of the Akpinar earthquake to occur today, structural and economic losses were estimated. While this process was being carried out, calculations were made based on two different methods that are found in the software that was used in the study.
Material and Method
Earthquake loss estimations may differ depending on the types of losses considered, the extent of the geographical area involved and the types of buildings and other structures including bridges, utility stations and water distribution networks. Loss estimation analysis has two main components as seismic hazard analysis and vulnerability analysis. A seismic hazard analysis involves the identification and quantitative description of the earthquake to be used as a basis for evaluating losses, namely the earthquake scenario. The second component entails the analysis of the vulnerability of buildings and other facilities to earthquake damage and the losses that may result out of this damage (FEMA-177, 1989).
In order to prepare for a possible earthquake in the best way, it is required to estimate which regions the earthquake will affect, which type of buildings it will affect at the utmost extent and what the earthquake will result in beforehand. Loss estimation analyses have a significant place at the assessment stage of earthquakes and estimation of losses that earthquakes may lead to. Studies on various scientific models have had the aim of determining the performance that a dwelling unit will show in the case of a possible earthquake, structural damage status and losses of life, injuries and losses of property depending on these (Crowley and Bommer, 2006; Bal et al., 2007; Bal et al., 2008a; Center M.A.E, 2006; Zülfikar et al., 2017; Bommer et al., 2002; Molina et al., 2010; Erdik et al., 2010; Hancilar et al., 2010; ELER, 2010; Zamora-Hernández et al., 2013). One of these studies was on the software named ELER, which is a research project covering the physical, social and economic outcomes of earthquakes on the community within the scope of the European Union's the Network of Research Infrastructures for European Seismology (NERIES) Project, and it was developed by Bogaziçi University Department of Earthquake Engineering (Demircioglu et al., 2009).
It is not possible to prevent earthquakes or forewarn with the existing technology. However, it is possible to take precautions to decrease losses created by earthquakes. In determination of these precautions to be taken, earthquake scenarios havea significant place (Içik, 2016). The magnitude of an earthquake that may occur in the future is aimed to be determined by seismic hazard studies, and the extent to which settlement areas will be affected from a possible earthquake is attempted to be determined with earthquake scenarios (Õzmen and Can, 2016). The possibility of occurrence of a ground motion caused by an earthquake which may lead to damage and loss of life in a specific area and specific time period is defined as earthquake hazard. Earthquake risk may be defined as the possibility of damage and loss of property and life due to an earthquake (Eyidogan, 2003; Özmen and Can, 2016; Içik and Kutanis, 2015).
Earthquakes may lead to very significant destructionin all types of social settlements and economic structures, particularly human life. The damage levels which occur immediately after anearthquake are expressed with the loss of life and injuries. The most noticeable effect of an earthquake is the destruction of the environment which has completed its formation process. An earthquake may lead to damages in all structures. From time to time, it may lead such structures to lose all their functions. These damages will ruin the economic structures of a region. Calculation of losses that occur depending on earthquakes in settlement areas that are under the danger of an earthquake is named as the "loss estimation models". In loss estimation models, the objective is to calculate the losses which may occur in any region depending on the damage an earthquake will create. Loss estimation models are defined as the most significant tool that is required for risk mitigation. Loss estimation models may access key information concerning potential damages and losses (Içrk, 2010).
Studies on various scientific models have had the aim of determining the performance that a dwelling unit will show in case of a possible earthquake, structural damage status and the losses of life, injuries and losses of property depending on these. In general terms, such a study should cover the studies mentioned below (Figure 1).
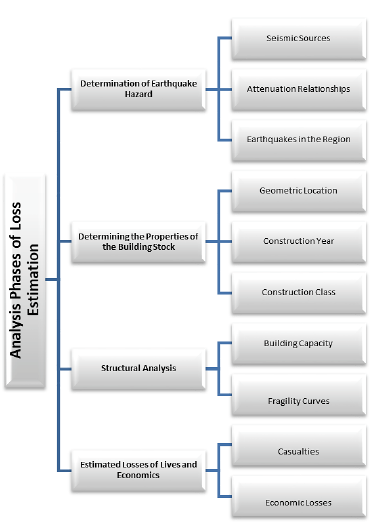
Seismic hazard analysis of settlement area based on probabilities (probabilistic analysis); the location, time of occurrence, magnitude and other characteristics of future earthquakes are estimated based on probability calculations.
Obtaining design spectrums or stimulated strong ground motions
Structural analyses with calculation methods based on displacement (deformation)
Loss estimation depending on the performance levels of structures
The province of Kırşehir is located in the middle of the Central Anatolia Region in Turkey. The province of Kırşehir is located in Middle Kizilirmak Basin at 39°41'- 39°48' northern latitudes and 33°25'-34°43' eastern longitudes. Kırşehir is surrounded with Nevşehir in the east and south-east, Aksaray in the south, Kirikkale in the north-west, Yozgat in the north-east and east and Ankara in the west (Figure 2a).
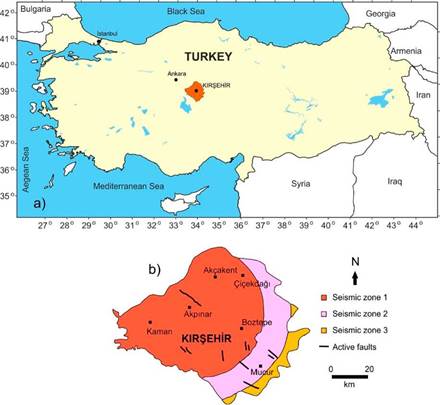
Kırşehir, which is located in the Central Anatolia Region, has an interesting location in its immediate vicinity in terms of earthquake potential. In this region, earthquakes occur depending on strike slip faults. The city centre of Kırşehir is located within the 1st degree seismic hazard belt in Turkey's earthquake regions map (Figure 2b).
Historical and some of earthquakes with an epicentre about 100km of Kırşehir that are recorded in an instrumental catalogue which have caused destructive and significant damages that occurred in and surrounding Kırşehir are given in Table 1.
Table 1 Major earthquakes which occurred in and around Kırşehir before and after the 20th century (Koeri, 2016; Temiz, 2004; Yildiz, 2008)
| No | Date | Region | Intensity | Magnitude |
|---|---|---|---|---|
| 1 | 240 | Kayseri- Sivas | IX | |
| 2 | 1104 | Niğde | IX | |
| 3 | 1190 | Karaman-Konya | VIII | |
| 4 | 1205 | Kayseri | VIII | |
| 5 | 12.08.1168 | Beypazari | ||
| 6 | 15.08.1168 | Ankara | ||
| 7 | 01.01.1695 | Sivas | ||
| 8 | 09.06.1704 | Kayseri | ||
| 9 | 26.12.1706 | Konya | ||
| 10 | 1714 | Kayseri | VII | |
| 11 | 09.05.1717 | Kayseri | VIII | |
| 12 | 16.09.1754 | Kangal - Sivas | VII | |
| 13 | 23.08.1835 | Develi-Kayseri | VIII | |
| 14 | 1845 | Çankiri | V | |
| 15 | 1866 | Ilgin - Konya | VI | |
| 16 | 1871 | Konya | VI | |
| 17 | 1888 | Çankiri | V | |
| 18 | 02.07.1897 | Beylikahir - Eskisehir | V | |
| 19 | 05.07.1928 | Kozakli (Nevsehir) | 4.7 | |
| 20 | 09.04.1930 | Akcakent (Kırşehir) | 5.3 | |
| 21 | 19.04.1938 | Kaman (Kırşehir) | 6.6 | |
| 22 | 27.04.1938 | Yerkoy (Yozgat) | 4.8 | |
| 23 | 14.05.1938 | Kaman (Kırşehir) | 4.9 | |
| 24 | 14.05.1938 | Keskin(Kinkkale) | 4.9 | |
| 25 | 28.05.1938 | Kaman (Kırşehir) | 5.2 | |
| 26 | 21.07.1938 | Keskin (Kirikkale) | 5.3 | |
| 27 | 16.12.1938 | Akpinar (Kırşehir) | 4.9 | |
| 28 | 13.04.1940 | Sorgun (Yozgat) | 5.7 | |
| 29 | 30.07.1940 | Sorgun (Yozgat) | 6.2 | |
| 30 | 27.04.1941 | Sorgun (Yozgat) | 5.8 | |
| 31 | 26.10.1975 | Alaca (Çorum) | 5.0 | |
| 32 | 22.05.1985 | Keskin (Kirikkale) | 4.0 | |
| 33 | 30.01.1991 | Delice (Kirikkale) | 4.0 | |
| 34 | 14.02.1992 | Delice (Kirikkale) | 4.2 | |
| 35 | 29.02.2000 | Delice (Kirikkale) | 4.1 | |
| 36 | 21.07.2004 | Akpinar (Kırşehir) | 4.4 | |
| 37 | 05.10.2012 | Kaman (Kırşehir) | 4.5 | |
| 38 | 10.01.2016 | Çicekdağı (Kırşehir) | 5.2 |
The neo-tectonic map of Central Anatolia where the province of Kırşehir is located and its immediate vicinity isgiven in Figure 3. In general, the fault lineswhich may be effective in the province of Kırşehir are the North Anatolian Fault, Tuz Gölü Fault Zone, Akpınar Fault, Salanda Fault, Manahözü Fault, Tosunburnu and Çoğun Fault, Boztepe Fault, Gümüşkümbet, Kırşehir, Karıncalı and Gülütarla Fault Lines, Seyfe Çek - Ayır Basin (Ataman et al., 1975; Bozkurt, 2001; Yıldırım, 2014; Aydemir, 2009; Ketin, 1976; Köksal and Göncüoğlu, 1996; Kürçer and Gökten, 2014; Maden et al., 2014; Şengör et al., 2005; Temiz, 2004; Yıldız, 2008; Koçyiğit and Doğan, 2016).
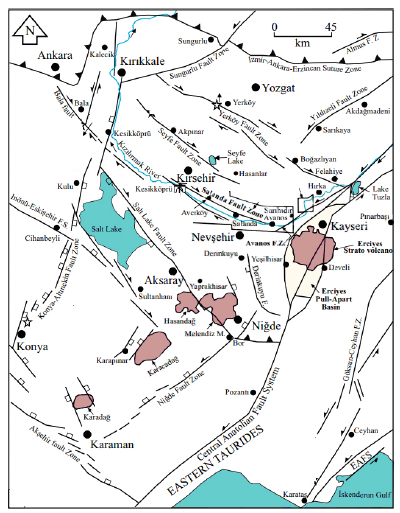
Figure 3 Tectonic map of the Central Anatolia Region and its surroundings (Koçyigit and Dogan, 2016).
In particular, the Northern Anatolia Fault Zone (NAFZ) is one of the most significant fault zones in Turkey. It has led to several earthquakes with high magnitudes that have caused large losses of life and resources (Yavaşoğlu, 2015). Some fault lines and fault groups that areconsidered while working for earthquake risk of Kırşehir is shown in Figure 3. This study focused on the Akpınar earthquake in 1938 which caused significant loses for the province of Kırşehir. It is known that the Akpınar fault line caused this earthquake. Seismic sources play an important role in loss estimation analyses.The fault line which leads to the earthquake scenario that is used in this study was the Akpınar fault line located within the provincial borders of Kırşehir. This fault line is approximately NW-SE extensionally and it is located between Keskin in the northern and southern parts of the Lake Seyfe in the south. The fault line between the villages of Akpınar and Taşkovan is 14km-long, the value of its horizontal slide is 30-100 cm, and it cuts rocks such as marble and granite (Ketin, 1969). The fault line which created an earthquake at the magnitude of 6.8 on 19.04.1938 and started from approximately from 2km northwest of the Akpınar district was a right lateral strike slip fault within the Akpınar Fault Line which extends up to the village of Sofrazlı and then continues along the village of Taşkovan (Yıldız, 2008; Temiz, 2004; Temiz and Gökten, 2011). The earthquake was effective in an area of 226 km2 which covers the provinces of Kırşehir, Yozgat and Ankara. The area of the region constituting its second degree of effect was 1550 km2 (Özer, 2016).The aftershocks of this earthquake are given in Table 2.
Table 2 The aftershocks that occurred after the 19.04.1938 Akpinar earthquake (Yildiz, 2008).
| No | Date | Time | Latitude | Longitude | Depth (km) | Magnitude |
|---|---|---|---|---|---|---|
| 1 | 19.04.1938 | 23:11 | 39.65 | 33.87 | 30 | 5 |
| 2 | 27.04.1938 | 10:40 | 39.89 | 34.10 | 10 | 4.6 |
| 3 | 14.05.1938 | 04:45 | 39.74 | 33.55 | 10 | 4.8 |
| 4 | 14.05.1938 | 06:55 | 39.50 | 33.70 | 0 | 4.7 |
| 5 | 28.05.1938 | 00:05 | 39.40 | 33.81 | 30 | 4.9 |
| 6 | 21.07.1938 | 21:56 | 39.56 | 33.68 | 10 | 5.0 |
| 7 | 16.12.1938 | 11:03 | 39.52 | 33.91 | 10 | 4.8 |
| 8 | 23.12.1938 | 01:32 | 39.50 | 33.50 | 0 | 4.2 |
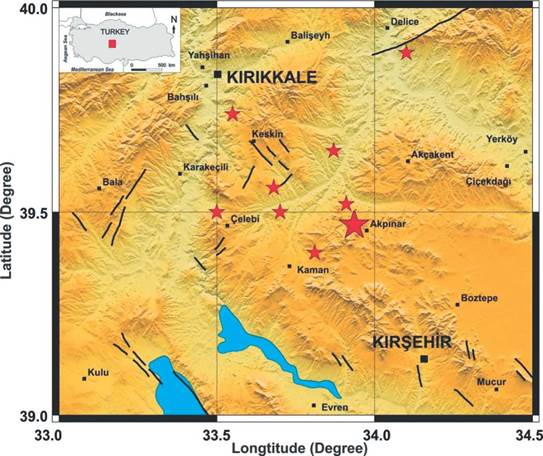
The map of the aftershocks of the 1938 Akpinar earthquake is shown in Figure 4.
Analysis Results
The data required for this study were primarily supplied from the relevant public enterprises and institutions. The data supply and collection were achieved within the provincial borders of Kırşehir.
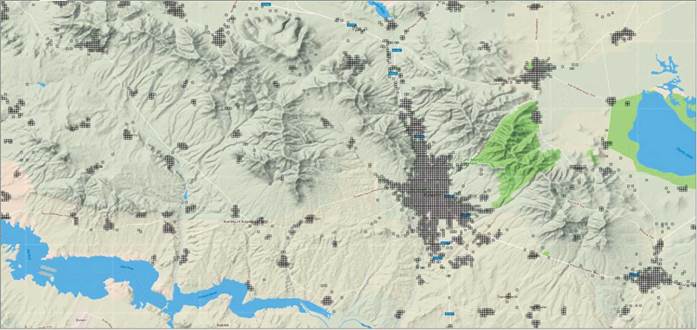
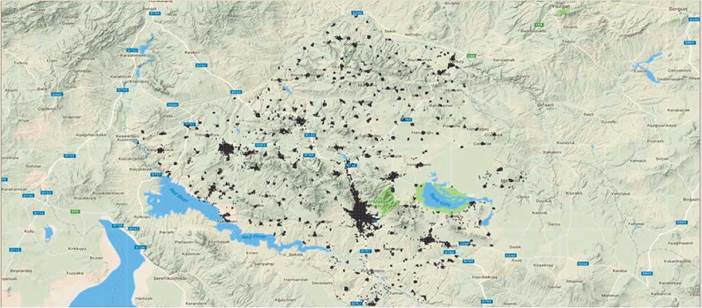
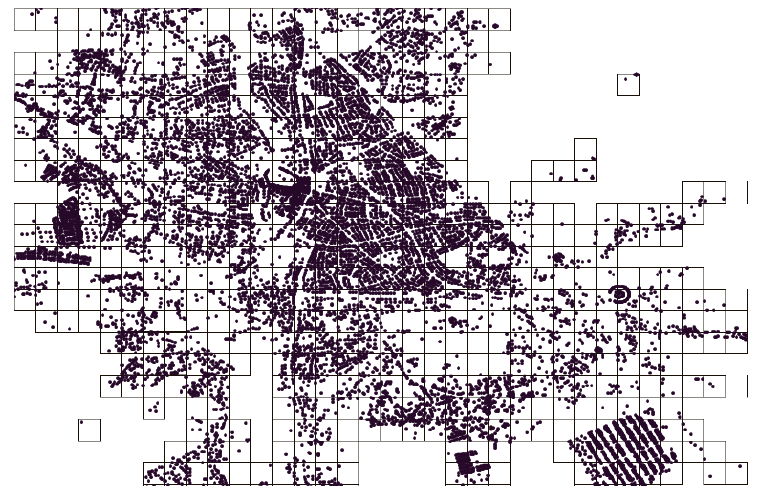
After determining the study area, the area was divided into 0.002° grid data in order to describe the buildings'locations. The 0.002° grid data that were produced for the province of Kırşehir are shown in Figure 5. The locations of the buildings in the province of Kırşehir based on their geometric locations are given in Figure 6. Additionally, for each grid that was produced, the buildings in the grid area were entered into the system. The building location distribution map of the province of Kırşehir based on the grid in the system is presented in Figure 7.
Vulnerability may simply be defined as the sensitivity of exposure to seismic hazard(s). The vulnerability of an element is usually expressed as a percentage loss (or as a value between zero and one) for a given hazard's level of severity (Coburn and Spence, 2002). Vulnerability is also defined as "a state combining the physical, economic and environmental factors which increase a system's sensibility to danger. Earthquake vulnerability is defined as a risk factor that may occur as a risk element or risk group if a predicted earthquake hazard occurs. The evaluation of regional earthquake vulnerability is a basic concept in hazards research and a critical step in earthquake planning, prevention and mitigation. Assessing regional vulnerability to earthquakes is a complex problem and involves many factors such as population density, economic development, the average age of buildings, the average height of buildings, the intensity of the earthquake, the quality of the building materials and lifeline systems (Peng, 2015; Hancilar et al., 2014; Moradi et al., 2017; Hadzima-Nyarko et al., 2015; Calvi et al., 2006; Düzgün et al., 2011; Hadzima-Nyarko et al., 2016; Ademovic et al., 2013).
Within the confines of the project, the characteristics of the buildings to be recorded from the field were determined based on the parameters that would be needed in the loss estimation analyses. A database was established for these parameters that were developed in the office environment. Firstly, training was provided to the personnel that were employed in the field regarding the building parameters that are needed for the software that was used in the study. The parameters that were used as inputs were separately introduced to the system. As a result of the field studies, these data that were related to buildings were transferred to the database via tablets. In the study, the results of the field work were recorded in the database by using the forms that were suitably created for the software that was used in the province of Kırşehir. The building data that were recorded into the database were checked in the office environment by using building visuals and statistics. Repeated examinations were made in the field for buildings with records of missing or inaccurate data. Type of the structural system, number of stories, seismicity of the region and local soil conditions, current situation and visual quality, year of building, night/daytime population, usage of building, building type and number of independent sections are the parameters that are used for loss estimation analysis.The grid-based building inventory in the light of the data that were added to the database included a total of 90337 building entries. The building inventory for the province of Kırşehir was classified in a way that was suitable for the earthquake damage estimation software. The total numbers of the buildings in each class are given in Table 3.
Table 3 Building inventory classification for the province of Kırşehir
| Type of Load-Bearing System | Number of Storeys | Date of Construction | Number of Buildings |
|---|---|---|---|
| Masonry | 1-4 | 1979 and before | 17676 |
| Masonry | 1-4 | 1980-2000 | 24548 |
| Masonry | 1-4 | 2001 and later | 4 |
| Precast | 1-4 | 1979 and before | 27 |
| Precast | 1-4 | 1980-2000 | 59 |
| Reinforced frame | 1-4 | 1979 and before | 2487 |
| Reinforced frame | 1-4 | 1980-2000 | 9540 |
| Reinforced frame | 1-4 | 2001 and after | 32843 |
| Reinforced frame | 5-8 | 1979 and before | 205 |
| Reinforced frame | 5-8 | 1980-2000 | 1354 |
| Reinforced frame | 5-8 | 2001 and after | 1471 |
| Reinforced frame | 9-19 | 1980-2000 | 11 |
| Reinforced frame | 9-19 | 2001 and after | 29 |
| Reinforced shear wall | 1-4 | 1979 and before | 8 |
| Reinforced shear wall | 1-4 | 1980-2000 | 25 |
| Reinforced shear wall | 1-4 | 2001 and after | 50 |
| Total Number of Buildings | 90337 | ||
The population data were calculated based on the data of the Turkish Statistical Institute (TÜIK) and the building data that were collected from the field. According to the TÜÍK data that was published by the governorate of Kırşehir (www.Kırşehir.gov.tr/nufus), the population of Kırşehir is 225197, and the average household size is 3.2 persons. These values were applied to the buildings that were seen as residential or workplace areas by considering the population distributions in the neighbourhoods and villages for the province of Kırşehir, and accordingly, population distribution was calculated for each building.
Knowing about the local surface characteristics has an important place in the selection of new settlement locations and assessment of existing buildings. Knowing about the surface characteristics will allow researchers to prevent structural problems that are based on the territory (Ozdemir and Nalbantcilar, 2016; Büyüksaraç et al., 2014; Isik et al., 2016).Within the scope of this study, the local soil conditions of the region were determined by geological maps of Turkey with a scale of 1/500000 prepared based on geological ages determinedby the General Directorate of Mineral Research and Exploration (MTA). The ELER software calculates the selected ground motion prediction models for the magnitude and fault tear associated with the specified earthquake scenario and the ground motion distribution using VS30 maps. Subsequently, the obtained average ground motion distributions were assigned to geographical grids containing building distributions for use in risk analysis.
In this part, the Capacity Spectrum Method (CSM) and Coefficient Method (CM) models were used separately for an earthquake scenario and the estimations for building damage and loss of life were submitted in the form of tables. In both methods, the structures under the effect of earthquake were classified by into five different classes as collapse, heavy damage, moderate damage, slightdamage and no damage. After the calculations were made for both methods, the average values for these two methods were calculated. The building damage results that were obtained for the earthquake scenario are shown in Table 4.
Table 4 Damages estimated results for buildings for scenario earthquake
| Damage Level | Method | Mean | Ratio to the Total Buildings | |
| CSM | CM | |||
| Number of Building | ||||
| Collapsed | 2033 | 786 | 1410 | 2% |
| Severely Damaged | 2965 | 2400 | 2683 | 3% |
| Moderately Damaged | 7742 | 8404 | 8073 | 9% |
| Slightly Damaged | 14698 | 16796 | 15747 | 17% |
| No Damage | 62899 | 61951 | 62425 | 69% |
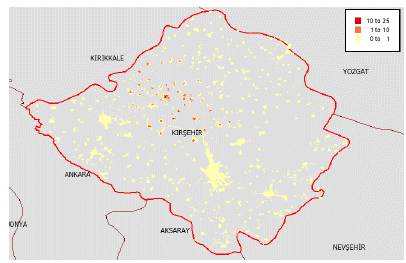
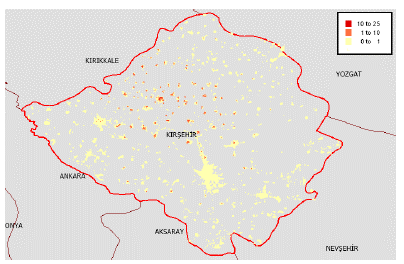
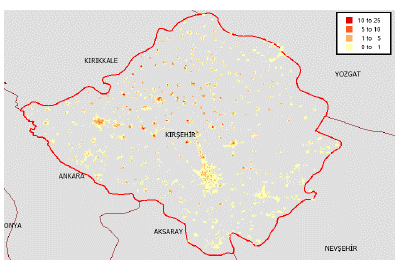
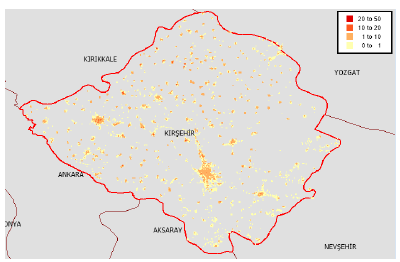
The maps that were produced in accordance with the damage levels are shown in the figures below. The figures were obtained by using the average values. Figure 8 shows the distribution map of the number of very heavily damaged buildings; Figure 9 shows the distribution map of the number of heavily damaged buildings; Figure 10 shows the distribution map of the number of moderately damaged buildings; Figure 11 shows the distribution map of the number of lightly damaged buildings.
The calculations were made for two models with the ELER software. The estimations of loss of life and injuries were calculated with HAZUS-MH (2003) and KOERI (2002) models according to the distributions of the buildings.
In the KOERI (2002) model, the earthquakes that occurred in Turkey were accounted for, and the matrix of injury rates for reinforced-concrete and masonry buildings were described. The rates that were obtained with the help of these matrices were multiplied by the number of people in the building at the time of the earthquake. The difference between the rates that are given under the definition of very heavy damage is relevant to the way that the building collapses. The first rate in this section is relevant to the buildings which were not damaged completely (not collapsed). The second rate is the rate of injuries in the buildings which were completely damaged (collapsed). The buildings which were completely damaged (collapsed) determined total number of deaths in an earthquake.
The HAZUS-MH (2003) model directly correlates deaths and injuries with building damage. In the areas where structural damage was lower, injuries mostly resulted from adamage which was not structural and in the areas where structural damage was heavy. There is apossibility of a large number of deaths. However, as there are no data concerning the deaths in the types of buildings and the types of damages that caused these deaths, in the statistical information concerning the deaths and injuries in earthquakes, attention should be paid to the fact that the injury rates that were used here were close. The estimations of loss of life were calculated below by using two different estimation models of loss of life for the earthquake scenario that was used in the study.
The estimation results of loss of life and injury which may occur for the earthquake scenario that was used in the study are given in Table 5.
Table 5 Loss of life and injury to forecast results
| Injury Level | Method | Mean | |||
| CSM | CM | ||||
| KOERI HAZUS | KOERI HAZUS | ||||
| Number of people | |||||
| Level 4 (Loss of life) | 130 | 28 | 57 | 12 | 57 |
| Level 3 (Seriously injured) | 130 | 14 | 57 | 6 | 52 |
| Level 2 (Hospital treatment) | 274 | 92 | 137 | 47 | 138 |
| Level 1 (Slightly injured) | 495 | 349 | 281 | 224 | 337 |
There are differences between the results that were obtained from the KOERI (2002) and HAZUS-MH (2003) models. The reason for this was that, while the KOERI (2002) model was being prepared, the damage and loss data from the past earthquakes in Turkey were used. It may be stated that there was a difference between the results of the two models as a result of using data specific to Turkey (Hancilar et al., 2010). This is why the average values of the results that were obtained in the study by the two methods were taken for the analyses. The comparison of the loss ratios for the two methods that were used in the study is given in Table 6 for reinforced-concrete buildings and Table 7 for masonry buildings. As it may be understood from the two tables, the ratios in the KOERI (2002) model were higher. Due to this issue, there were differences between the two methods.
Table 6 Comparison of casualty rates for RC structures
| Injury Severity | Casualty Rates for reinforced concrete structures (%) | |||||||
|---|---|---|---|---|---|---|---|---|
| Slight damage | Moderate damage | Severely damaged | Complete damage (collapsed) | |||||
| KOERI (2002) | HAZUS-MH (2003) | KOERI (2002) | HAZUS-MH (2003) | KOERI (2002) | HAZUS-MH (2003) | KOERI (2002) | HAZUS-MH (2003) | |
| Severity 1 | 0.05 | 0.05 | 0.2 | 0.25 | 1 | 1 | 10-50 | 5-40 |
| Severity 2 | 0.005 | - | 0.02 | 0.03 | 0.5 | 0.10 | 8-15 | 1-20 |
| Severity 3 | - | - | - | - | 0.01 | 0.001 | 4-10 | 0.01-5 |
| Severity 4 | - | - | - | - | 0.01 | 0.001 | 4-10 | 0.01-10 |
Table 7 Comparison of casualty rates for masonry structures
| Injury Severity | Casualty Rates for masonry structures (%) | |||||||
|---|---|---|---|---|---|---|---|---|
| Slight damage | Moderate damage | Severely damaged | Complete damage (collapsed) | |||||
| KOERI (2002) | HAZUS-MH (2003) | KOERI (2002) | HAZUS-MH (2003) | KOERI (2002) | HAZUS-MH (2003) | KOERI (2002) | HAZUS-MH (2003) | |
| Severity 1 | 0.05 | 0.05 | 0.4 | 0.35 | 2 | 2 | 10-50 | 10-40 |
| Severity 2 | 0.005 | - | 0.05 | 0.04 | 0.5 | 0.20 | 8-15 | 2-20 |
| Severity 3 | - | - | - | - | 0.002 | 0.002 | 5-10 | 0.02-5 |
| Severity 4 | - | - | - | - | 0.002 | 0.002 | 5-10 | 0.02-10 |
The most distinct effect of earthquakes is the destruction of the environment which has completed its structuring process. An earthquake may lead to damage in all structures. The construction areas and structural damage rates according to the damage levels in buildings as a result of the earthquake scenario are shown in Table 8. In financial loss calculations, the total areas of damaged buildings are separately obtained with the help of the data that are input in regard to the buildings in the software that was used in the study. In the study, the average area of a storey in the software was assumed to be 100m2. The financial costs for any building could be calculated by approximation. For this, the class of the building based on the architecture services in Turkey was considered, and approximate costs of buildings are calculated each year by including non-tax general costs (15%) and contractor profit (10%) for different groups of buildings. While making this classification, the building is categorised in terms of the architectural services that are provided. An approximate m2 unit price is determined for each building class. These prices are published annually as a notice. As it was not a practical solution to calculate costs for each building in the study, the building class of III-A was considered to cover all the buildings. In the "Notification Concerning the 2019 Structure Approximate Cost Per Unit Which Will Be Used in the Calculation of Architecture and Engineering Service Fees" published in the Official Gazette by the Ministry of Environment and Urban Planning, the price of Class - III- Group A structures was 980 TL/m2. According to the currency values provided by the Turkish Central Bank, this value is approximately180$/m2 today. The financial losses that result from structural damage were estimated by multiplying the total area of the damaged construction and unit cost. The construction areas obtained according to the damage types in conformity with the earthquake scenario that was used in the study are presented in Table 6.
Table 8 Construction areas according to the type of damage
| Damage Level | Construction Area (m2) | Damage Ratio | Damaged Construction Area (m2) |
| Collapsed | 247942 | 100% | 247942 |
| Severely Damaged | 484233 | 80% | 387386 |
| Moderately Damaged | 1466687 | 40% | 586675 |
| Slightly Damaged | 3007603 | 10% | 300760 |
| No Damage | 11702376 | 0% | 0 |
| Total | 1522763 | ||
Economic loss from structural damage = 1522763x180~274Million$
Results and Conclusions
This study has significance in terms of constituting an example implementation of loss estimation analyses. The application principles of loss estimation analyses are expressed. The parameters that were required for the loss estimation analysis software that were used in the study were collected from the field studies and checked in the office environment. The results of such studies may be used in other residential areas.
This study chose Kırşehir, which is prominent in terms of its geometrical position in Turkey and seismicity, as the pilot province in Turkey. In the scope of the project, only the province of Kırşehir and its districts were considered to provide an example for other residential areas. The study provides information on the seismicity of the province of Kırşehir. The earthquake of 1938 that inflicted significant effects in and around the province of Kırşehir was selected as the earthquake scenario, and loss estimation analyses were carried out accordingly. In t his context, cost calculations were made on building damages, losses of life, rates of injury and structural damages. The study also compared the loss rates that were calculated by the KOERI (2002) and HAZUS-MH (2003) models that were used to calculate the rates of losses. There were differences between the models.
It is required to estimate that the regions and types of structures that an earthquake will affect the most and there sults it will create should be considered before the earthquake occurs to be prepared for a possible earthquake in the best way. Loss estimation analyses play a significant role at the assessment stage of earthquakes and estimation of damages that earthquakes may lead to. With these analyses, information concerning the potential damages and losses may be accessed.
Natural disasters result in a substantial amount of loss of national resources in ways such as destroying a large number of animals, collapsing buildings, extinction of forests, destruction of electricity and communication lines, closing roads, collapsing bridges, blocking streams and creating risks of flood, as well as losses of life. Determination of the regions that are under natural disaster risk is not adequate in decreasing and/or eliminating losses. In order to reduce disaster risk, raising awareness among the community is of the utmost importance.
Loss estimation models are defined as the most significant tools required for risk mitigation. Thanks to loss estimation models, urban planners and disaster managers will access key information on potential damages and losses.
It was determined that there are 90337 buildings of which approximately 55% are reinforced-concrete within the provincial borders of Kırşehir. Approximately 93% of the reinforced-concrete buildings in the study are 1-4 storied. On average, 4093 (approximately 5% of all buildings) buildings were damaged to an irreparable extent (heavy + very heavy damage) depending on the earthquake scenario. The number of the moderately and slightly damaged buildings was estimated to be 23820 (26% of all buildings) depending on the earthquake scenario.
The population within the borders of Kırşehir was determined as 225197. The estimation of loss of life determined by using various methods was 57 persons on average depending on the scenario. The number of people for which hospital care was required was 138 persons on average depending on the earthquake scenario.
The financial cost of the structural damage that was calculated for the case of the occurrence of the earthquake scenario that was considered in the study was 274 Million $. This is an economically significant value. This damage represents the economic dimension of direct damages. In addition to this, the economic dimension of the damage will increase even further if indirect economic losses are also included.
The fact that the data on damage assessment after an earthquake for the province of Kırşehir is missing made it impossible to compare the results of the study to others. This is why it is important to keep damage assessment operations after earthquakes in a database are important for the evaluation of such studies.

