Introduction
Coalbed methane exists in coal rock, and coalbed methane enrichment remains a difficult research topic. In addition to the coal seam, which influences methane enrichment (Groshon, Pashin, & McIntyre, 2009; Kçdzior, 2009; Hemza, Sivek, & Jirásek, 2009; Gao et al., 2012; Moore, 2012), the coal seam roof also affects the enrichment of coalbed methane. Thus, the role of the roof has attracted increased research attention (Chen, Cui, Liu, & Lang., 2006; Zhou, 2013; Song et al., 2013). The properties of coal seam roofs are difficult to determine based on sparse borehole data; however, 3D seismic data collected at low frequencies (5-100 Hz) can greatly improve the density of control points and identification accuracy. The theories regarding the propagation velocity of sound waves in rock at seismic frequencies have not been supported by experimental data, although some have described the velocity and attenuation of sound waves in fluid-saturated rock at seismic frequencies (Ba, 2010; White, 1975; Biot, 1956). These theoretical models are mainly based on experimental data at ultrasonic frequencies (MHz). Tutuncu, Gregory, Sharma, and Podio (1998) measured the P-wave and S-wave velocities of a saline-saturated sandstone at frequencies of 10 Hz-1 MHz, and the results showed that both the P-wave and S-wave velocities displayed upward-increasing trends. Batzle, Han, and Hofmann (2006) tested and compared the propagation velocity of sound waves at seismic and ultrasonic frequencies using a low-frequency stress-strain method and an ultrasonic test. Wang, Zhao, Harris, and Quan (2012) measured the bulk modulus of different types of rocks at 600 Hz using resonance spectroscopy and compared the results with those at ultrasonic frequencies. Using a low-frequency stress-strain method, Wei, Wang, Zhao, Tang, and Deng (2015a; 2015b) discussed the factors that influence the propagation velocity of sound waves in sandstone and studied the propagation velocity of sound waves and their dispersion characteristics under different conditions. In this paper, the propagation velocity of sound waves in four types of rocks was measured and studied using a low-frequency stress-strain method. By matching the tested velocity with 3D seismic data, we identified the coal seam roof lithology to explore the influence of the roofs on the enrichment of coalbed methane. We hope that this study will improve studies of the propagation velocity of sound waves at low frequencies and the enrichment trends of coalbed methane (Hungerford, 2013; Li & Wu, 2016; Liu, 2018).
Research methods
Low-frequency rock petrophysics experiments
The samples used in the low-frequency rock petrophysics experiments included four representative types of rocks: gritstone, fine sandstone, argillaceous siltstone, and mudstone. The rocks were collected from the top of the #3 coal seam of the Permian Shanxi Formation at the Sihe Coal Mine in the southern Qinshui Basin, China. The gritstone was coarse-grained quartz sandstone with no primary pore development, some micro-fissures, and a porosity of less than 3%. The fine sandstone was fine quartz sandstone with primary pore development and a porosity of approximately 20%. The argillaceous siltstone was composed of fine particles and miscellaneous bases with poor separation, no primary pore development, and porosity of almost 0%. The mudstone was collected from the immediate coal seam roof, was composed of argillaceous rocks, and had a porosity of 0%.
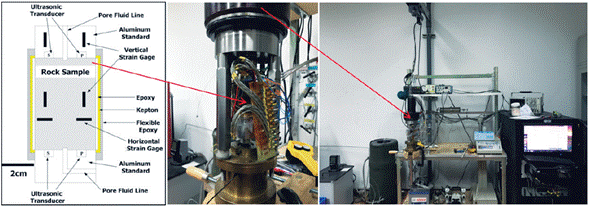
In this experiment, the physical system used to test the rock samples at low frequencies (Fig. 1) was developed by the Colorado School of Mines, and a low-frequency stress-strain method was used as the experimental method. The tested rock samples were cylindrical, with a diameter of 38 mm and a length of 50-80 mm. Each sample had cylindrical aluminum block bases and P- and S-wave probes at both ends. Additionally, longitudinal and transverse strain gauges were fixed on the aluminum block bases and rock samples, respectively.
The physical testing system can produce acoustic waves with frequencies of 3-2,000 Hz, and the vertical and transverse strains can be tested with fixed strain gauges on the aluminum block and rock samples. The Young's modulus of the aluminum block was 69.8 GPa. Each rock sample and the aluminum block bases comprised a complete unit, so their stresses were the same during the test. Notably, the stress on the aluminum block (σ Al )was equal to that on the rock sample (σ s) (Formula 1).
The stress on the aluminum block (σ Al ) was as follows.
The Young's modulus of the rock sample (E s ) can be deduced from Formulas 1 and 2.
The Poisson ratio of a rock sample (v) can be obtained by Formula 4.
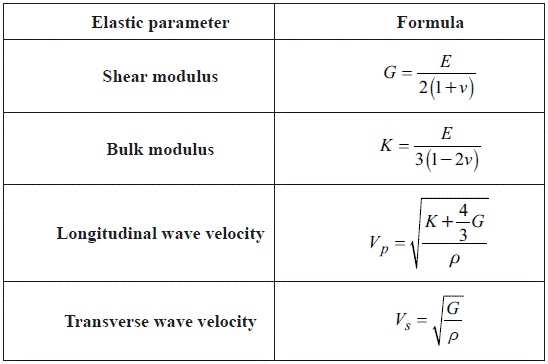
Because the Young's modulus and Poisson ratio of a rock sample were given, the other parameters of the rock sample at different frequencies and conditions could be obtained by the formulas listed in Table 1.
3D seismic data and gas content of the study area
The 3D seismic data had a CMP mesh density of 5 mх10 m, with 16 stacked layers. First, the data underwent a series of processes, including static correction, amplitude preservation, denoising, deconvolution, and velocity analysis. Then, post-stack wave impedance inversion was performed using the processed data. In terms of the stratum of the coal seam roof, the depth of the coal seam roof can be determined by observing the strong reflection interface formed by the coal seam and the surrounding rock. From the post-stack wave impedance inversion data, the P-wave impedance surface properties of the coal seam roof strata were extracted. To identify the coal seam roof lithology, the properties of the coal seam roof were correlated and matched with the product of the propagation velocity of the sound waves and the density of rock measured in the low-frequency experiments.
Using the gas contents measured in boreholes, the content difference and distribution were analyzed. The study area was 3.57 km long and 0.87 km wide, with an area of approximately 3.10 km2. The gas contents were collected from 20 wells, and measurements were obtained from cores via a direct analytic method for the #3 coal seam. When analyzing the gas content, a content distribution map was drawn using the Kriging interpolation method according to the gas contents of the boreholes.
Results
Results of the low-frequency experiments
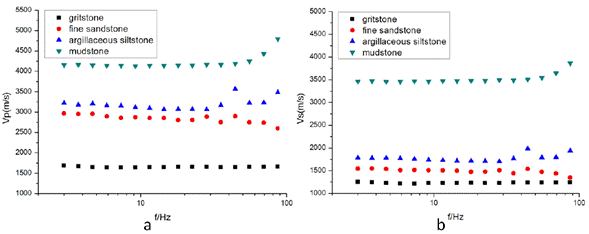
The propagation velocity of sound waves in the four types of rocks was measured at 16 frequencies from 3-100 Hz. The P-wave and S-wave velocities of the rocks at the 16 frequencies are shown in Fig. 2. Fig. 2a shows the relationship between the P-wave velocity and frequency. The P-wave velocity of the gritstone varies little at different frequencies, with an average of 1,651 m/s. The P-wave velocities of the fine sandstone, argillaceous siltstone and mudstone exhibited little variability, with average values of 2,840 m/s, 3,191 m/s and 4,214 m/s, respectively. Fig. 2b shows the relationship between the S-wave velocity and frequency, and the resulting trends are similar to those for the P-wave velocity, but with smaller variations and average values of 1,233 m/s, 1,492 m/s, 1,778 m/s and 3,514 m/s for the four materials. By comparing the propagation velocity of sound waves in the four types of rocks, we found that both the P-wave and S-wave velocities successively increased at different frequencies.
Wave impedance properties of the coal seam roof
Because wave impedance inversion is important for identifying rock properties, it is a common method used to identify sandstone and mudstone based on the sound wave velocity and density log curves. Figure 3 shows the P-wave impedance surface properties of the #3 coal seam roof in the study area. The depth of the roof was 10 m higher than the bottom boundary of the #3 coal seam, and the P-wave impedance varies between the roof and the boundary. According to the characteristics of the P-wave impedance of the roof, the impedance was divided into three types: yellow-red P-wave impedance (6,400 m/s-g/cc to 7,800 m/s-g/cc), blue P-wave impedance (7,800 m/s-g/cc-9,400 m/s-g/cc) and purple P-wave impedance (> 9,400 m/s-g/cc). The P-wave impedance, with a range of approximately 6,400 m/s-g/cc-10,000 m/s-g/cc, greatly differed and displayed obvious partitioning and zoning.
Gas content of the study area
The gas properties in the study area were analyzed with a Kriging interpolation method based on the gas contents of the boreholes in the #3 coal seam (Fig. 4). The overall gas content in the area was high but considerably varied. The study area (3.10 km2) exhibited a gas content ranging from approximately 19 m3/t to nearly 29 m3/t, a difference of nearly 10 m3/t. Three sub-areas with gas contents greater than 27 m3/t were observed and are colored in red in Figure 5. Four sub-areas with gas contents lower than 20 m3/t were observed and are colored in yellow in Figure 5.
Discussion
Wave impedance inversion can be used to analyze the properties of coal seam roof strata. Wave impedance is the product of the propagation velocity of a sound wave in rock and the density of the rock, and it can be used to identify the lithology. However, sandstone and mudstone cannot be distinguished simply by wave impedance and can be influenced by many factors. Moreover, the logging velocity was obtained at high frequencies in the process of wave impedance inversion. After well logging calibration was performed for the velocity and density log curves and 3D seismic data, wave impedance inversion was performed for data interpolation.
Low-frequency experiments were performed to obtain the propagation velocity of sound waves in four types of rock, and the velocity was used to calculate the theoretical wave impedance. The results did not match the wave impedance values obtained by 3D seismic inversion at higher frequencies. For example, Murphy (1984) measured the propagation velocity of sound waves in sandstone at different frequencies using the resonance bar technique, and the results showed that the propagation velocity of sound waves in sandstone at 500 kHz was 10-25% higher than that at 5 kHz. Tutuncu et al. (1998) measured the propagation velocity of sound waves in saline-saturated sandstone, and the P-wave velocity and S-wave velocity increased by 33% and 20%, respectively, as the frequency increased from 10 Hz to 1 MHz. Batzle et al. (2006) measured the P-wave velocity of high porosity and high permeability sandstone (with a porosity of 35% and a permeability of 8.7>10-12 m2) using a stress-strain method and ultrasonic measurement technique. The P-wave velocity of the 90% saturated sandstone at 0.8 MHz was 32% higher than that at 5-10 Hz (Batzle et al., 2006). These experiments confirmed that the propagation velocity of sound waves at seismic frequencies is lower than that at ultrasonic frequencies.
According to the collected borehole data, the coal seam roof was mainly composed of gritstone, medium sandstone, fine sandstone, sandy mudstone, siltstone, and mudstone. In this study, the propagation velocity of sound waves was monitored at both low and ultrasonic frequencies (1 MHz). The P-wave velocity at low frequencies was lower than that at ultrasonic frequencies, but the P-wave velocities of rocks with different lithologies considerably differed. To better match the theoretical wave impedance calculated according to the experimental results, the P-wave velocity was increased by 20% to compensate for the difference in velocity due to the difference in frequency. The specific data are shown in Table 2.
Table 2 The P-wave velocity and P-wave impedance of the rocks

*Vp Lf is the Vp value of the low-frequency condition, and Vp 1MHz is the Vp value of the 1 MHz frequency condition.
The difference in wave impedance for different lithologies was essential for matching the theoretical wave impedance with the wave impedance of 3D seismic inversion. The P-wave velocity of the gritstone was low, possibly due to the existence of micro-fissures. The P-wave impedance did not match that based on 3D seismic inversion, and the weighted P-wave impedance of the gritstone was 4,557 m/s-g/cc. The P-wave impedance of fine sandstone was 6,646 m/s-g/cc, which fell within the scope of the yellow-red wave impedance (6,400 m/s-g/ cc-7,800 m/s-g/cc) when matching the wave impedance obtained by 3D seismic inversion. The P-wave impedance of argillaceous siltstone was 9,228 m/s-g/ cc, which is within the scope of blue wave impedance (7,800 m/s-g/cc-9,400 m/s*g/cc). Additionally, the P-wave impedance of the mudstone exceeded 10,000 m/s-g/cc, which is within the scope of purple P-wave impedance (> 9,400 m/s-g/cc).
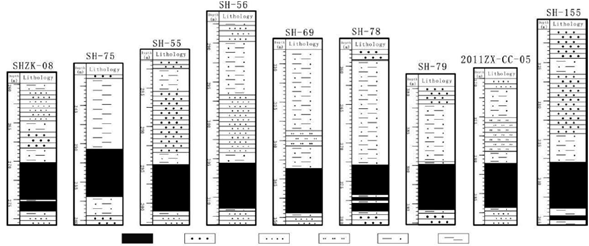
The lithology of the identified coal seam roof was tested according to the known borehole data. The depth of the coal seam roof was 10 m higher than the bottom boundary of the coal seam, and 2000 m/s was selected as the average propagation velocity of the sound wave. Fig. 5 shows the coal seam of the selected test well and the top and bottom lithology. The identified coal seam roof lithology was consistent with that revealed by the borehole data. In terms of lithological identification, sandstone could not be distinguished from fine sandstone, and sandy mudstone could not be distinguished from mudstone. However, the fine sandstone, siltstone and mudstone could be distinguished.
In addition to coal seams, coal seam roof also influence the enrichment of coalbed methane. During the diagenetic evolution of coal, a ton of coal, from lignite to anthracite, can produce 268-393 m3 of gas (Zhang & Li, 1988), but only a fraction of this coalbed methane is eventually preserved. The coal seam roof directly contacts the coal seam and undergoes diagenetic evolution together with the coal seam, and the compactness of the coal seam roof has a direct influence on the residual coalbed methane content (Li et al., 2003; Liu, Li, Yang, Liu, & Yan, 2012). By comparing and analyzing the coal seam roof lithology and gas content, we found that the coal seam roof lithology is related to the enrichment of coalbed methane. The coal seam roof in the three areas with high gas contents was mainly mudstone and argillaceous siltstone, and the coal seam roof in the four areas with low gas contents was mainly fine sandstone. The mudstone and argillaceous siltstone, which are highly compact, were more conducive to the preservation of coalbed methane, and the fine sandstone, which is poorly compact, was not.
Conclusion
In this paper, the variable propagation velocity of sound waves in four types of rock was measured at 3-100 Hz using a low-frequency stress-strain method. The P-wave and S-wave velocities of the gritstone, fine sandstone, argillaceous siltstone, and mudstone successively increased at the same frequency. The propagation velocity of sound waves in the four types of rock at seismic frequencies was lower than that at higher frequencies. After the P-wave velocities obtained via testing were considered, the theoretical P-wave impedance of the four types of rocks was calculated, and the values were then matched with the wave impedance values of seismic inversion for the coal seam roof. The roof was mainly composed of mudstone, argillaceous siltstone, and fine sandstone, and the boreholes verified that the lithology. The lithology of the roof is related to the enrichment of coalbed methane. The roof in areas with high gas contents was mainly mudstone and argillaceous siltstone, and that in areas with low gas contents was mainly fine sandstone. Compact areas of the coal seam roof were more conducive to the formation and preservation of coalbed methane.


