


 English (pdf)
 Article in xml format
 Article references
 Send this article by e-mail
 Cited by SciELO
  Cited by Google
  Similars in
SciELO
Similars in
SciELO  Similars in Google
 Permalink
Introduction
With the gradual decline of hydrocarbon reserves in conventional reservoirs and the increasing global energy demand, the great potential of unconventional reservoirs has made them the focus of global oil production (Ghanizadeh et al., 2015). Tight sandstones are characterized by extremely low porosity and permeability, the presence of nano-scale throat space, and having undergone strong diagenesis (Rezaee et al., 2012; Zou et al., 2013), all of which influence the characteristics of seepage from tight reservoirs (Jarvie et al., 2007; Nelson, 2009; Xi et al., 2016). Therefore, a comprehensive understanding of the pore-throat distribution in tight sandstone and how it is affected by diagenesis is necessary for quality-evaluation and successful production.
The pore size distribution (PSD) in tight sandstones can be characterized by many techniques, such as thin section analysis, scanning electron microscopy (SEM), X-ray computed tomography (CT), pressure-controlled porosimetry (PCP), rate-controlled porosimetry (RCP), nuclear magnetic resonance (NMR) and N2 adsorption, but these techniques all have limitations that hinder determination of the characteristics of pore-throats of a wide range of sizes. SEM (FE-SEM) and thin sections provide direct information on the morphological characteristics of reservoir space and can be used to determine the genetic origins of pore-throats, but they fail to provide quantitative data (Klaver et al., 2012; Loucks and Ruppel, 2007). PCP can be used to obtain quantitative data on pore-throat radius from samples and effectively identify nanopores but fails to measure large pores due to the shielding effect (Gane et al., 2004). RCP can examine pore spaces and throats spaces separately according to the oscillation of intrusion pressures (Yuan and Swanson, 1989) but cannot reveal the distribution of tiny throats due to the limited maximum intrusion pressure (6.22 MPa) (Wang et al., 2018; Zhao et al., 2015). CT can be used to reconstruct 3D images of pore-throats, but its application is restricted by its high cost and the inevitable error that arises in calculating pore-throat radius (Mayo et al., 2015). NMR can be employed to obtain the pore size distribution through a transformation of the value of transverse relaxation time (Daigle and Johnson, 2016; Gao et al., 2019). However, the test results need to be corrected, and the test range is limited by surface relaxivity (Xiao et al., 2017a). Nitrogen adsorption can only obtain information on nanopores in tight sandstones (Yao and Liu, 2012)
Stated thus, one single technique can only partially reveal the pore-throat distribution of a tight sandstone, so integration of several techniques appears to be necessary for characterizing their overall pore-throat distribution. Therefore, scholars have combined PCP, RCP, nitrogen adsorption, and NMR to study the pore-throat distribution of tight sands by considering the limitations of the different tests (Xiao et al., 2017b; Yan et al., 2017; Yao et al., 2010; Zhang et al., 2017; Zhao et al., 2015) This approach has expanded the range of pore sizes that can be investigated and has improved the accuracy of pore size characterization. RCP and PCP are based on the same principle, so the results from these two methods can be well-integrated to reveal the pore size distribution of tight sandstones. RCP overestimates the size of pore bodies (Xiao et al., 2017b), however, so the data derived by RCP must be corrected to obtain accurate pore distribution data.
The evolution of pore-throats is influenced by several factors such as the original rock composition, sedimentary environment and diagenesis. Sedimentation forms the basis of the pore-throats, and diagenesis modifies them (Waples, 2002; Zhu et al., 2014). Many scholars have studied the evolution of pore-throats during diagenesis. Some of the conclusions that have been reached are as follows: (1) Compaction and cementation reduce the space between gains and are the main diagenetic processes that reduce the pore-throat space in tight sandstone (Hillier, 2000). (2) Chemical dissolution increases the relative content of secondary pores and improves the physical properties of the reservoir (Jia et al., 2018). However, less work has been done separating the effects of compaction and cementation on pores and throats because data are not available on the distribution of pore-throats of a wide range of sizes, which is essential for the study of pore-throat characteristics.
In this study, we first analyze pore-throat structures based on thin sections and SEM observations. Pore and throat types are divided into those with three origins: compaction, dissolution and clay-dominated. Pore-throats with different origins are shown to have different morphological characteristics. Secondly, the full-range PSD is established through a combination of PCP and corrected-RCP results. Finally, the influence of various diagenetic processes on the pore-throat distribution of tight sandstones is discussed.
Samples and experiments
Seven cylindrical core plug samples with a diameter of 2.48 cm and a length of 5.00 cm were prepared. Oil was removed from the samples with a mixed solution of benzene and alcohol, and they were then dried in a bake oven at 115°C for 12 h. The samples were analyzed via porosity and permeability tests and were then were divided into parts for further experiments.
Samples
All of the samples were Chang 7 tight sandstones, which from part of the Upper Triassic Yanchang Formation in the Ordos Basin (Fig. 1). The Chang 7 sandstones were deposited in a semi-deep and deep lake sedimentary environment and are dominantly fine-grained sandstone. Chang 7 developed in the period when lakes were at their deepest, leading to the formation of high-quality source rocks within it. The crude oil generated from the source rocks in Chang 7 migrated immediately to the adjacent Chang 7 tight sandstones as the rocks were maturing (Zhang et al., 2009), making the Chang 7 tight sandstone a tight oil reservoir.
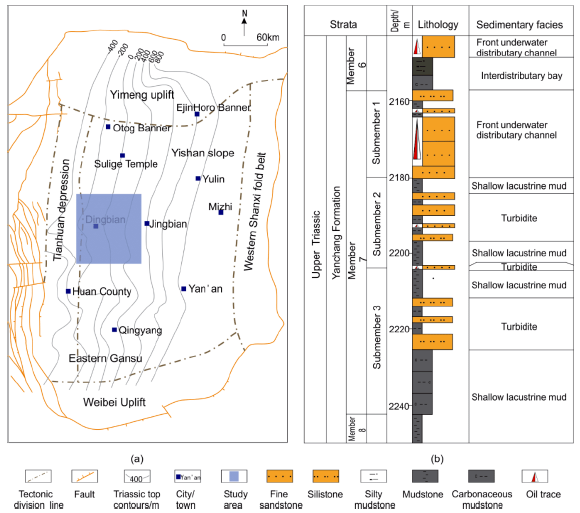
Figure 1 Geological and lithological features. (a) Location and tectonic units of the research area (modified from Yang et al. (2005)); (b) comprehensive stratigraphic column of tight sandstone in the Ordos basin (data on lithological features from Wu et al., 2018)
Experimental methods
The morphological characteristics of pores and throats were measured with an FEI Quanta 400 FEG SEM at 30 kV and 1.2 nm. Each sample was first polished and then gold-coated to better capture the morphological characteristics of the pore-throats. An Autopore 9420 mercury porosimeter was used for PCP. The maximum injection pressure was 200 MPa, corresponding to the ability to detect a pore radius of 36 nm. RCP was carried out with an ASPE-730 mercury porosimeter, and the rate of mercury intrusion was kept constant at a value of 0.001 µL/s. The maximum intrusion pressure was 6.8 MPa (1000 psi), corresponding to a pore radius of 0.1 µm.
Results
Lithological characteristics of tight sandstone
The mineralogical compositions of the seven samples are shown in Table 1. The dominant minerals are quartz, feldspar, clay and carbonate.
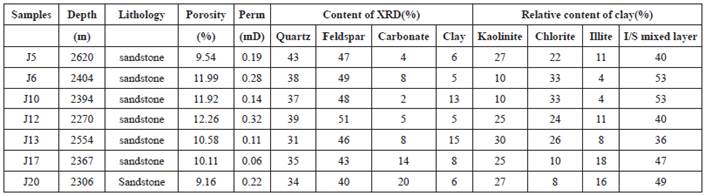
The quartz content ranges from 31% to 43%, with an average value of 37%. The feldspar content varies from 40% to 51%, with an average value of 46%. The carbonate content is from 2% to 18%, with an average value of 8.7%. The clay content ranges from 5% to 15%, with an average value of 8.2%.
The porosity values of the samples vary from 9.54% to 12.26%, with the average value being 10.79%. Their permeability varies from 0.06><10-3 µm2 to 0.32x10⁻³ µm2, with an average value of 0.19>10-3 µm2. The tight sandstone thus has extremely poor petrophysical properties.
The pores in the samples can generally be classified into three types on the basis of the SEM and thin section images: residual intergranular pores, mineral dissolution pores and intercrystalline pores. Residual intergranular pores are the major pore type in the tight sandstone and formed through compaction, cementation and dissolution (Fig. 2A and B). Mineral dissolution pores are generated by dissolution and were usually found in feldspar and debris (Fig. 2C and D), though dominantly in feldspar. Intercrystalline pores were mainly found in illite and chlorite (Fig. 2E and F).
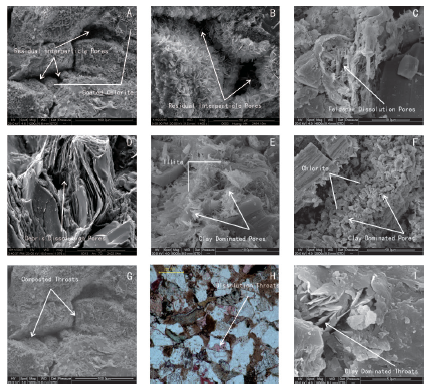
Figure 2 Primary pore and throat types in sandstone samples in thin section and SEM images. (A) residual intergranular pores preserved by chlorite (J6), (B) residual intergranular pores that are triangular and regularly polygonal (J20), (C) dissolution pores in feldspar (J6) (D) dissolution pores in debris (J10), (E) intercrystalline pores in illite (J12), (F) intercrystalline pores in chlorite (J13), (G) compacted throats (J5), (H) dissolution throats (J10) and (I) intercrystalline throats formed by clay-space necking (J17).
The size and shape of the three types of pores vary significantly. The residual intergranular pores take the form of triangles and regular polygons, and their edges are generally clear and straight. The radii of residual intergranular pores are relatively large, ranging from 50 µm to 200 µm, and the connectivity between pores is good. The feldspar dissolution pores are irregularly shaped, and their sizes are generally <100 µm. The connectivity between feldspar dissolution pores is worse than between residual intergranular pores. Intercrystalline pores range in size from 1.5 µm to 5 µm, and their connectivity is the worst of the three types.
The throats in all of the samples were classified into three main types on the basis of the SEM images and thin section images, namely compacted throats, dissolution throats and intercrystalline throats.
With intense compaction and cementation, the primary pore space in the samples is gradually squeezed, and compacted, cement-infilled throats are formed. Soluble mineral particles eroded by acidic fluids form dissolution throats, which are connected with dissolution pores. The intercrystalline pores in chlorite or illite form the intercrystalline throats. Compacted throats are necking and range in radius from 0.8 µm to 4 µm (Fig. 2G), while dissolution throats are flake-like and are in the range 0.3-0.8 µm (Fig. 2H). Intercrystalline throats are tube bundles, and their radii are mainly <0.2 µm (Fig. 2I).
Pore-throat structures
Mercury injection is an effective way to obtain quantitative data on micro-nano-scale pores. The intrusion pressure Pc was converted to pore or throat radius by applying the Washburn equation (Washburn, 1921), adopting an interfacial tension value of485 dyn/cm and a wetting angle of 140°.
PCP curves
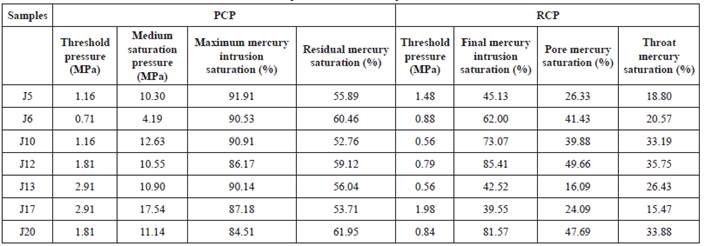
Variation in the slopes of the mercury intrusion curves was attributed to variability in the pore size distribution (Fig. 3); the corresponding parameters are given in Table 2.
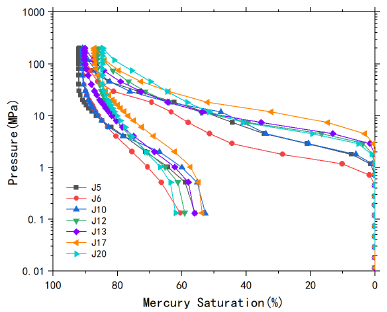
The mercury injection curves for the tight sandstone samples can be divided into two types. J12, J13, J17 and J20 belong to type I. These mercury intrusion curves contain one platform. When the mercury injection pressure is < 7 MPa, the corresponding mercury saturation increases at a low rate with the increase in pressure, forming an obvious platform in the curve. When the mercury injection pressure is > 7 MPa, the corresponding mercury saturation increases at a higher rate. The threshold pressure of this type is the higher of the two types, with a mean value of 2.35 MPa. This indicates that the maximum pore space that allows the fluid to enter the sample is small.
The curves for J5, J6 and J10 belong to type II. There are two platforms in mercury intrusion curves of this type. When the mercury intrusion pressure is < 3MPa, a platform appears due to a slow increase in the mercury intrusion saturation. When the mercury intrusion pressure is between 3 MPa and 10 MPa, the mercury intrusion saturation increases rapidly. When the mercury intrusion pressure is > 10 MPa, the mercury saturation increases more slowly, forming the second platform. The threshold pressure of this type of curve is low, with a mean value of 1.01 MPa.
There is some discrepancy in the medium saturation pressures of the seven samples: the largest, 17.56 MPa, is for sample J17, and the smallest, 4.19 MPa, is for sample J6. This variation indicates that the pore-throat distribution of the samples is inhomogeneous. The maximum mercury intrusion saturations and residual mercury saturations of the samples differ greatly, with the average values being 88.78% and 57.13%, respectively. The difference between the mercury intrusion saturation and the mercury extrusion saturation indicates that a large amount of mercury residue remained in the pore-throat space of the samples.
RCP curves
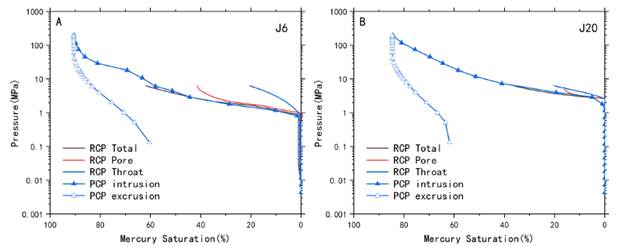
RCP can provide information on the pore-throat structure because the data derived by this method reflects the pore space and throat space separately.
The samples were differentiated into two types based on the characteristics of the intrusion curve (Fig. 4); the full RCP results are given in Table 2.
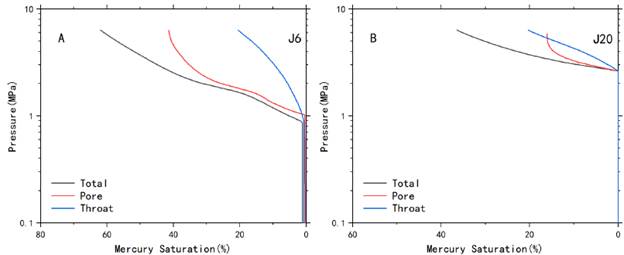
For sample J6, the total mercury saturation curve shows a similar trend with increasing pressure as the throat injection and pore injection curves, and the total mercury intrusion can be seen to be controlled by both throats and pores. For sample J20, the mercury intrusion saturation was controlled by pores at the beginning of mercury intrusion, but, with increasing pressure, throats became the controlling factor.
The threshold pressures of the two types of samples are similar. The average value for type I is 1.04 MPa, and that for type II is 0.97 MPa, indicating that the maximum throat radius controlling the intrusion of fluids into pores is similar in type I than in type II.
For type I, the final intrusion saturation ranges from 39.55% to 85.41%, with an average value of 62.26%, and for type II, the final intrusion saturation varies from 45.13% to 73.07%, with an average value of 60.07%. The final mercury saturation of type I is similar to that of type II, indicating that the macro-scale throat content of the samples is similar. The similar intrusion satruration and threshold indicates that micro-scale pore spaces is similar in two types I and II.
Discussion
Features of the PCP results
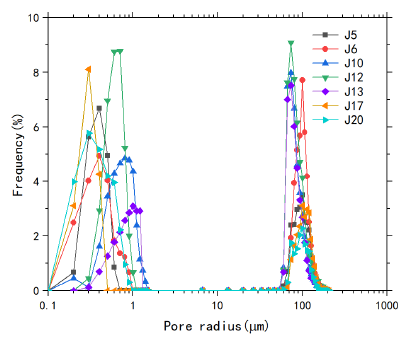
The pore-throat radius distribution can be obtained from the saturation values corresponding to different pressures along the mercury intrusion curve (Fig. 5). The PSD obtained by PCP shows that the pore radius ranges from 36 nm to 1.01 µm, and is mainly within the range of 0.01-0.4 µm.
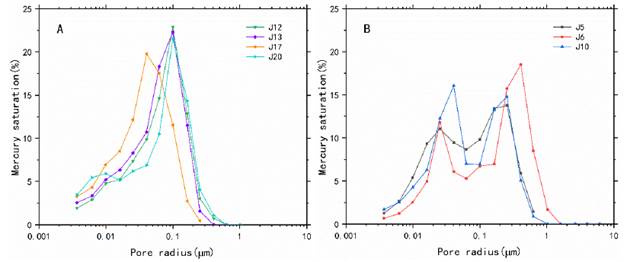
The pore-throat distribution curve for type I forms a single peak at a pore radius of 0.1 µm. The pore-throat distribution of type H is bimodal, indicating that there are two pore-throat development regions. The smaller pore-throats are 0.04 µm and the larger pore-throats are 0.8 µm.
The PCP mercury intrusion curve shows a smaller pore radius than the thin section and SEM observations and cannot identify residual intergranular pores with a larger radius.
Features of the RCP results
When calculating the reservoir space by RCP, the pore space is considered to be spherical. However, because of compaction and cementation in tight sandstones, the shape of pore space is dominantly tubular (Xiao et al., 2017b). Thus, the final pore distribution is obtained by first multiplying the initial pore radius given by RCP by a shape factor (2/3) to account for this tubular shape.
The radii of the pores range from 50 µm to 200 µm, and the PSD is characterized by two peaks (Fig. 6A). The right peak ranges from 100 µm to 200 µm, which mainly corresponds with residual intergranular pores filled with cements, which have a large radius. The left peak ranges from 50 µm to 100µm, which is mainly attributable to feldspar dissolution pores, which have small radii. The throat sizes are widely distributed, ranging from 0.2 µm to 1.4 µm (Fig. 6B), implying that the nano-scale reservoir spaces have been strongly influenced by diagenesis.
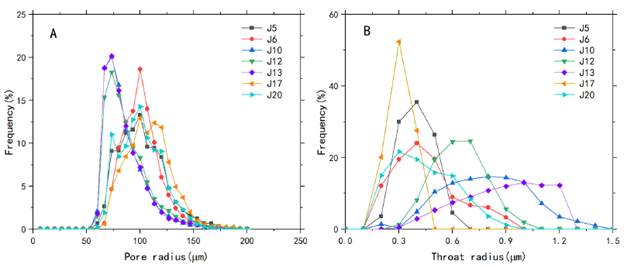
Figure 6 RCP-derived distributions of (A) pores and (B) throat bodies in seven tight sandstone samples
The PSD can be calculated by consideration of the pore distribution and throat distribution data from RCP (Fig. 7). The pore-throat distributions of the seven samples are characterized by having two peaks. The distribution of the right peak is consistent with the information obtained via thin section and SEM examination, ranging from 60 µm to 150 µm, while the distribution of the left peak is limited by injection pressure and ranges from 0.2 µm to 1.2 µm.
PSD calculated by PCP and RCP
Differences between the PCP and RCP results
As discussed above, both PCP and RCP have limitations. It is impossible to obtain the full-range pore-throat distribution using just one of them. RCP can distinguish pores and throats, but the maximum mercury intrusion pressure is low, and throats with a radius of under 0.12 µm cannot be characterized. PCP can provide information on smaller pore-throats because of its high mercury intrusion pressure, but it cannot distinguish pores and throats, so it has poor ability to recognize pores with a large radius. Therefore, it is best to combine the two test datasets to obtain the overall PSD, taking advantage of the strengths of both PCP and RCP.
Since PCP and RCP are calculated under the same test principle, samples should have the same mercury intrusion curves under the same mercury intrusion pressure (Fig. 8). In reality, the mercury intrusion curves obtained by PCP and RCP are not exactly the same due to the differences in contact angle and interfacial tension in PCP and RCP.
The mercury saturation reached in the PCP tests varied from 84.51% to 91.91%, with an average value of 88.76%, which is larger than that arrived at through RCP (averaging 63.98%), indicating that there is a lot of nano-scale pore space in tight sandstone that cannot be probed by RCP. This is caused by the limitation on the mercury intrusion pressure that can be applied.
Full-range PSD calculated by PCP and RCP
The measurement range of RCP means that it can characterize pores but cannot identify nano-scale throat bodies, while PCP can characterize the overall distribution of nano-scale throats. Thus, the combination of the throat distribution derived by RCP and the pore distribution derived by RCP is an efficacious method for revealing the pore-throat distribution.
The mercury intrusion curve of PCP overlaps with that of RCP when the intrusion saturation is low. This portion of the data reflects the pore distribution of the sample, which can be obtained from the PSD given by RCP. When the mercury intrusion saturation in RCP reaches its maximum, the distribution of the remaining throats in the sample is derived from the PCP mercury intrusion curve. Thus, the distribution of micro-scale spaces is derived from RCP, and the distribution of nano-scale spaces is derived from PCP
The pore-throat sizes detected in the tight sandstone range from 36 nm to 200 µm in radius (Fig. 9). The full-range PSD curves are dominated by three peaks. The right semi-peak ranges from 50 µm to 200 µm, with a peak value of 90 µm; the corresponding pore types are residual intergranular pores and dissolution pores. The middle semi-peak ranges from 0.2 µm to 1.5 µm; throats in this size range are compacted throats. The left peak is between 36 nm and 0.2 µm and reaches a maximum at different values for the two sandstone types: 0.1 µm for type I and 0.04 µm for type II. Throats in this size range are dissolution throats and intercrystalline throats.
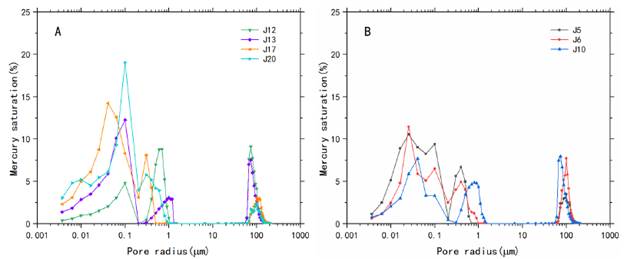
Figure 9 Pore size distribution derived by combining PCP and RCP results. (A) Type I and (B) Type II
The peak values of the middle peak and right peak to not differ significantly for the two types, indicating there is no obvious discrepancy between the content of pores and compacted throats in the two types. The higher peak value for the left peak for type I than for type II, meanwhile, implies that dissolution throats control more mercury intrusion space in type I samples than in type I samples.
When pore radii are <1.5 µm, their pore-throats are dominantly nano-throats, including compacted throats, dissolution throats and intercrystalline throats. The sizes of compacted throats are between 0.2 µm and 1.5 µm, the sizes of intercrystalline throats are <0.05 µm, and dissolution throats usually range from 0.05 µm to 0.2 µm. The results show that the content of the different throat types differs significantly between the tight sandstone samples.
The saturation of micro-scale pore bodies ranges from 15.87% to 49.66%, with an average value of 33.49%, and the average saturation of nano-scale throats is 66.54%, indicating that nano-scale throat bodies, rather than micro-scale pore bodies, dominate the pore spaces of the tight sandstones. With a decrease in the permeability of the samples, the nano-scale throat content increases, while the proportion of micro-scale pores decrease.
The influences of diagenesis on the full-range pore-throat distribution
Diagenesis after sedimentation has an important influence on pore-throat formation, giving rise to the complexity and heterogeneity of pore-throat space in tight sandstones. The effects of diagenesis on pores and throats can be inferred from the full-range pore-throat distribution.
(1) Compaction: Samples J5, J6, J10, and J12 have similar contents of mineral particles, as well as a relatively low cement content (<15%) (Table 1). With increasing sample depth from 2270 m to 2620 m, the pore distribution range remains stable and the pore-space saturation decreases gradually from 49.66% (sample J12, 2270 m) to 26.33% (sample J5, 2620 m) (Fig. 10A, B and C). There is no obvious variation in the peak value of throats with a radius of under 1 µm in the four samples.
With increasing depth, the porosity decreases from 12.26% to 9.54%, though the magnitude of the decline is relatively small for samples J12, J10 and J6. This decrease may have been caused by feldspar dissolution and the formation of clay minerals during early cementation (Figs. 2C and 10E, F), which can expand or preserve the pore space from compaction (Berger et al., 2009). This implies that compaction has a considerable pore-space and porosity-reducing effect.
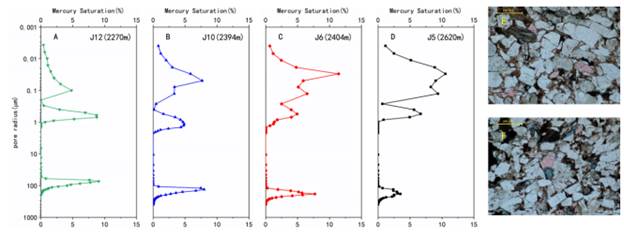
Figure 10 Graphs shown the effect of compaction on the pore size distribution of (A) J12, (B) J10, (C) J6 and (D) J5, which have different burial depths but similar mineral compositions. (E-F) Thin-section images showing (E) the residual intergranular pores in sample J12 and (F) isolated feldspar-dissolution pores in sample J5. Note that there is evidence of a decrease in the pore space and porosity as compaction increases.
(2) Cementation
The cements in the tight sandstones are mostly carbonate, while clay cements are less dominant. Carbonates generally take a double-crystal shape, and clay appears both in the form of a coating on mineral particles and as crystals bridging spaces between grains. These cements have an important effect on reservoir quality.
(i) Carbonate. Samples J10, J17, and J20 have similar burial depths and mineral particle content, and the cements in the three samples are dominantly carbonate and clay. With increasing carbonate content from 2% (J10) to 20% (J20) (Table 2), the content of pore bodies becomes significantly lower, dropping from 39.88% to 15.88% (Figs. 11A, B and C). Porosity also shows corresponding changes. That may be caused by carbonate infilling of pore spaces during the later stages of cementation (Fig. 11D), implying that carbonate plays an important role in reducing pore size.
(ii) Clay. With increasing clay content from 6% (J20) to 13% (J10), the distribution of the throat space becomes wider and the content of throat bodies becomes lower. That may be caused for throat space being filled and segregated by pore-bridging clay (Figs. 2E and 11E). Correspondingly, the permeability decreases.
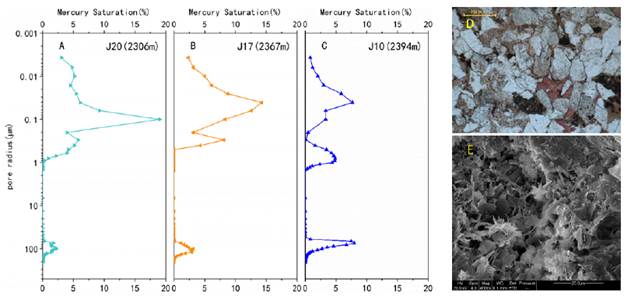
Figure 11 Graphs showing the effect of clay and carbonate cementation on the pore size distributions of (A) J20, (B) J17 and (C) J10, three tight sandstone samples that have similar burial depths but various contents and types of cements. (D) Thin-section image showing that sample J20 contains carbonate with a double-crystal shape. (E) SEM image demonstrating that sample J10 contains abundant illite. With an increasing content of pore-bridging cement, the content of throat bodies and permeability decrease appreciably, while the content of pore bodies does not. With an increase in carbonate content, the pore body content and porosity decrease substantially.
The clay minerals in samples J17 and J20 are mainly kaolinite and illite, while those in sample J10 are dominated by chlorite (Table 2). With a decreasing relative chlorite content, the content of pore space becomes lower. The higher pore space content in the chlorite-rich sample may be attributable to pore-lining-type authigenic chlorite forming during the early stages of cementation (Fig. 11A) preventing compaction and pore-bridging clay (e.g. kaolinite) from decreasing pore spaces (Huang et al., 2004). This indicates that pore-bridging clay cements can reduce the throat size by filling the throat, while pore-lining clay cements can preserve pore space by coating the grains.
Conclusions
SEM, thin section, PCP and RCP analyses were performed on seven samples from the Upper Triassic Yanchang tight sandstone from the Ordos Basin so as to bring the combined strengths of a range of methods to bear on determining the full-range distribution of pore bodies and throats and the effects of diagenesis upon them. The conclusions are as follows:
(1) The SEM and thin-section experimental results indicate that pores and throats formed in the tight sandstones by various diagenetic processes. These spaces can be distinguished between those with a compaction origin, a dissolution origin or a clay-dominated origin; these mainly formed by compaction, dissolution and cementation, respectively. Pore-throats with different origins have different sizes and shapes.
(2) The full-range pore size distribution of tight sandstones can be determined by combining the experimental data from PCP and RCP. The detected pore sizes of these tight sandstones range from 36 nm to 200 µm, and the PSD curves of the samples are polymodal. The right peak remains stable across the sample set and corresponds to residual intergranular pores and dissolution pores. The middle and left peaks show variation between samples due to the complexity and heterogeneity of nano-scale throat bodies. The average content of micro-scale pores is 33.46%, and that of nano-scale throats is 66.54%. Nano-scale throat spaces thus dominate the pore spaces in the tight sandstones.
(3) The effects of diagenesis on pores and throats were analyzed by comparing the pore-throat distribution of samples with various burial depths and cement contents. Pore-bridging clay cements can reduce throat sizes while pore-lining clay cementation coating mineral grains can preserve pore space. Carbonate deposited during later stages of cementation, and compaction decreases the content of pore bodies.

