


 English (pdf)
 Article in xml format
 Article references
 Send this article by e-mail
 Cited by SciELO
  Cited by Google
  Similars in
SciELO
Similars in
SciELO  Similars in Google
 Permalink
Introduction
A Catastrophic Landslide Triggered Debris Flow (CLDF) refers to a chain of landslides with a volume of more than 1x10⁷ m3 transforming to a high-speed and long distant debris flow after detaching from the parent rock due to the landslide's enormous potential energy (Huang and Fan, 2013, Chen et al., 2018, Samodra et al., 2018). At 20:00:11.95 on April 9th, 2000 (Local time), a catastrophic landslide triggered debris flow that occurred in the Zhamunong gully in Yigong (Wang and Lu, 2002, Shang et al., 2003, Evans and Delaney, 2011). The landslide struck the ground, leading to loosening bed depositions mixed in the landslide in the headstream of the gully, then the landslide transformed into a debris flow by the soil liquefaction. The deposits carried by the debris flow blocked the Yigong Zangbo river. The subsequent barrier dam outbreak on June 10th then fast formed a flash flood, which resulted in heavy casualties and economic losses (Kang et al., 2017, Wang and Li, 2017, Liu and He, 2018). In China, the flash flood damaged 318 National Road, Tongmai Bridge, the Motuo Jiefang Bridge, highways, among others. The G318 national highway was broken off for 76 days, which resulted in two people causalities and a loss of 280 million Yuan (Liu, 2000, Lu, 2002, XuQiang et al., 2012, Schmidt et al., 2015). Besides, the flash flood killed 94 people, 2.5 million people were homeless in Ramaphotra, northern India, and traffic broke off in 7 central Indian states (Tewari, 2004, Wang et al., 2016).
Many local and international scholars have studied this catastrophic disaster. Scholars have already studied the scale characteristics of the 2000 CLDF in the Zhamunong Gully and the macroscopic processes that occur when a landslide transfers into a debris flow; results show that this CLDF is triggered by rainfall and that the deposit volumes range from 1.2 to 3.0x10⁸ m3 (Shang et al., 2003, Xu et al., 2012, Evans and Delaney, 2011, Delaney and Evans, 2015). Meanwhile, a more large-scale debris low occurred in the same place in 1902 (Shang et al., 2003). However, the following issues in the above studies need to be researched: (a) CLDFs led by rainfall are generally small-scale (Wang and Sassa, 2003, Guzzetti et al., 2009, Chen et al., 2010). Previous studies show that freeze-thaw cycles, dry-wet cycles, and seismic linkages are extremely conducive to the development of CLDFs (Chen et al., 2014, Zhou et al., 2016, Huang et al., 2016) and that rainfall is a decisive factor for the occurrence of a CLDF (Chen et al., 2016, Deng et al., 2017). Additionally, a Ms 4.3 earthquake might inluence the occurrence of a landslide (Delgado et al., 2011). Is the occurrence of the 2000 CLDF related to the middle and small earthquakes, the freeze-thaw cycles and the dry-wet cycles in the region? (b) Studies on the dynamic process of landslides transforming into debris lows are not well understood, so it is necessary to perform a quantitative study on these dynamic processes. (c) The process of volume changes of CLDFs over long timescales are the basis for analyzing the development tendency of the CLDF in the Zhamunong Gully, but this research has yet to be published.
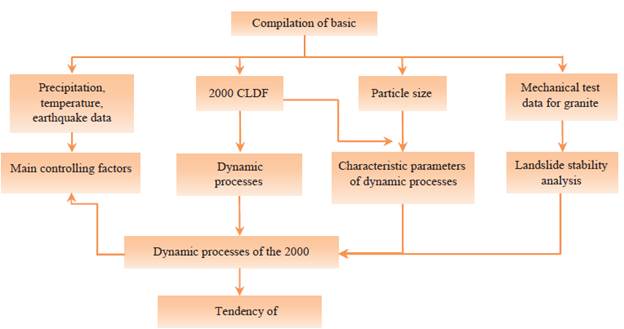
Due to the construction demand for major projects, such as town, roads, and hydropower, the practical demands of disaster prevention and reduction (Wang et al., 2018a, 2018b), and the scientific problem of surface denudation processes at the edge of the Tibetan Plateau, the main purpose of this paper is to study the main controlling factors on and dynamic processes and tendency of the CLDF in the Zhamunong Gully. To tackle the aforementioned issues, a case study is performed based on the 2000 CLDF in the Zhamunong Gully. Section 2 describes the study area and methodology. Section 3 and section 4 address the main controlling factors and the dynamic processes of the CLDF, respectively. Section 5 analyzes the development tendency of CLDF, and Section 6 presents the conclusions. The technical lowchart is shown in Figure 1.
Study area and methodology Study area
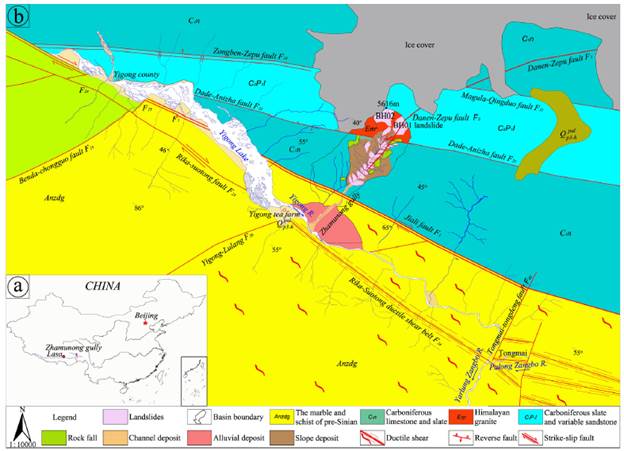
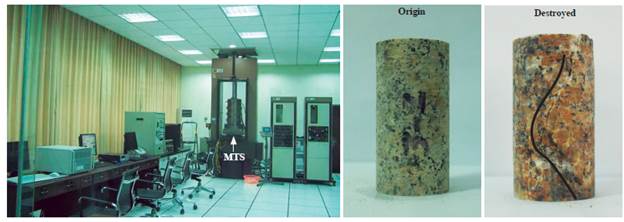
The Zhamunong Gully is located in the northwest region of the Namcha Barwa Peak and is on the left bank of the Yigong Zangbo River (Fig. 2a). Topographic variations are acute along the western and eastern margin, forming an alpine landform. The basin area is 29.4 km2. The highest and lowest altitudes are 5616.00 m and 2185.72 m, respectively. The relative relief is 3430.28 m. The average gradient is 233 %o, and the largest gradient is 646 %o. The regional climate is relatively warm with an average temperature of 6°C~17°C and a mean disproportionate annual precipitation of 1225.8 mm. The precipitation curve is shaped like a double peak (referring to the months of May-June and August-September). The lithology from north to south are Himalayan granite (outcrop altitude elevation between 4100 m-5616 m), limestone, slate and marble of the Carboniferous system (outcrop altitude elevation between 2800 m-4100 m), and gneiss and schist of the Gangdese group from the pre-Sinian system (outcrop altitude elevation between 2198 m-2800 m). The Zhamunong Gully is crossed by three fault zones (Fig. 2b), which are the Jiali Deep Fault Zone (F 1 ), the Dade-Anizha Fault (F 22 ), and the Danen-Zepu Fault (F 3), where the seismic activity of the Jiali Fault is comparatively frequent with the occasional occurrence greater than Ms 6 earthquakes (Lee et al., 2003; Song et al., 2013)
Methodology
Standard Precipitation Index (SPI) and Effective Peak Acceleration (EPA) calculation methods
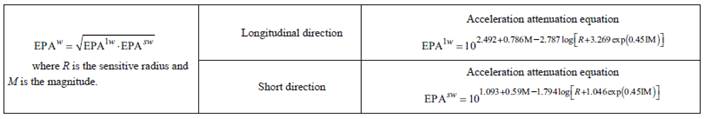
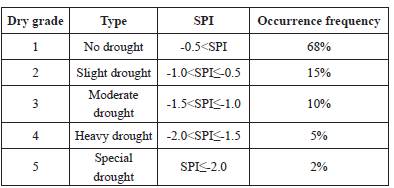
We estimate the influence of earthquakes by using EPA method in Table 1. The Yigong landslide is within Western China, therefore, the model for computing the EPA is based on the empirical model between earthquakes and seismic acceleration in Western China (Wang and Shi, 1993, Yu and Gao, 2001). The drought grade shown in Table 2 is based on the SPI (Chen et al., 2014).
Fast Fourier transform
A fast Fourier transform (FFT) is an algorithm that samples a signal over a period of time (or space) and divides it into its frequency components (Mccubbine et al., 2017). FFT analysis converts a signal from its original domain to a representation in the frequency domain. The parameters of frequency, amplitude, and peak ground parameters (such as acceleration and displacement) are transformed from the seismic wave based on the Seismosignal software from the website of https://www.seismosoft.com/seismosignal-prod.
Landslide stability
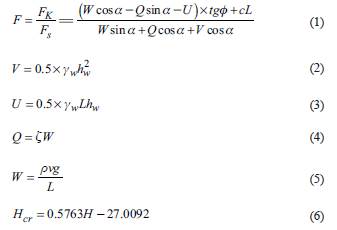
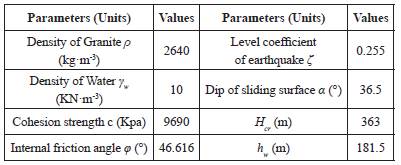
The calculation equation for the locking section length of a landslide is shown in Equation 1. Equations 2-6 are the detailed calculation equations of every force in Equation 1. In Equations 1-6, F is the stability coefficient of the landslide; F=1 is a critical stable state of landslide (that is, the landslide is near sliding when F=1); F K is the anti-sliding force, in KN/m; F S is the sliding force, in KNm-1; c is the cohesion force of the rock mass in the sliding surface of the landslide, in Kpa; φ is the internal friction angle of the rock mass in the sliding surface of the avalanche mass, in °; L is the length of the locking section (the non-perforated length of the landslide's fissure surface), in m; V is the fissure water pressure, in KN m-1; U is the uplift pressure along the slip surface, in KN m-1; Q is the earthquake force, in KN m-1; Z is the level coefficient of the earthquake; a is the dip of the sliding surface; W is the weight of the landslide, in KN m-1; p is the density of granite rock masses, in kgm-3; v is the volume of landslide, in m3; g is the acceleration of gravity; h is the depth of the fissure in the trailing edge, inm; and h w is the water-filling height of the fissure in the trailing edge, in m, which ranges between 0.2 h in natural time and 0.3-0.5 h during a rainstorm. As per rainfall data, there was heavy rainfall before the BH01 landslide happened, so h w is valued 0.5 h. H cr is the depth of the fissure in the landslide's trailing edge, in m. H is the height of the slope from the front of the landslide to the trailing edge of the fissure, in m. The rock mass is comparatively broken at the source of the Zhamunong Gully; the internal friction angle's reduction factor for the BH01 landslide's rock mass is 0.8, and the internal friction angle of the avalanche mass's sliding surface after reduction is 46.616°, according to the Technical Specification for Construction Slope Engineering, China (DB50/330-2002). When the cracking segment of the rock mass in the landslide's trailing edge cracks to 363 m and the front locking section transfixes, the landslide reaches a limit equilibrium state. Table 3 summarizes the calculation parameters.
A MacCormack-TVD finite difference method
The MacCormack-TVD finite difference method proposed by (Ouyang, et al., 2013) can be used to simulate the dynamic process of CLDFs. Therefore, this method is suitable for calculating the discharge of the 2000 CLDF. The boundary condition is the wall boundary condition; the base model is the Coulomb friction model, and the corresponding Coulomb friction coefficient is set as 0.215. The coefficient of earth pressure is set to constant 1. Equations 7-10 based on this method are shown as follows.
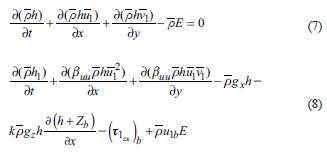
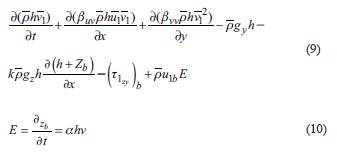
In equations 7-10, x, y, z are the direction of debris flow movement; t is the move time, in s; p is the density of the debris flow, in kg/m3; h is the depth of the debris flow, in m; ¡u
1
and v1 are the velocity of the movement directions xandy, respectively, in m/s;
 and
and
 are the drag base of the movement directions x and y; (g
x
, g
z
) are the gravitational acceleration in the movement directions x and z; β is the momentum distribution coefficient; k is the coefficient of earth pressure; E is the basal erosion rate of the debris flow; v is the point velocity, in m/s; and a is the erosion rate coefficient.
are the drag base of the movement directions x and y; (g
x
, g
z
) are the gravitational acceleration in the movement directions x and z; β is the momentum distribution coefficient; k is the coefficient of earth pressure; E is the basal erosion rate of the debris flow; v is the point velocity, in m/s; and a is the erosion rate coefficient.
The initial and boundary conditions
FLAC numerical simulation method based on the shear strength reduction for calculating future landslide magnitude using parameters from rock mechanics tests
The Fast Lagrangian Analysis of Continua (FLAC) method is suitable for simulating landslide sliding surfaces, so we use this method to estimate the volume of future similar landslides to analyze the tendency of CLDFs. The FLAC numerical simulation method is used for estimating the longitudinal area of potential landslides BH01 and BH02 under extreme conditions (Fig. 3a). The FLAC numerical simulation method is a fast Lagrangian difference method based on shear strength reduction (Jing et al., 2008). The shear strength reduction is expressed by the change of safety coefficient. The actual calculation process of the safety coefficient F s is in Equation 11. The implementation processes of shear strength reduction in FLAC are shown as follows. When some strength reduction coefficient RF is such that the plastic zone of the sliding surface completely transfixes in the computed processes of FLAC, the strength reduction coefficient RF is the value of the safety coefficient Fs. The FLAC method uses the history display of finite difference time. For each time step, the main calculation process is completed by (1) calculating the new strain rate from the node velocity in Equation 12, (2) calculating the stress of the previous step using the constitutive equation through the strain rate in equation 13 and equation 14 and equation 15, and (3) deriving the new node velocity and displacement from the stress and force through the motion equation in equation 16. Each time step repeats the above three steps to monitor the maximum unbalanced force. When the maximum unbalanced force equals a constant, we have estimated the plastic rock masses in the landslide profile. Besides, the initial and boundary conditions of the FLAC method contain the surface force, concentrated load, and displacement boundary, and the physical strength and initial stress conditions also need to be applied. At the beginning of the computer program, all stresses and node velocities are set to zero, and then we apply the initial stress. The concentrated load is assigned to the node on the surface, and the displacement boundary condition is precisely controlled by the velocity of the node. The physical force and the surface force are transformed into a series of equivalent node loads in the interior. The above constitutes the initial state of numerical calculation. Moreover, we considered the earthquake intensity of 5 degrees in the computed process of the FLAC method to simulate the actual seismic situation of Zhamunong gully.
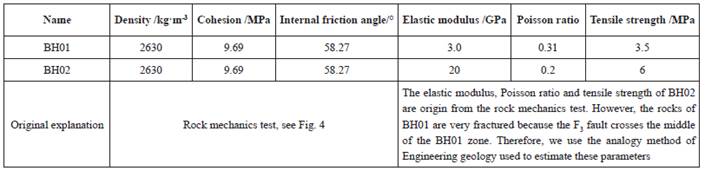
The simulation profiles of the BH01 and BH02 potential landslides are shown in Fig. 3b. The dip angles of the main granite joints are 211° and 163° in the BH01 and BH02 potential landslides, respectively; the granite rock masses with those dip angles easily form slides, so the simulation profile direction is the same as the dip directions. The depths of the BH01 and BH02 potential landslides are obtained using the FLAC numerical simulation method. We use a rock mechanics test to determine the density, cohesion, and internal friction angle, elastic modulus, Poisson ratio, and tensile strength parameters. The test machine is the MTS815 Flex Test GT (Fig. 4). The samples of rock are obtained by drilling, where, for each specimen, Φ=50 mm with a height of 100 mm. There are 12 experiments. The rocks used for 6 reference experiments are air-dried granite rocks, and the rocks for the other experiments are water-saturated granite rocks. The test results from the water-saturated granite rocks represent the actual landslide situation. The rock mass strength parameters of the BH01 and BH02 potential landslides are shown in Table 4. Because the F 3 fault passes directly through the BH01 potential landslide, the rock mass joint and fissures in the BH01 potential landslide are more developmental than in the BH02 potential landslide. The elastic modulus, Poisson ratios and tensile strengths for the BH01 and BH02 potential landslides have different values. We use the analogy method from engineering geology to estimate those parameters for the BH01 potential landslide, while the parameters for the BH02 potential landslide are from the rock mechanics tests.
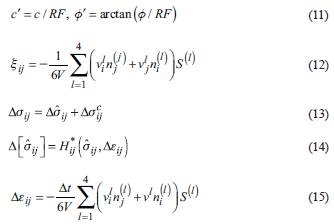
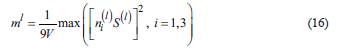
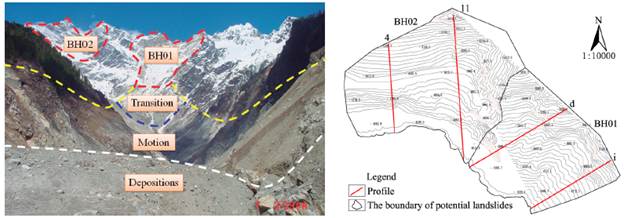
Figure 3 (a) Photos of the BH01 and BH02 potential landslides. (b) Model profiles of the BH01 and BH02 potential landslides.
In equation 11-16, c' and Φ' are the strength parameters after reduction, c and Φ are the strength parameters before reduction, and RF is the strength reduction coefficient. ξ
ij
y is the strain rate, v
il
and V
l
j
are the tetrahedral velocity, V is the volume of tetrahedron, S is the area of tetrahedron, n
i
(l)
is the combined number of tetrahedrons in the element, Δσ
ij
is the stress increment of tetrahedron,
 is the stress correction term, H*
ij
is the incremental constitutive equation, Δε
ij
is the strain rate correction term, m
l
is the quality of tetrahedrons.
is the stress correction term, H*
ij
is the incremental constitutive equation, Δε
ij
is the strain rate correction term, m
l
is the quality of tetrahedrons.
The main controlling factors of the 2000 CLDF
Precipitation, temperature, and earthquakes
Based on the long-term earthquake, precipitation and temperature records, there is a spatiotemporal correlation between the disaster and an M 4.8 earthquake, the wet-dry cycle and the freeze-thaw cycle. To better observe the impacts of drought and the earthquake on the Yigong landslide, the processes of change in the EPA earthquake index and the SPI drought index were analyzed before the disaster using a proper time scale of fifteen years.
Table 4 Calculation parameters for the water-saturated granites in the BH01 and BH02 potential landslides.
The SPI of the Zhamunong Gully for every month between 1990 to 2004 is shown in Fig. 5a. Two months before the CLDF took place on April 9th, 2000, there was a small-magnitude dry-wet cycle in the Zhamunong Gully, with characteristics of a medium drought and slight moderate rainfall. From 1990 to April 9, 2000, the wet-dry cycle often occurred. Over a short time-scale, the precipitation was lower in March, and the SPI was -1.41, which suggests that the weather was in a moderate drought. Precipitation of 62.6 mm in March 2000 was significantly lower than the annual average precipitation of 87.3 mm. From April 1th to 8th after the drought, the precipitation in the early stage reached 42.9 mm, accounting for 49% of the annual average precipitation. This indicates that Zhamunong Gully experienced a strong precipitation event before the disaster. At 8:00:09 on the night of April 9th, 2000, a Ms 4.8 earthquake was recorded at the Linzhi station; the epicenter of this earthquake was 13 km away from the Zhamunong Gully. The seismic acceleration of the landslide in the Zhamunong Gully was 43.3 gal (Fig. 5a), equivalent to a seismic intensity of 5.5. Fissures in the rock masses are well developed in the source basin at elevations of 5250 m, and those rock masses are strongly influenced by the freeze-thaw cycle. The location of the Bomi meteorological station is N29°51.5' and E94°46.1', and the altitude is 2731 m. According to general meteorological principles, the temperature decreases by 0.6 degrees for every 100 m elevation increase. The temperature at 5250 m of elevation is estimated based on the temperature data of the Bomi meteorological station; the temperature results are shown in Fig. 5b. The largest seasonal temperature difference was 25°C, and the largest temperature difference before the disaster took place was 15°C. Moreover, the temperature shows a periodic change in the period from December-January with a low-temperature distribution and a periodic change in June-July with a high-temperature distribution, which illustrates that the impacts of seasonal freezing and thawing on the rock masses are very strong in the Zhamunong Gully.
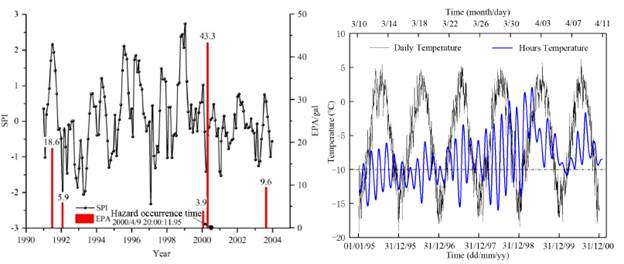
Figure 5 (a) Change in the EPA and SPI in the Zhamunong Gully from 1990 to 2004. (b) The effect of the freeze-thaw cycle in Yigong from Jan. 1st, 1995 to Dec. 31st, 2000. Modified from (Zhou et al., 2016).
Analysis of the main controlling factors
The structural characteristics of the rock masses are the basis for the formation of the 2000 CLDF. There are 3 sets of granite joints at the basin source. The southward-inclined joints with a tendency of 210 degrees coincide with the upstream slope of the basin source, providing an underground seepage channel for precipitation and snow meltwater. The freeze-thaw and dry-wet cycles have a great influence on the porosity compressive strength, elastic coefficient and shear strength of the rock mass. Freeze-thaw and dry-wet cycles accelerate the weathering of the rock mass, and more pores are generated in the granitic rock mass. When meltwater or rainfall enters into rock cracks, the water freezes into ice blocks and enlarges its volume. When the temperature drops below 0°C, the water entering the rock fissures will form ice, and the enlargement of the ice volume will force the crack to deepen and widen. When the temperature rises above 0°C, the ice melts in the rock mass cracks, and water flows into the new cracks, resulting in high pore water pressure in the rock mass, which reduces the shear strength of the rock mass. At 8:00:9.2 on April 9th, a Ms 4.8 earthquake occurred 13 km away from the Zhamunong Gully. The seismic acceleration in the basin source was 43.3 gal. Earthquakes have a topographic amplification effect on the source basin of the landslide. Based on investigations from local people, the water quality became black and the water quantity decreased significantly on April 8th in the Zhamunong Gully, which suggests that the main sliding surface and the steep cracks in the back edge of the sliding zone were fully penetrated, such that the rainwater and meltwater were completely penetrated into the main sliding surface of landslide and the rock masses of the sliding zone were saturated with water. Therefore, it is reasonable to suggest that a recent Ms 4.8 earthquake broke the locked-in section of the landslide.
The dynamic processes and characteristic parameters of the 2000 CLDF in the Zhamunong Gully
Dynamic processes of the 2000 CLDF based on seismic waves
The strong seismic wave generated by the CLDF during its movement was recorded by the neighboring seismic stations (Dammeier et al., 2016). From 20:00 to 20:10 on April 9th, 2000, the Linzhi seismic station recorded the seismic wave generated by the 2000 CLDF in Yigong. Using the fast Fourier transform method to calculate the spectrum of the seismic wave generated by the 2000 CLDF, the largest acceleration of the seismic wave generated by the 2000 CLDF in Yigong was 0.45 g, the largest seismic motion velocity was 0.786 ms-1, the main frequency value and the main power was 2 Hz, and the largest seismic motion amplitude was 64 cm. The spectrum of the Peak Ground Displacement (PGD) is properly used to divide the dynamic processes of the Yigong landslide after the following comparison of each seismic wave spectrum.
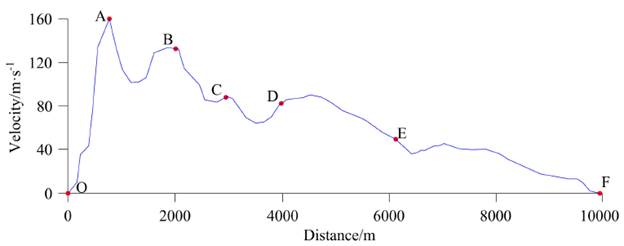
Based on the results of the seismic wave spectrum, the PGD spectrum of the seismic wave shown in Fig. 6 can better show the movement process of this landslide-debris flow. The amplitude at Point O begins to increase significantly, where Point O is the occurrence point of the 2000 CLDF. The time of Point O recorded by the Linzhi seismic station is 20:00:18.87 on April 9th, 2000, and the duration of the seismic wave's transmission is 6.92 s, according to the 13 kms-1 in-ground seismic wave transmission rate. It is therefore inferred that the landslide time is 20:00:11.95. A debris flow moving at a high speed that strikes the bank of bending slope can produce a strong ground vibration phenomenon, which presents as a catastrophe point in the amplitude or acceleration of the seismic wave spectrum. There are 5 impact points during the movement of the 2000 CLDF in Yigong according to the graph of the seismic motion displacement and the remote sensing image. As Fig. 7 shows, the impact point A has an obvious impact mark, and it is the first impact point of the 2000 CLDF. According to the motion mark of the 2000 CLDF, we can judge that point B is the impact point of the debris low. The debris low shows an obvious improvement at the impact points C, D, and E, which shows that the debris low was hindered by three apparent places in the valley.
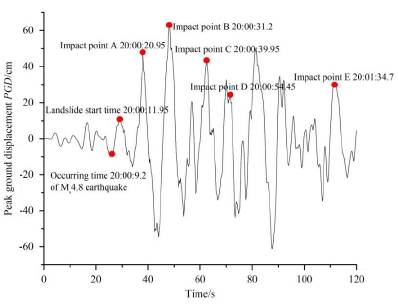
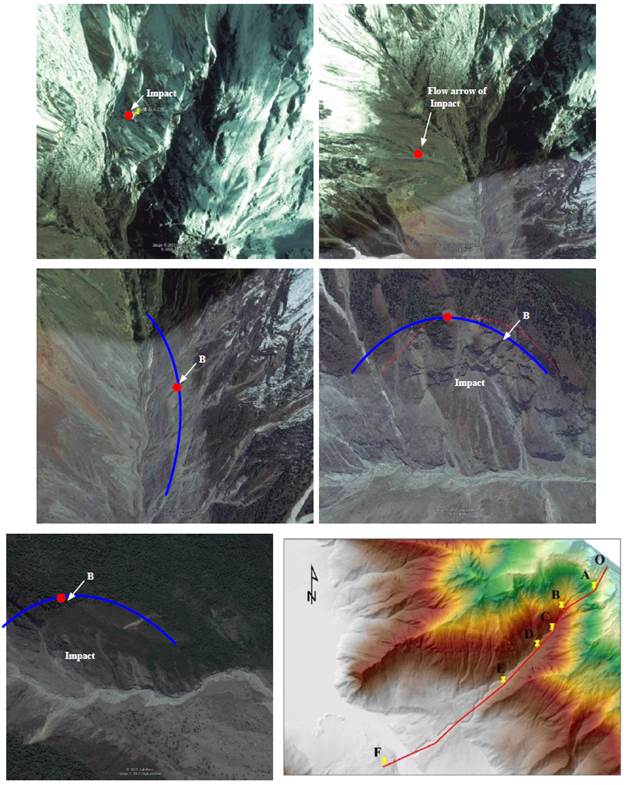
Figure 7 a-e are the remote sensing images of impact points A-E of the 2000 CLDF; (f) is the landside trace image from start to end. The remote sensing images are from the time of February, 22th, 2015.
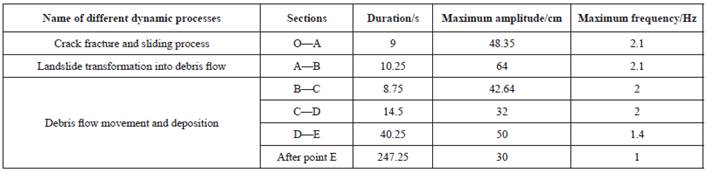
According to the seismic wave and based on the movement patterns of the 2000 CLDF, the four dynamic landslide processes are (1) joint and crack development in the landslide, (2) the process of crack fracture and sliding, (3) the landslide translation into a debris low, and (4) debris low movement and deposition. The dynamic processes of the latter three segments have clear surface vibration characteristics (Table 5). The dynamic process of O-A is joint and crack development in the landslide. The large amplitude and high-frequency characteristics were revealed during the crack fracture and sliding process of the landslide, with a maximum amplitude and frequency of 48.35 cm and 2.1 Hz, respectively. As debris flow energy increases, the amplitude is large, and the maximum amplitude of section B is 64 cm during the dynamic process of the landslide becoming a debris low (A-B). Because the debris low hit the mountain at the bend, the amplitude and frequency are high in the dynamic processes B-C of the debris low movement, with a maximum amplitude of 42.64 cm and a frequency of 2.0 Hz. Because the bend in the channel is large during the dynamic processes D-E of debris low movement, the amplitude of the wave increases to a maximum amplitude of 50 cm, but the frequency is reduced to 1.4 Hz. The debris flow was deposited gradually, and the impact of the debris low on the ground gradually weakened after the mountain-pass section. Therefore, the amplitude of the wave decreases to 30 cm and the frequency decreases to 1.0 Hz in the dynamic process of debris flow deposition.
Process of joint and crack development in the landslide
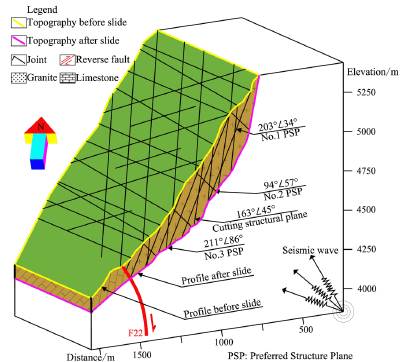
According to the terrain and wedge shape, the landslide elevation ranged between 4500 m and 5320 m. Before sliding, the landslide was one of the main peaks in the basin, covered by ice and snow year-round. After sliding, the bottom of the landslide appears as a “V”-type hanging gully. The sides of the landslide are steep and smooth. The angle of the gully slope is 40-50 degrees, the channel slope is 25 degrees, and the direction of channel trends to the SW. The trailing edge of the landslide is nearly a vertical cliff, and the granite rock mass is smooth. The NE-trending faults parallel to the lateral landslide wall are developed on both sides of the gully, and they form an “X”-type landslide foundation with good connectivity. During the process of the formation of the landslide, the joints and fissures in the granite are well developed due to the influence of regional tectonics in the Zhamunong Gully. There are three groups of large joints shown as follows (Fig. 8). The attitude of the No. 1 preferred structure plane (PSP) is 203 ∠ 34º, and the attitudes of the No. 2 PSP and No. 3 PSP are 94 ∠ 57º and 211 ∠ 86º, respectively. Those joints fractured the rock mass of the landslide. In particular, the No. 3 PSP controlled the development of the steep cracks at the back of the landslide. The development of the slip surface was controlled by the No. 1 PSP. Under the influence of earthquakes and the freeze-thaw and dry-wet cycles, the joints develop and fracture only partially.
On April 8th, 2000, the amount of water decreased significantly and the water quality was significantly blackened in the Zhamunong Gully. The amount and color of the water demonstrate that the boundaries of the landslide bed (the two main sliding surfaces and the steep fractures of the trailing edge) were basically connected. The precipitation and snowmelt water had completely penetrated into the landslide bottom.
Crack fracture and sliding process
Length of the locking section of the crack
According to equation (1), when the length of the locking section L=455 m (Table 6), the landslide is in a state of critical stability. When the trailing edge and front edge of landslide crack more, the length of the rock mass's locking section L<455 m or the depth of the cracking segment in trailing edge H cr >363 m, the landslide will slide.

Crack fracture and sliding process
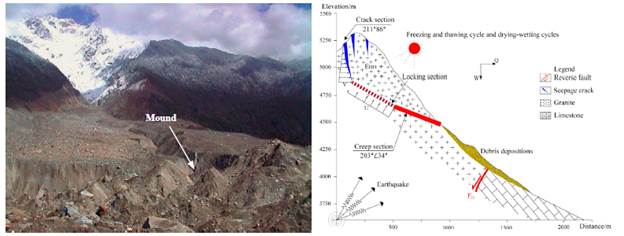
The frontal mound deposits were moved from the top of the basin source because only the top of the basin source had the granite rock masses. Those mound deposits had many ice-containing muds (Fig. 9a), suggesting that the granite rock masses were strongly inluenced by the long-term freeze-thaw and dry-wet cycles. There are many cracks in the granite rock masses at the top of the basin. According to a rock mechanics test and the landslide stability calculation results, under the combined effect of many conditions, such as a quick cutting of the valley in the Yigong region, earthquakes, temperature changes, and continuous rainfall, a high-angle fissure in the trailing edge of landslide develops quickly and continuous creeping deformation occurs in the landslide along the weak structural plane or fracture surface, forming a mid 'locking section'. The locking section is a geological structure that has a high bearing capacity and stress concentration in the potential sliding surface of the slope. The natural locking segment usually has large-scale and lat geometry and bears extremely slow shear loading or stress corrosion. The continuous creeping deformation of the avalanche mass leads the rock mass to further decline in strength, including the high-angle fissure in Table 6, the trailing edge and the front slow-inclined fracture surface. The landslide is driven by a force toward the slope under the action of high pore-water pressure before the landslide is generated, which can be indicated by a strong rainfall process from April 1 to April 9 and the color of the water turned black and the water quantity decreased significantly on April 8. The residual locking section on the structure surface of the BH01 landslide was close to being sheared off by a huge thrust force and an uplift force, and the softening of water causes the main sliding surface. The final locking section of 455 m was eventually ruptured by the Ms 4.8 earthquake, and then the landslide occurred (Fig. 9b).
Landslide translation into a debris flow, and the movement and deposition of the debris flow
Before sliding, the debris deposits were gradually saturated under the infiltration of snowmelt water and precipitation. The tremendous impact force from the landside impact on the gully wall occurred instantly. The bottom of the loose deposit liquefied, the shear strength of the landslide decreased, and the resistance of the landslide decreased due to liquefaction from the high-speed ring shear tests (Hu et al., 2015). Therefore, the landslide moved at a higher average speed of 120.98 m/s. The landslide material was mainly gravel and rock debris. When these high-density materials rushed out of the narrow gully into a wider gully, the landslide materials mixing with air were transformed into a debris flow, which moved at a high speed. The high-speed debris flow gradually silts away in the wide gully after it has rushed out of the mountain mouth.
Characteristic parameters of the dynamic processes
Density
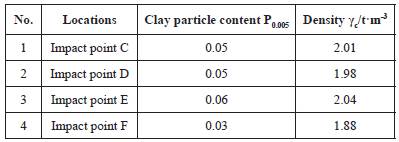
We collected 4 particle samples of the 2000 CLDF in 2004, which were not influenced by precipitation. The distribution curve of the particle size of the 4 samples was obtained by a sieving test. The densities of the 4 deposits are calculated using the equation given by (Li and Chen, 2018). An average density of 1.97 tm-3 for the 2000 CLDF is calculated by averaging the densities of the different locations in Table 7.
Velocity
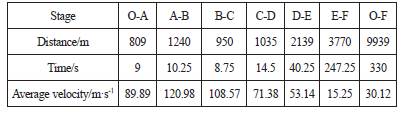
The average velocity of the 2000 CLDF is estimated based on the time interval of the seismic waves and the distance between each impact point (Table 8). The average velocity of the 2000 CLDF is 30.12 m·s-1, the starting speed of the landslide in the O-A section is 89.89 m·s-1, and the average velocities of stages A-B, B-C, C-D, D-E, and E-F are 120.98, 108.57, 71.38, 53.14 and 15.25 m·s-1, respectively. The average velocity calculated by the seismic wave is similar to the velocity process computed by the Massflow software (Fig. 10), indicating the seismic wave can be used to predict the dynamic parameters of similar CLDF.
Discharge
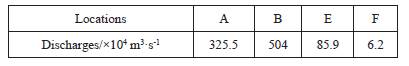
A two-dimensional mountainous mass flow dynamic procedure solver (Massflow-2D) is based on the theory of continuum mechanics of depth integration using the improved MacCormack TVD finite difference method. The Massflow software has a high-efficiency calculation, and it can simulate mountain disaster dynamics, it considers the complex topography with the characteristics of second-order accuracy and adaptive solution domain. Therefore, the flow process of the 2000 CLDF was simulated by the Massflow software (Ouyang et al., 2013, Ouyang et al., 2015). The discharge of the debris flow is 504x104 m3s-1. The discharges at impact points E and F are 85.9x10⁴ m3s-1 and 7.8>104 m3s-1, respectively. The discharge processes of the 2000 CLDF first increased and then decreased, and the maximum discharge of the 2000 CLDF was 504>104 m3s-1, which occurred at the second impact point B. The different discharge locations of the 2000 CLDF are shown in Table 9.
The tendency for CLDFs in the Zhamunong Gully
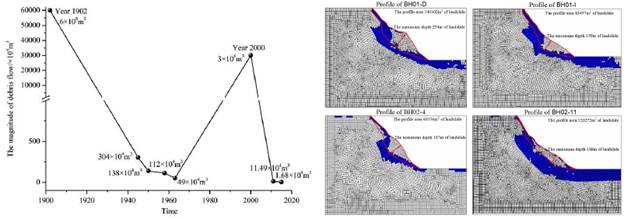
Based on the detailed internal and external landslide investigation presented in the current study, a CLDF can be predicted in the Zhamunong Gully. The smaller debris flows occurring after the CLDF disaster will decrease year by year. (1) An analysis of historical disasters shows that there is a possibility of CLDF disasters recurring. As shown in Fig. 11a, the scale of the debris flow fluctuates in the Zhamunong Gully. The scale of debris flows from 1902 and 2000 are 6.04>108 m3 and 3>108 m3, respectively. After two peaks, the scale of the disasters decreased year by year. The scale of debris-flow processes shows that a CLDF may occur in the future in the Zhamunong Gully. (2) The FLAC numerical simulation shows that plastic rock masses exist in the top of the basin; these are the material basis for the occurrence of CLDFs. Under a middle magnitude earthquake and extreme precipitation, the source rock masses undergo plastic deformation in the Zhamunong Gully, and the potential sliding surfaces of BH01 and BH02 are shown in Fig. 11b. The plastic rock masses show that the CDLF may happen again in the future. Therefore, we estimate the average area of BH01 to be 111879.5 m2, and its width and volume are 822.07 m and 0.92>108 m3, respectively. Similarly, the average area of BH02 is 100314 m2, while the width of BH02 is 935.30 m and the volume of BH02 is 0.94>108 m3. (3) Regional tectonics, earthquakes, and an extreme climate can activate CLDF disasters in the Zhamunong Gully. GPS measurements show that India and Southern Tibet converge at a rate of 20.3 mm/a, and approximately 80% of the convergence is absorbed by a 50 km-wide deformation zone centered on the southern edge of the Tibetan Plateau (Larson et al., 1999). Under the intense compression of the Himalayan tectonic movement, large landslides have formed in the Yigong region. The Yigong region has a large number of faults. Frequent seismicity occurs in this region with a high seismic intensity. The rock masses continue to accumulate energy generated by earthquakes. Extreme climatic events occur frequently, and precipitation is abundant in the Yigong region. The maximum rainfall in one hour in the past four years is 92.5 mm. In the past 60 years, the annual mean temperature has been increasing year by year, and the glacier in the source basin is gradually shrinking. In conclusion, the source of the rock masses can release significant elastic energy under earthquake and extreme climate conditions, and a large number of fragmented loose material sources slide along the steep terrain, thus forming a CLDF.
Conclusions
The conclusions contain three parts, which are stated as follows:
(1) The main controlling factors of the 2000 CLDF were the long-term freeze-thaw and dry-wet cycles and a middle magnitude earthquake. The impact of Ms 4.8 earthquake cannot be neglected for the occurrence of 2000 CLDF.
There is a coupled relationship between the occurrence of the 2000 CLDF, the earthquake, the freeze-thaw cycle, and the dry-wet cycle. From March to April 9th, 2000, a small-scale dry-wet cycle occurred in the Zhamunong Gully. The rock masses of BH01 landslide was saturated under the long-term freeze-thaw and dry-wet cycle conditions. Therefore, the BH01 landslide occurred at 8 pm and 11.95 seconds on 9th April 2000. A middle magnitude earthquake of Ms 4.8 occurred approximately 13 km away from the Zhamunong Gully at 8 pm and 9.2 seconds on 9th April 2000. The top rock masses obtained 43.3 gals of seismic acceleration. Under the influence of the Ms 4.8 earthquake, the BH01 landslide occurred.
(2) Based on the ground vibration spectrum recorded by the Linzhi seismic station, there were four dynamic processes of the 2000 CLDF, including the process of joint and crack development in the landslide, the crack fracture and sliding process, the process of landslide translation into a debris low, the movement and deposition of the debris low. The boundary and magnitude of the BH01 landslide were controlled by the joints in the granite rock masses. The landslide was saturated under the long-term freeze-thaw and dry-wet cycles before the disaster. The crack fracture and slide process of the 2000 CLDF was revealed by a 'creep-tensile-shear' failure model. The attenuation of seismic activity and the strength of the granite rock mass led to the landslide occurring along cracks. The Ms 4.8 earthquake may have ruptured the final 455 m locking sections, and then the landslide occurred. The density of the 2000 CLDF was 2.0 t-m-3, the starting velocity was 89.89 m-s-1, the average velocity was 30.12 m-s-1, and the discharge shape of the 2000 CLDF first increased and then decreased. The maximum discharge of the 2000 CLDF was 504>104 m3-s-1, which occurred in the second impact section.
(3) A CLDF may occur in the Zhamunong Gully in the future. The smaller debris lows occurring after the CLDF will decrease year by year.

