SciELO - Scientific Electronic Library Online

 
vol.24 número1Complex Failure Simulation of Underinclined Shale Slope Based on Discrete Element MethodEstimation of GPS L2 signal observables using Multilayer Perceptron Artificial Neural Network for positional accuracy improvement índice de autoresíndice de assuntospesquisa de artigos
Home Pagelista alfabética de periódicos  

Serviços Personalizados

Journal

Artigo

Indicadores

Links relacionados

  • Em processo de indexaçãoCitado por Google
  • Não possue artigos similaresSimilares em SciELO
  • Em processo de indexaçãoSimilares em Google

Compartilhar


Earth Sciences Research Journal

versão impressa ISSN 1794-6190

Earth Sci. Res. J. vol.24 no.1 Bogotá jan./mar. 2020

https://doi.org/10.15446/esrj.v24n1.85366 

Original Articles

Group Velocity Measurements of Earthquake Rayleigh Wave by S Transform and Comparison with MFT

Mediciones de la velocidad de grupo de las ondas sísmicas Rayleigh mediante la transformada S y comparación con la Técnica de Filtrado Múltiple (MFT)

Chanjun Jianga  b  c 

Youxue Wanga  b  * 

Gaofu Zengd 

a School of Earth Science, Guilin University of Technology, Guilin 541006, China.

b Guangxi Key Laboratory of Hidden Metallic Ore Deposits Exploration, Guilin 541006, China.

c Bowen College of Management, Guilin University of Technology, Guilin 541006, China.

d China Nonferrous Metals (Guilin) Geology and Mining Co,. Ltd, Guilin 541006, China.


ABSTRACT

Based upon the synthetic Rayleigh wave at different epicentral distances and real earthquake Rayleigh wave, S transform is used to measure their group velocities, compared with the Multiple Filter Technique (MFT) which is the most commonly used method for group-velocity measurements. When the period is greater than 15 s, especially than 40 s, S transform has higher accuracy than MFT at all epicenter distances. When the period is less than or equal to 15 s, the accuracy of S transform is lower than that of MFT at epicentral distances of 1000 km and 8000 km (especially 8000 km), and the accuracy of such two methods is similar at the other epicentral distances. On the whole, S transform is more accurate than MFT. Furthermore, MFT is dominantly dependent on the value of the Gaussian filter parameter a , but S transform is self-adaptive. Therefore, S transform is a more stable and accurate method than MFT for group velocity measurement of earthquake Rayleigh waves.

Keywords: Earthquake Rayleigh waves; group velocity; S transform; Multiple Filter Technique

RESUMEN

Con base en ondas sintéticas Rayleigh a diferentes distancias epicentrales y en ondas sísmicas Rayleigh reales, en este trabajo se emplea la transformada S para medir la velocidad de grupo de este tipo de ondas y se compara con la Técnica de Filtrado Múltiple (MFT, por sus siglas del inglés, del nomre Múltiple Filter Technique), que es el método más utilizado para las mediciones de velocidad de grupo. Cuando el periodo es mayor a 15 s, especialmente de 40 s, la transformada S tiene mayor precisión que MFT, para todas las distancias epicentrales. Cuando el periodo es menor o igual a 15 s, la precisión de la transformada S es menor que MFT para distancias epicentrales de 1000 km y 8000 km (especialmente 8000 km). La precisión de estos dos métodos es similar para otras distancias epicentrales. En general, la transformada S es más precisa que MFT. Además, MFT depende predominantemente del valor del parámetro de filtro gaussiano a, pero la transformada S es autoadaptativa. Por lo tanto, la transformada S es un método más estable y preciso que MFT para la medición de la velocidad de grupo de las ondas sísmicas Rayleigh.

Palabras clave: Ondas sísmicas Rayleigh; velocidad de grupo; transformada S; Técnica de Filtrado Múltiple (MFT)

Introduction

Earthquake surface wave tomography has become a powerful tool to image the deep structures of the crust and upper mantle due to its dispersion characteristics. Measuring high-quality group velocities or phase velocities of surface wave, such as Rayleigh wave, is a key foundation for surface wave tomography. Currently, there are some methods to measure group velocities of surface wave, such as Moving Window Analysis (MWA) (Landisman et al., 1969), Multiple Filter Technique (MFT) (Dziewonski et al., 1969) and Continuous Wavelet Transform (CWT) (Jiang et al., 2017), of which MFT is the most commonly used one (Ritzwoller & Levshin, 1998; Zhu et al., 2002; Huang et al., 2003; Cho et al., 2007; Li et al., 2009; Saygin & Kennet, 2010; Rindraharisaona et al., 2017; Tang et al., 2018; Lu et al., 2018; Mechie et al., 2019).

In 1969, MWA was proposed by Landisman et al. using rectangular window in time domain. In the same year, MFT was presented by Dziewonski et al. using Gaussian filter in frequency domain. When taking Gaussian filter instead of rectangular window in time domain, MWA is equivalent to MFT in frequency domain. MFT, a commonly used method, is dominantly dependent on the value of Gaussian filter parameter a, and much research has been done (Inston et al., 1971; Cara, 1973; Nyman & Landisman, 1977; Herrmann & Ammon, 2004; Kolinsky, 2004; Zhu et al., 2007; Chen et al., 2014; Jiang et al., 2019). Especially, Herrmann and Ammon (2004) gave recommended values of Gaussian filter parameter a with distance variation when the period is from 4 s to100 s. CWT was used to measure group velocities of earthquake Rayleigh wave, compared to MFT (Jiang et al., 2017).

In 1996, S transform was proposed by Stockwell et al., which is an extension of CWT based on Morlet wavelet (Stockwell et al.,1996). S-transform combines advantages of short-time Fourier transform (STFT) and wavelet transform (WT). For instance, inverse S transform is directly related to Fourier transform and it is a lossless transformation, linear transformation has no cross-term and high time-frequency resolution, the time-frequency resolution is related to the frequency of the signal, and the basic wavelet need not satisfy the admissibility condition (Pinnegar & Mansinha, 2003a, 2003b; Zheng & Wang, 2015). In recent years, S-transform has been widely used in geophysics (Pinnegar & Eaton, 2003, 2006; Askari & Siahkoohi, 2008; Parolai, 2009; Askari et al., 2011; Tselentis et al., 2012; Askari & Ferguson, 2012; Tu et al., 2013; Zheng & Wang, 2015). In this paper, S transform is introduced to measure group velocities of earthquake Rayleigh wave and is compared with the commonly used MFT.

S transform

If x(t) is a surface wave signal generated by natural earthquake, then the S transform of x(t) is defined as

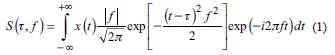
where t is time, t is the central point of the window function and can control the position of window function along time axis, and f is frequency. In S transform, Gaussian function and basic wavelet are respectively defined as

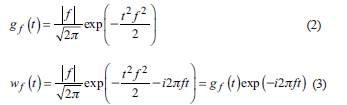
The basic wavelet in S-transform is the product of simple harmonics only scaled in time domain and Gauss function scaled and shifted. Time window width of S-transform varies inversely with frequency, i.e. the time window is wider in low frequency band, which leads to higher frequency resolution, while the time window in high frequency band is narrower, which leads to higher time resolution. Therefore S transform is self-adaptive.

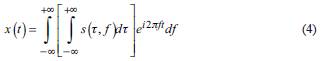
Inverse S transform is written as

Comparison with MFT

At present, MFT is the most commonly used method to measure group velocities of earthquake Rayleigh wave. Based upon the synthetic Rayleigh wave at different epicentral distances and real earthquake Rayleigh wave, S transform is compared with MFT.

MFT

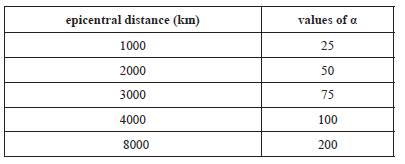
Choosing appropriate value of Gauss filter parameter α can reduce the group-velocity measurement error of surface wave. The recommended values of α with epicentral distance variation in the period range from 4 s to 100 s given by Herrmann and Ammon (2004) are listed in Table 1, in which the value of α at epicentral distance of 3 000 km is originally not available but is obtained by interpolation of the values at epicenter distances of 2 000 km and 4 000 km.

Table 1 Values of Gaussian filter parameter α 

Synthetic Rayleigh waves

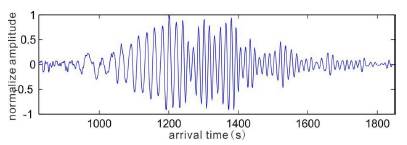
In order to check the effectivity of S transform in the measurement of group velocities and compare S transform with MFT, synthetic data of Rayleigh waves were generated by modal summation method (Herrmann & Ammon, 2004) based upon AK135 earth model (Kennett et al., 1995), and the source parameters are listed in Table 2. There are five stations with epicentral distances of 1 000 km, 2 000 km, 3 000 km, 4 000 km and 8 000 km, respectively. The azimuth angles of such stations are 45° and the sampling interval of data is 1 s. Synthetic seismogram of Rayleigh wave at epicentral distance of 3000 km and its amplitude spectra are shown in Figure 1.

Table 2 The source parameters 

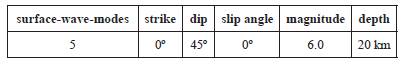
Figure 1 Synthetic seismogram of Rayleigh wave at distance of 3000 km (a) and its amplitude spectra (b) 

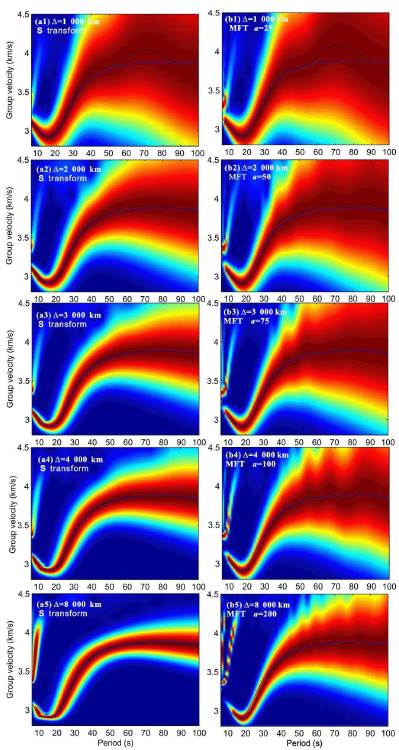
And then S transform and MFT are respectively applied to measure group velocities of the synthetic data . From the results by such two methods (Fig. 2), the following conclusions can be drawn:

  • 1) when the epicentral distance is 1 000 km, the accuracy of group-velocity curve obtained by S-transform is slightly lower than that by MFT in the period range of less than or equal to 15 s but much higher in the other period range, in the period range of greater than 40 s group-velocity curves measured by S transform and MFT both have large error and therefore the period to be measured should not be large when the epicentral distance is small;

  • 2) when the epicentral distance is 2 000 km, 3 000 km or 4 000 km, the accuracy of group-velocity curve obtained by S-transform is similar as that by MFT in the period range of less than or equal to 15 s but much higher in the other period range, especially when the period is greater than 40 s the group-velocity curve obtained by MFT fluctuates obviously and has large error with the theoretical one while that by S transform fits well with the theoretical one;

  • 3) when the epicentral distance is 8 000 km, the accuracy of group-velocity curve obtained by S-transform is lower than that by MFT in the period range of less than or equal to 15 s but higher in the other period range. On the whole, the group-velocity curve gained by S transform fits better with the theoretical one than MFT, therefore its accuracy is higher than that of MFT.

Figure 2 Comparison between S transform and MFT based on synthetic data  

Real earthquake Rayleigh wave

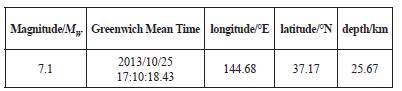
The real seismogram of earthquake Rayleigh wave acquired from mobile station in Guangxi of China is shown in Fig. 3 and the parameters of the earthquake event are listed in Table 3. The coordinates of the station are (110.50°E, 24.09°N) and epicentral distance is 3 551.22 km. For MFT, the value of Gauss filter parameter a at such epicentral distance is 87.5 by interpolation (Table 1).

Figure 3 Real seismogram of earthquake Rayleigh wave acquired in Guangxi of China. 

Table 3 Parameters of the earthquake event 

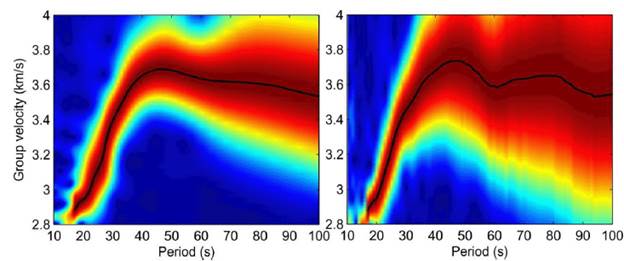
Then S transform and MFT are respectively applied to measure group velocities of such real data and the results are shown in Fig.4. Overall the group-velocity curves obtained by S transform and MFT are similar. But when the period is greater than 40 s, the group-velocity curve obtained by MFT fluctuates obviously while the curve by S transform is much smoother, hence S transform is more reliable than MFT.

Figure 4 Comparison between S transform and MFT based on real data 

Conclusions

In this paper, based upon the synthetic Rayleigh wave at different epicentral distances and real earthquake Rayleigh wave, the group velocities are measured by CWT and MFT respectively. From the analysis and comparison, the conclusions can be drawn generally as following:

  • 1) when the epicentral distance is small, such as 1 000 km, in the period range of greater than 40 s group velocities measured by S transform and MFT both have large error and are both not reliable and therefore the period to be measured should not be large in such case;

  • 2) when the period is greater than 15 s, S transform has higher accuracy than MFT at all epicenter distances, especially when the period is greater than 40 s the group-velocity curve obtained by MFT fluctuates obviously and its accuracy is much lower than that by S transform;

  • 3) when the period is less than or equal to 15 s, the accuracy of S transform is lower than that of MFT at epicental distances of 1000 km and 8000 km (especially 8000 km), and the accuracy of such two method is similar at the other epicental distances.

On the whole, S transform is more accurate than MFT. Furthermore, MFT is dominantly dependent on the value of the Gaussian filter parameter a, but S transform is self-adaptive. Therefore, S transform is a more stable and accurate method than MFT for group velocity measurement of earthquake Rayleigh waves.

Acknowledgment

Funded by project 41574039 from NSF, Key project 2016GXNSFDA380014 from Guangxi Scientific Foundation and project 2018KY0857 from Guangxi Education Department.

References

Askari, R., Ferguson, R. J., & DeMeersman, K. (2011). Estimation of phase and group velocities for multi-modal ground roll using the 'phase shift' and 'slant stack generalized S transform based' methods. CREWES Research Report, 23, 1-11. [ Links ]

Askari, R., & Ferguson, R. J. (2012). Dispersion and the dissipative characteristic of surface waves in the generalized S-transform domain. Geophysics, 77(1), V11-V20. [ Links ]

Askari, R., & Slahkoohi, H. R. (2008). Ground roll attenuation using the S and x-f-k transforms. Geophysical Prospecting, 56(1), 105-114. [ Links ]

Cara, M. (1973). Filtering of dispersed wavetrains. Geophysical Journal of the Royal Astronomical Society, 33(1), 65-80. [ Links ]

Cho, K. H., Herrmann, R. B., Ammon, C. J., & Lee, K. (2007). Imaging the upper crust of the Korean Peninsula by surface-wave tomography. Bulletin of the seismological Society of America, 97(1B), 198-207. [ Links ]

Dziewonski, A., Bloch, S., & Landisman, M. (1969). A technique for the analysis of transient seismic signals. Bulletin of the Seismological Society of America, 59(1), 427-444. [ Links ]

Herrmann, R. B., & Ammon, C. J. (2004). Computer Programs in Seismology, 3.30[CP/OL]. http://www.eas.slu.edu/eqc/eqccps.htmlLinks ]

Huang, Z., Su, W., Peng, Y., Zheng, Y., & Li, H. (2003). Rayleigh wave tomography of China and adjacent regions. Journal of Geophysical Research: Solid Earth, 108(B2). [ Links ]

Inston, H. H, Marshall, R D, & Blarney, C. (1971). Optimization of filter bandwidth in spectral analysis of wavetrains. Geophysical Journal of the Royal Astronomical Society, 23(2), 243-250. [ Links ]

Jiang, C. J., Wang, Y. X., Xiong, B., & Wang, H. Y. (2019). Measurements of surface-wave group velocity using MFT and the value of Gaussian filter parameter. Journal of Guilin University of Technology, 39(2). [ Links ]

Jiang, C. J., Wang, Y. X., Xiong, B., Yun, P., Xu, J. R., & Nai, Z. L. (2017). Measurement of surface wave group velocity using wavelet transform. Acta Seismologica Sinica, 39(3), 356-366. [ Links ]

Kennett, B. L. N., Engdahl, E. R., & Buland, R. (1995). Constraints on seismic velocities in the Earth from traveltimes. Geophysical Journal International, 122(1), 108-124. [ Links ]

Kolinsky, P. (2004). Surface wave dispersion curves of Eurasian earthquakes: the SVAL program. Acta Geodynamica et Geomaterialia, 1(2), 165-185. [ Links ]

Landisman, M., Dziewonski, A., & Sato, Y. (1969). Recent improvements in the analysis of surface wave observations. Geophysical Journal of the Royal Astronomical Society, 17(4), 369-403. [ Links ]

Li, H., Su, W., Wang, C. Y., & Huang, Z. (2009). Ambient noise Rayleigh wave tomography in western Sichuan and eastern Tibet. Earth and Planetary Science Letters, 282(1-4), 201-211. [ Links ]

Lu, Y., Stehly, L., & Paul, A. (2018). High-resolution surface wave tomography of the European crust and uppermost mantle from ambient seismic noise. Geophysical Journal International, 214(2), 1136-1150. [ Links ]

Mechie, J., Schurr, B., Yuan, X., Schneider, F., Sippl, C., Minaev, V., Gadoev, M., Oimahmadov, I., Abdybachaev, U., Moldobekov, B., & Orunbaev, S. (2019). Observations of guided waves from the Pamir seismic zone provide additional evidence for the existence of subducted continental lower crust. Tectonophysics, 762, 1-16. [ Links ]

Nyman, D. C., & Landisman, M. (1977). The display-equalized filter for frequency-time analysis. Bulletin of the Seismological Society of America, 67(2), 393-404. [ Links ]

Parolai, S. (2009). Denoising of seismograms using the S transform. Bulletin of the Seismological Society of America, 99(1), 226-234. [ Links ]

Pinnegar, C. R., & Eaton, D. E. (2003). Application of the S transform to prestack noise attenuation iltering. Journal of Geophysical Research, 108(B9). [ Links ]

Pinnegar, C. R., & Mansinha, L. (2003a). The S-transform with windows of arbitrary and varying shape. Geophysics, 68(1), 381-385. [ Links ]

Pinnegar, C. R., & Mansinha, L. (2003b). The bi-Gaussain S-transform. SIAM Journal on Scientific Computing, 24(5), 1678-1692. [ Links ]

Pinnegar, C. R. (2006). Polarization analysis and polarization filtering of three-component signals with the time-frequency S transform. Geophysical Journal International, 165(2), 596-606. [ Links ]

Rindraharisaona, E. J., Tilmann, F., Yuan, X., Rumpker, G., Giese, J., Rambolamanana, G., & Barruol, G. (2017): Crustal structure ofsouthern Madagascar from receiver functions and ambient noise correlation: Implications for crustal evolution. Journal of Geophysical Research: Solid Earth, 122(2), 1179-1197. DOI:10.1002/2016JB013565. [ Links ]

Ritzwoller, M. H., & Levshin, A. L. (1998). Eurasian surface wave tomography: Group velocities. Journal of Geophysical Research: Solid Earth, 103(B3), 4839-4878. [ Links ]

Saygin, E., & Kennett, B. L. N. (2010). Ambient seismic noise tomography of Australian continent. Tectonophysics, 481(1-4), 116-125. [ Links ]

Stockwell, R. G., Mansinha, L., & Lowe, R. P. (1996). Localization of the Complex Spectrum: the S Transform. IEEE Transactions on Signal Processing, 44(4), 998-1001. [ Links ]

Tang, Z., Mai, P. M., Chang, S. J., Zahran, H. (2018). Evidence for crustal low shear-wave speed in western Saudi Arabia from multi-scale fundamental-mode Rayleigh-wave group-velocity tomography. Earth and Planetary Science Letters, 495, 24-37. [ Links ]

Tselentis, G., Martakis, N., Paraskevopoulos, P., Lois, A., & Sokos, E. (2012). Strategy for automated analysis of passive microseismic data based on S-transform, Otsu's thresholding, and higher-order statistics. Geophysics, 77(6), KS43-KS54. [ Links ]

Tu, R., Wang, R. J., Zhang, Y., Ge, M., & Zhang, Q. (2013). Real-time coseismic velocity and displacements retrieving and de-noising processs by high-rate GNSS. China Satellite Navigation Conference(CSNC), Proceedings, Lecture Notes in Electrical Engineering, 244, 523-537. [ Links ]

Zheng, C. L., & Wang, B. S. (2015). Applications of s transform in seismic data processing. Progress in Geophysics, 30(4), 1580-1591. [ Links ]

Zhu, J. S., Cao, J. M., Cai, X. L., Yan, Z. Q., & Cao, X. L. (2002). High resolution surface wave tomography in east Asia and west Pacific marginal seas. Chinese Journal of Geophysics, 45(5), 646-661. [ Links ]

How to cite item Jiang, C., Wang, Y., & Zeng, G. (2020). Group Velocity Measurements of Earthquake Rayleigh Wave by S Transform and Comparison with MFT. Earth Sciences Research Journal, 24(1), 91-95. DOI: https://doi.org/10.15446/esrj.v24n1.85366

Received: March 12, 2019; Accepted: December 17, 2019

* Corresponding author: uxue.wang@glut.edu.cn

Creative Commons License This is an open-access article distributed under the terms of the Creative Commons Attribution License