


 Inglés (pdf)
 Articulo en XML
 Referencias del artículo
 Enviar articulo por email
 Citado por SciELO
  Citado por Google
  Similares en
SciELO
Similares en
SciELO  Similares en Google
 Permalink
Introduction
The existing remote sensing technology has many advantages, such as wide coverage, fast updating speed and large amount of information. The above advantages enable remote sensing technology to acquire large range of data in a relatively short time, so remote sensing technology is widely used. At present, it is most widely used in environmental and geological fields, which can monitor soil erosion, environmental protection, vegetation cover and land use (Gorji et al., 217). Remote sensing technology can be divided into broad sense and narrow sense. In the broad sense, it refers to the use of remote non-contact means to capture the information of monitoring research objects. In a narrow sense, the specific meaning refers to the technology that uses existing space technologies (satellites or aircraft) as a carrier platform and carries relevant sensors to perceive or observe some characteristics of the research target and analyze its characteristics (Gao et al., 2017).
In remote sensing image technology, target detection sampling point is one of the difficulties in remote sensing monitoring for geological ecological monitoring system. With the development of science and technology, the operating time and spatial resolution of remote sensing technology have been continuously improved, and the information of research objects collected by remote sensing images has become richer (Lengyel et al., 2017). At present, the application of target detection technology based on remote sensing image is more and more extensive. High-resolution optical remote sensing images can obtain more shape and texture information of ground objects, have stronger discrimination ability to ground objects, and can more intuitively display the surface conditions. However, due to the complexity of geology and ecology, it is difficult to extract images and express effects when monitoring sampling points. Therefore, these problems of target detection based on high resolution optical remote sensing image need to be solved. Most of the target detection technologies of remote sensing images are infrared remote sensing, synthetic aperture radar or medium-low resolution remote sensing images. These traditional detection technologies can't effectively adapt to the complexity of high-resolution optical remote sensing images and the diversity of targets (Silva et al., 2017). And as the spatial resolution of remote sensing gets higher and higher, the image gets closer and closer to the natural image. However, the target detection technology of natural image (such as artificial intelligence algorithm) has developed rapidly in recent years. The combination of artificial intelligence algorithm and image target detection will further improve remote sensing technology. Therefore, it is of practical significance to explore more effective target detection algorithms based on high-resolution optical remote sensing images.
To sum up, in this research, the configuration algorithm of high-resolution remote sensing detection technology was optimized by studying high-resolution remote sensing target detection technology. It is hoped that the effect of high-resolution remote sensing target detection can be improved.
Methods
Monitoring sampling point extraction algorithm
Selective Search algorithm firstly divides the pixels of the same object with similar features (such as color, texture and scale) in the image into super pixels, and obtains the initial small area set. Then, the similarity definition and merge strategy definition of pixels are carried out to merge super pixels and form a hierarchical structure, which can generate candidate windows. In order to obtain better robustness, Selective Search algorithm adopts multiple color spaces and multiple similarity calculation strategies for better robustness (Sürme et al., 2017).
BING algorithm is simple and efficient in the extraction of candidate windows, which is very suitable for the extraction of candidate windows. BING algorithm is a classifier with two stages. First, the first stage is to scan the images waiting to be detected according to different scales of sliding. Then the subgraph of the candidate window is unified to 8*8, and finally the linear scoring model needs to be used for scoring. The linear scoring model can be expressed as equations (1), (2), and (3).
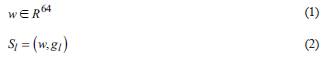

Among them, l represents the window position; i represents the window scale; (x, y) indicates the coordinates of the upper left corner; S t represents filter score; and g t represents the window feature vector.
In the BING algorithm, the w linear model is trained by SVM in the first stage, the normal pattern gradient features of the real target window are taken as positive samples, and the paradigm gradient feature of the randomly sampled background window is taken as a negative sample.
The second stage is to solve the problem that different scales contain different possibilities of targets. It needs to train a scoring calibrator for each scale window. The candidate window score extracted in the first stage is corrected, as shown in equation (4).

Among them, v and S t represent the calibration coefficients of i learning at different scales.
In order to speed up the process of image extraction and scoring, the BING algorithm uses a binary approximation method. The two-valued basis vector is used to approximate the linear model, as shown in equation (5).
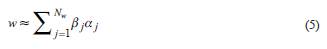
Among them, N w represents the number of base vectors; a. represents a base vector; and β j indicates the coefficient.
α j. can be represented by another binary vector and its complement form, as shown in equation (6).
Among them,
 .
.
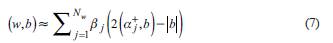
Equation (6) can perform the fast bitwise and bit count operation of the score of the binarized feature b, which can be expressed by equation (7).
BING algorithm expresses NG eigenvalue through equation (8):
Through the above changes, the score of whether the final image window contains the target can be approximated as equation 9:
Among them,
 can perform CPU atomic operations, which improves the speed of BING algorithm.
Discriminant algorithm
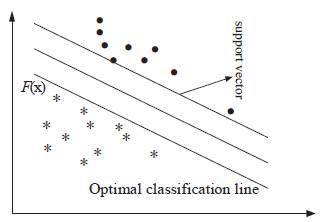
Support Vector Machine (SVM) is adopted in the general discriminant algorithms of remote sensing image technology. The basic idea of support vector machine is shown in figure 1.
The algorithm derivation process of SVR is as follows (Ellis & Coppins, 2017).
First, the training set sample pairs were given:
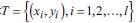
 . In the high-dimensional eigenspace, the linear regression function is established.
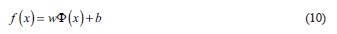
Among them, w is weight vector; Φ(x) represents the nonlinear mapping function; and representative bias.
The C-linear insensitive loss function is defined as equation (11).
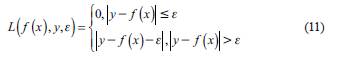
Among them, f(x) is the predicted value, y is the corresponding real value, and ε is the insensitive coefficient to control the fitting accuracy.
Secondly, relaxation variables, that is, ξi and ξj, are introduced. According to SRM criterion, the minimization objective function is constructed, as shown in equation 12.
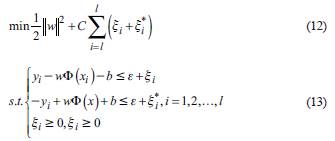
Among them, C > 0 is the penalty factor, and represents the punishment intensity for samples with an error greater than 1 during training.
Lagrange equation is introduced into equation (13) to obtain dual optimization problem, as shown in equation (14) and (15):
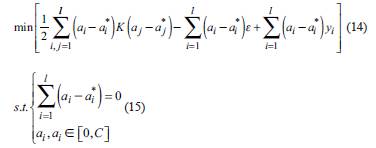
Among them, K (xi, xj ) = Φ(xi )Φ (xj) is a kernel function. The commonly used kernel functions are polynomial kernel function, radial basis kernel function and Sigmoid kernel function. And the radial basis kernel function was selected in this research.
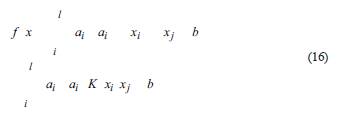
Fourthly, α i . and α i * can be solved from equation (15), and then w* and b* can be obtained, the regression function is shown in equation (16).
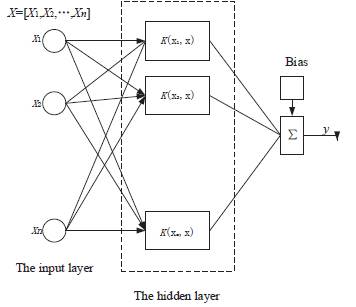
The principle diagram of support vector regression machine is shown in figure 2.
Improved BING algorithm
Because the BING algorithm was easy to miss the fuzzy monitoring samples, in this research, the candidate region extraction algorithm was improved. Firstly, different weak feature channels were extracted from each training sample, and a scoring model was developed for each weak feature channel. Then the score of a scoring model was trained by each weak feature channel as the score of candidate window. Because the integration part adopted a simple linear weighting method, the accuracy of each model determined the weight of the model.
Thus, the corresponding scoring model for each window was obtained, as shown in equation (17) and (18).
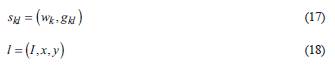
Among them, w k is the parameter of scoring model k; S u represents the score of window l by the scoring model; and g kl indicates the feature value k at window 1.
Therefore, the final window score in the first stage is expressed by equation (19).
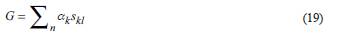
Among them, α k is the weight of the eigenvalue of the scoring model. After correction according to the scoring model of the second stage, the window score is shown in equation (20).
In BING algorithm, NG feature graph is calculated for test sample points, and then binary approximation window NG feature and scoring model parameters are used. Such a process is to only use CPU atomic operation. NG feature graph calculates the gradient amplitude of each pixel by collecting the edge intensity information in the original graph. However, because the logic of the NG feature map is relatively simple, the influence of noise on it is particularly prominent.
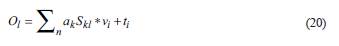
Based on the shortcomings of BING algorithm mentioned above, Sobel feature graph with better edge information capture effect was adopted in this research to replace NG feature graph with weak edge information. Moreover, the Local Binary Pattern (LBP) feature graph and Difference of Gaussian (DoG) feature graph were introduced into the Sobel diagram. The meaning expressions of Sobel feature graphs are shown in equations (21)~(23):
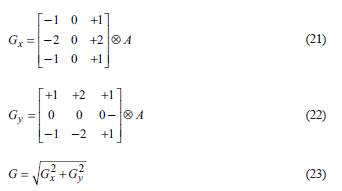
Among them, A represents the original graph matrix; G is the gradient of the horizontal direction of the image; G y is the gradient for the vertical direction of the image; and G is the gradient magnitude of the feature graph matrix.
As can be concluded from equation (21), Sobel feature diagram adopts the grayscale diagram of the original image of 3*3 Sobel operator convolution. The approximate gradients of the horizontal and vertical directions are calculated respectively, and then the sum of the squares of the approximate gradients of the horizontal and vertical directions is carried out to obtain the corresponding gradient amplitude of each pixel.
LBP feature map is a texture feature proposed by Yavad and Congalton (2017) to describe images. With the development of technology, it is widely used in human classification and pedestrian detection. The calculation process of LBP code is shown in figure 3.
DoG feature map is obtained by subtracting two fuzzy images of different degrees from the original image. The two-dimensional Gaussian kernel function is defined as follows:
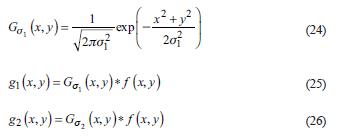
The DOG feature map can be obtained by subtracting the two images, as shown in equation (27).
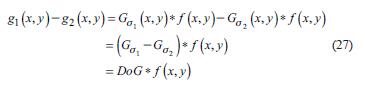
That is, DOG can be expressed by equation (28):
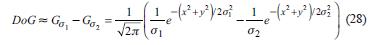
Among them, σ1 and σ2 represent gaussian kernel parameters. When DoG images are applied in different scenarios, the proportions of two gaussian kernel parameters are also different. For example, when DoG is used for image enhancement, σ1: σ2 = 1:4. In this study, the purpose of DoG was image enhancement, so σ1 = 0.5, and σ2 = 2.0 were adopted.
Results and discussion
Analysis of the results of the Selective search algorithm
In this research, the applicability of Selective search algorithm in remote sensing image to target extraction of monitoring sampling points and the superiority of improved BING algorithm were mainly verified. The data sample set was divided into training set and test set, and the ratio of training set to test set was 2:8,
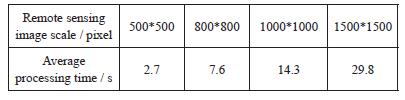
This experiment was tested in fast mode, and only two different color spaces and two similarity functions were used. In remote sensing images, the size of target collection points was determined by the spatial resolution of images. Therefore, in this research, unreasonable candidate windows were filtered when selective search algorithm results were obtained, as shown in figure 4. According to figure 4, with the increase of pixel size of remote sensing image, the number of candidate windows generated by Selective search algorithm was also increasing. In addition, when there was no constraint, the average number of candidate windows generated by selective search algorithm under different pixel sizes was greater than the average number of candidate windows generated by selective search algorithm after filtering unreasonable windows. Moreover, when there was no constraint, the maximum number of candidate windows generated by Selective search algorithm under different pixel sizes was larger than that generated by Selective search algorithm after filtering unreasonable windows. Studies showed that selective search algorithm could generate about 2000 candidate windows on average in natural images (Fan et al., 2017). In this experiment, the adopted remote sensing images could generate 3000 candidate windows on average. By comparison, selective search algorithm could generate more candidate windows in remote sensing image. Table 1 shows the running time of selective search algorithm in remote sensing images of different sizes. As can be observed from table 1, with the increase of pixel of remote sensing image, the running time of the algorithm had been increasing. When the pixel size was 1500*1500, it took 30s to get a candidate window of image in remote sensing image, which indicated that this algorithm did not occupy an advantage in remote sensing pixel size.
Figure 4 The average number of candidates extracted by Selective algorithm for remote sensing images of different scales
Comparison and analysis of the effects of BING algorithm and IBING algorithm
Figure 5 is the candidate effect diagram of extraction on high-resolution remote sensing images by BING algorithm and IBING algorithm. As can be concluded from figure 5, when the number of candidate windows was the same, the DR/MABO value of IBING algorithm was 97.37%, while the DR/ MABO value of BING algorithm was 95.13%. Therefore, the extraction effect of IBING algorithm was better than that of BING algorithm. Similarly, the MABO value of IBING algorithm was 65.36%, while the DR/MABO value of BING algorithm was 63.21%, indicating that the quality of candidate boxes extracted from remote sensing images by the improved algorithm was higher.
Figure 5 Candidate renderings extracted from high-resolution remote sensing images by BING algorithm and IBING algorithm
Figure 6 shows the extraction effect diagram when the number of candidate areas is 1000~10000. It can be observed that as the number of candidate regions increased, both the DR and MABO indicators tended to rise and then stabilize. When the number of candidate areas was less than 5000, the index was rising, and when the number was greater than 5000, it did not change. This indicated that the number of targets in large-format remote sensing images was relatively large, and the range of possible positions of targets increased significantly, so more candidate windows were needed to achieve a certain detection rate.
Comparison and analysis of average detection time between BING algorithm and IBING algorithm
Figure 7 shows the average detection time of BING algorithm and IBNG algorithm on different data sets. As can be observed from the figure, under the BING algorithm, the detection time increased with the increase of size, but the maximum time did not exceed 1s. However, the increase of IBING algorithm was obvious, which increased from 0.18s to 0.64s. This showed that although IBING algorithm could greatly improve the extraction speed of remote sensing, the detection time of each image was increased, and such detection time was acceptable.
Conclusion
In this research, the algorithm was optimized for high-resolution remote sensing detection sampling points under geological ecology. The three algorithms involved in traditional remote sensing technology are Selective search algorithm, SVM algorithm and BING algorithm respectively. In this paper, the BING algorithm was improved to obtain the IBING algorithm. According to different data sets, the Selective search algorithm in remote sensing image was verified for the applicability of target extraction of monitoring sampling points, and the improved BING algorithm was also verified. The results showed that selective search algorithm could generate more candidate windows in remote sensing image and had better adaptability. The improved algorithm had higher quality of candidate boxes extracted from remote sensing images. Although the IBING algorithm could greatly improve the extraction speed of remote sensing, the detection time for each image became larger. And such detection time was also acceptable.
The algorithm optimization of high-resolution remote sensing monitoring sampling points in geological ecology was carried out, and the superiority of the algorithm was verified through experiments, which promoted the application of high-resolution remote sensing technology in geological ecology.

