


 Inglês (pdf)
 Artigo em XML
 Referências do artigo
 Enviar este artigo por email
 Citado por SciELO
  Citado por Google
  Similares em
SciELO
Similares em
SciELO  Similares em Google
 Permalink
Introduction
Geomembrane is one of the most important components of bottom liner system and top cover system in modern sanitary landfill. It plays an important role in preventing waste leachate from polluting groundwater and protecting the surrounding environment. With the increase of landfill height, the Geomembrane in heavy metal contaminated area will produce tensile stress under the action of overlying heap weight. In order to increase the interface strength, reduce the tension stress in Geomembrane and improve the stability of landfill interface, rough Geomembrane is more and more used in landfill's slope liner system. According to the indoor shear test results, the interface of Geosynthetics-Geosynthetics and Geosynthetics-clay presents obvious strain softening characteristics. Therefore, the key to calculate the tensile stress of Geomembrane is to select the strength parameters. At present, the conventional limit equilibrium method cannot solve the tension stress of Geomembrane in the state of softening interface.
(1) The failure process of polyurea composite impervious layer in shrinkage joint is analyzed by using V-zone model (CZM). Based on the load-displacement-deformation data obtained from the debonding test of impervious layer, the interfacial stiffness and viscosity coeficient of the bonding element of the bonding layer are calibrated. In the numerical example, the critical load of coating debonding is determined, and the influence of the impervious layer's thickness of polyurea composite on the critical load of debonding is analyzed. However, when water pressure is applied to the open shrinkage joint, the thickness of the coating, the elastic modulus and the shear stress of the bonding parts will affect the debonding length of the coating, which will cause water seepage in the pit and depression areas.
(2) A generalized version of the model is created by regression fitting all size categories of the analysis unit at a given research site. The root mean square error of the corrected pic estimates ranges from 1.5% to 10.7%; these values are much better than the RMSE values of the uncorrected pic estimates. For calibrated and uncalibrated PICs, the accuracy of estimation increases with the increase of the size of the analysis unit. However, the unit size, geographic location or land's cover data set coeficients of landills are similar, which also leads to a signiicant decline in the performance of the model when applied outside the development area.
(3) Based on the saturated-unsaturated seepage finite element theory, the three-dimensional seepage ield of a typical earth-rock dam with random distribution of impervious Geomembrane defects is simulated. Considering the number, type, location, size and distribution of imperfections in Geomembrane, the seepage quantity of imperfections in Geomembrane and the variation law of infiltration surface behind the membrane are mainly analyzed, so as to analyze the internal force of Geomembrane according to the law of analysis. However, the interface strength model ignores the transition stage of softening, which is inconsistent with the actual situation. Therefore, it is necessary to adopt a more reasonable analysis model for the interface softening of Geomembrane to analyze the tension stress of Geomembrane on landill slope.
In view of the above problems, this paper studies the internal force of Geomembrane on the basis of clay interface, taking landill as the core. While describing in detail, the model of Geomembrane is constructed and its internal force is analyzed. The influence of the height, slope gradient and anchorage length of Geomembrane on the tensile stress of Geomembrane is analyzed by the cable fractional solution.
Geomembrane Model
As shown in Figure 1, Geomembrane is an important part of landfill liner system (Zhang, Weng & Shao, 2017). In order to reduce the tension stress of Geomembrane, an anchorage ditch is designed at intervals on the slope.
The unbalanced shear stress on the upper and lower surfaces of Geomembrane results in large tensile deformation of Geomembrane (Ru et al., 2018). The force acting on the Geomembrane element is shown in Figure 2.
Generally speaking, the shear strength of the interface between Geomembrane and bottom clay is the weakest in the cushion system (Lin et al., 2017), and the accumulation of shear stress will form a larger tensile stress in the anchorage ditch. This is the focus of this study. Some variables used in the analysis are shown in Figure 3.
The internal force of Geomembrane in Figure 3 is characterized by steep slope, and the overall stability of 1:3.3 rockfill dam slope is sufficient. However, the anti-sliding stability of the Geomembrane and the cement mortar surface at its bottom depends on the bonding force between the membrane and the mortar (Huang et al., 2017). The bonding force between the membrane and the mortar is greater than 0.1 MPa if the Geomembrane is laid immediately before the cement mortar hardens and the sand bag is pressed on the membrane, so that the safety of the anti-sliding stability is sufficient. If only the friction force is used, the safety is insufficient. The anti-sliding stability between reinforced concrete slope protection and Geomembrane depends on the cohesive force of asphalt (Xu et al., 2017), which can reach 0.5 MPa, providing a high safety factor.
Usually in the design and construction, the composite Geomembrane has not been produced yet, so the polyvinyl chloride film is used. Some engineers attribute the landfill site to concrete face rockfill dam, which is very inappropriate, because the reinforced concrete mesh is not divided into blocks and without water stop sheet, it will inevitably lead to crack leakage. Polyvinyl chloride (PVC) is an impervious body, so it is appropriate to belong to Geomembrane rockfill dam. If it is attributed to the mixed dam type of Geomembrane and concrete face slab, this dam type saves the expansion joint water stop, reduces the construction dificulty greatly, saves funds, and avoids the common problem of expansion joint leakage.
Analysis of Internal Force of Geomembrane
Figure 4 is a schematic diagram of the yard structure. In this paper, all additional loads on Geomembrane are regarded as a whole and expressed as a single material. Assuming that there is no slip on the boundary surface of the upper layer of Geomembrane, i.e. Øu > Ø1 (Øu, Ø1) is the friction angle on the contact surface of the upper layer and the lower layer of Geomembrane respectively. The interaction between the interior of garbage and its intermediate contact layer such as the overlaying soil, is ignored, so that the estimated results tend to be safe and the analysis process will be obviously simpliied.
Fundamental Equation of the Model
The shear stress on the contact surface of the Geomembrane is dependent on the shear-displacement relationship between the Geomembrane and the soil (Tang et al., 2017). It can be observed from drawing and shear tests that the shear stress x on the contact surface increases nonlinearly with the increase of shear displacement u. In this paper, a simpliied hyperbolic relationship is adopted.
In the formula, x is the shear stress of the contact surface of Geomembrane's lower layer ; α = 1/ k s , k s is the initial shear stiffness of hyperbola: b = 1/ t m , t m is the ultimate shear stress of the contact surface of the Geomembrane., and t m = σ n tan Ø 1 .
Generally speaking, the foundation medium under Geomembrane is clay cushion (Wüthrich et al., 2018). Assuming that its shear modulus is G and its thickness is D, the clay cushion can be used to estimate k s :
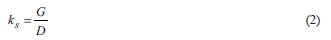
When formula (2) is substituted for formula (1) and there is no dimensionalization, it can be obtained that:
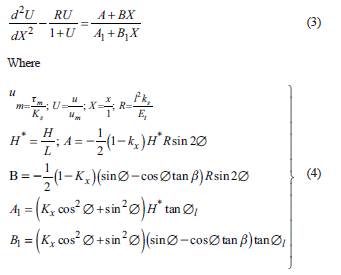
In the case of small slope angle, assuming that the vertical and horizontal directions are the principal stress directions of refuse dump (Jin et al., 2017), the normal stress and active shear stress at the interface are respectively as:
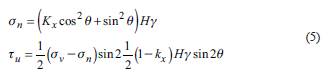
Because the tensile stiffness of geotextile is one order smaller than that of Geomembrane, it can be assumed that the shear stress at the Geotextile-Geomembrane interfaceis in the limit state, and the shear stress is as follows:

Where, c t and φ 1 are the interface strength parameters of Geotextile-Geomembrane (Choi et al., 2017). The active shear stress formula (6) and the interfacial shear stress formula (4) of Geomembrane-clay are the smaller values of the overlying shear stress of Geomembrane.
Most interface tests show that the strength of Geomembrane-clay interface presents obvious softening characteristics (Tang et al., 2017). In this paper, the tensile stress of Geomembrane on landfill slope is analyzed by using the Geomembrane-clay interface softening model as shown in Figure 5. When the relative displacement of the interface reaches the ultimate displacement u p , the maximum shear strength tp is excited, and the shear strength will continue to decrease with the increase of the relative displacement. When the relative displacement reaches the residual displacement u, the shear strength will stabilize at the residual strength tr (if u p = u r , the ideal elastic-plastic solution of the softening section cannot be considered). The shear strength and relative displacement of the plane can be divided into three stages: elastic stage, softening stage and residual stage. The interfacial shear strength conforms to the Mohr-Coulomb failure criterion (Mcclung & Ibáñez, 2017) shown in Figure 6, in which c f φ p and c r , φ r are the peak strength parameters and residual strength parameters of the Geomembrane-clay interface, respectively.
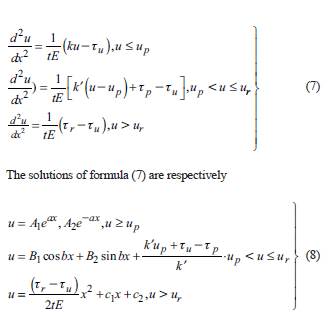
For the three stages of relative displacement of the above interface, formula (7) can be expressed as follows:
In the formula, the constants A
1
, A
2
, B
1
, B
2
, C and C2 depend on the boundary conditions;
 and
and
 are stiffness ratio constants. The boundary conditions at both ends of Geomembrane are respectively
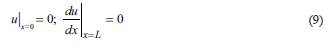
Because the shear strength and relative displacement of Geomembrane-clay interface can be expressed in three stages (Li, Wu & Choi, 2017), the Geomembrane interface can also be divided into three stages from anchoring end to free end: elastic stage (u ≤ u p ), softening stage (u p < u ≤ u r ) and residual stage (u > u r ) In this paper, the elastic stage length is defined as L p and the softening stage length is L r When x = Lp, u = u p ; when x = L p +L T , u = u. According to the boundary conditions of formula (9), formula (8) can be rewritten as
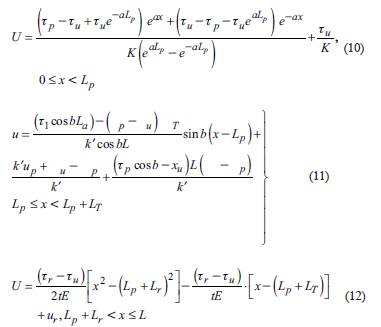
It is concluded that the tensile stress of Geomembrane is as follows.
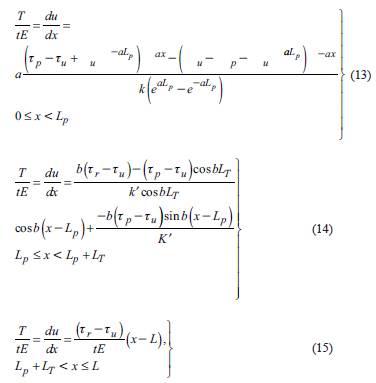
In the formula, L p and L T can be obtained by the internal force coordination conditions of elastic and transitional stages and the internal force coordination conditions of transitional (Fils et al., 2018) and plastic stages, respectively.
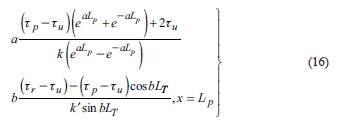
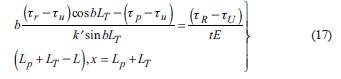
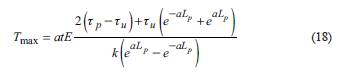
Finally, the values of L p and L T obtained by formula (16) and formula (17) are substituted for formula (11)-(13) to obtain the tensile stresses at all points on Geomembrane. The tensile stress at x = 0 is the maximum tensile stress of Geomembrane (Zhang et al., 2018), and its expression is as follows:
Numerical Solution of Finite Difference
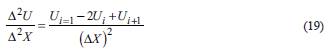
Because formula (18) is a non-linear differential equation, the finite difference method is used to solve it numerically. Dimensionless Geomembrane length is divided into n elements, then the number of nodes is (n +1), i = 0,1,2,..., n, and ΔX = 1/ n, and a virtual node (n + 1) is added to the free end of Geomembrane .
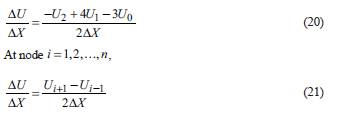
For the second order differential, the difference scheme is used:
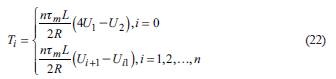
For irst order differential, the difference scheme is At node 1 = 0,
It can be obtained by finite difference method and boundary conditions at both ends of Geomembrane.
Based on the above method, the tension and displacement of Geomembrane can be obtained by numerical iteration (Su et al., 2019), and the influence of various parameters of landfill slope on the displacement and tension of Geomembrane can be analyzed by numerical method. In this paper, the main parameters affecting the displacement and tension of Geomembrane, inclination q, length L, elastic modulus E and height H, are studied. The results are shown in Figure 7-10. From Figure 7, it can be seen that the displacement and tension of Geomembrane are non-linear along its length. When other conditions are the same, both displacement and tension increase with the increase of inclination angle (Zhang, Dai, Liu, et al., 2017), and when q is small, the change of q has a greater impact on the tension and displacement. From Figure 7 to 10, it can be seen that the influence of the length, modulus of elasticity and height of geomembrane on the displacement and tension of Geomembrane is similar to that of dip angle q.
The peak strength t
p
= Cp + σ
n
tan φ
p
of the interface between Geomembrane and clay is the maximum strength that the interface can exert when the relative displacement of the interface is h and the residual strength
 is formed when the relative displacement of the interface is greater than the residual displacement u
r
due to the rearrangement of clay particles on the interface or the polishing of the surface of geosynthetics. The peak strength t
p
and residual strength t
r
. of rough Geomembrane-clay interface are usually quite different. Therefore, the selection of interface strength is one of the key factors that affect the safety of Geomembrane. When the Geomembrane-clay interface enters the residual state (Figure 11), the shear stress of the Geomembrane-clay interface from anchorage to free end is elastic, softening and residual respectively. Figure 11 shows that the smaller the residual displacement u is, the easier the residual strength of the Geomembrane-clay interface will be. Therefore, the influence of residual displacement u
r
and peak shear strength t
p
on the tensile stress of Geomembrane will be smaller (Figure 12). At this time, the exertion of surface shear stress under Geomembrane depends on the residual strength of the interface, when ur is larger, the length of the interface between Geomembrane and clay in the softening zone is longer, and the influence of u and t
p
on the tensile stress of Geomembrane is more obvious.In this case, if the softening of the interface strength between Geomembrane and clay is not considered (Luo et al., 2017), the maximum tensile stress of Geomembrane obtained by the ideal elastic-plastic method according to the peak strength or residual strength of the interface will be inconsistent with the actual situation. As shown in Figure 13, it is not safe to calculate the maximum tensile stress of Geomembrane by the ideal elastic-plastic method (Erhart & Hirche, 2017). Because the difference between residual displacement ur and peak displacement up is small, the influence of peak shear strength t
p
of Geomembrane-clay interface on the maximum tensile stress of Geomembrane in Figure 13 is also small. Figure 14 and Figure 15 show the tensile displacements and stresses at different positions of Geomembrane under different residual strengths. It can be seen that the residual strength seriously affects the tensile displacements and stresses of Geomembrane.
is formed when the relative displacement of the interface is greater than the residual displacement u
r
due to the rearrangement of clay particles on the interface or the polishing of the surface of geosynthetics. The peak strength t
p
and residual strength t
r
. of rough Geomembrane-clay interface are usually quite different. Therefore, the selection of interface strength is one of the key factors that affect the safety of Geomembrane. When the Geomembrane-clay interface enters the residual state (Figure 11), the shear stress of the Geomembrane-clay interface from anchorage to free end is elastic, softening and residual respectively. Figure 11 shows that the smaller the residual displacement u is, the easier the residual strength of the Geomembrane-clay interface will be. Therefore, the influence of residual displacement u
r
and peak shear strength t
p
on the tensile stress of Geomembrane will be smaller (Figure 12). At this time, the exertion of surface shear stress under Geomembrane depends on the residual strength of the interface, when ur is larger, the length of the interface between Geomembrane and clay in the softening zone is longer, and the influence of u and t
p
on the tensile stress of Geomembrane is more obvious.In this case, if the softening of the interface strength between Geomembrane and clay is not considered (Luo et al., 2017), the maximum tensile stress of Geomembrane obtained by the ideal elastic-plastic method according to the peak strength or residual strength of the interface will be inconsistent with the actual situation. As shown in Figure 13, it is not safe to calculate the maximum tensile stress of Geomembrane by the ideal elastic-plastic method (Erhart & Hirche, 2017). Because the difference between residual displacement ur and peak displacement up is small, the influence of peak shear strength t
p
of Geomembrane-clay interface on the maximum tensile stress of Geomembrane in Figure 13 is also small. Figure 14 and Figure 15 show the tensile displacements and stresses at different positions of Geomembrane under different residual strengths. It can be seen that the residual strength seriously affects the tensile displacements and stresses of Geomembrane.
Simulation Experiment
The dam body is raised to 40m elevation at the original refuse dam and continued to be landfilled to 120m elevation. A horizontal anti-seepage system is added to the reservoir area in combination with the closure system of the first phase of the project and a leachate drainage system is added to the reservoir area of the first phase of the project. Some of the original sewage treatment tanks are used, and a leachate regulating tank is expanded downstream of the original sewage interception dam. Horizontal anti-seepage system consists of protective layer, leachate collection layer, main anti-seepage layer of Geomembrane, secondary anti-seepage layer (GCL geosynthetical bentonite cushion) or clay liner (CCL), strengthening layer, clay protective layer, strengthening layer, gas conducting layer and isolation layer from top to bottom. The calculation parameters are as follows: the geotechnical composite drainage mesh-Geomembrane strength parameters are c = 0kpa φ = 13, the interface parameters of Geomembrane-geosynthetical bentonite cushion are c p = 2.2kpa, φ p = 21.6, c r = 1.0kpa, φ r = 12.8, the Geomembrane-clay interface parameters are c p = 0kpa, φ p = 11, c = 0kpa, φ r = 6.5 respectively, the landfill weight is y mm = 10.2kV/ m3 and the slope gradients are 0 = 14, H = 12 ~ 40m, L = 10m, u p = 0.012m, u r = 0.016m, t = 0.0015m, E = 180MPa Kx = 0.56. The maximum tensile stress of Geomembrane varies with the height of landfill as shown in Figure 16. When the Geomembrane is GCL, there is no tensile stress in the Geomembrane because the shear strength of the surface under the Geomembrane is greater than that of the surface above. When the Geomembrane is lined with clay, the lower strength of the Geomembrane-clay interface makes the Geomembrane have great tensile stress.
Conclusion
Based on the softening model of interface strength between Geomembrane and clay, the equilibrium equation of Geomembrane force is established, and the analytical solution of tension stress and displacement of Geomembrane is obtained. Through further parameter study, the following conclusions are drawn:
(1) In the strength softening model of Geomembrane-clay interface, the longer the softening section is, the greater the influence of the peak strength and residual displacement of the interface on the tensile stress of geomembrane is. On the contrary, the residual strength of the interface is the main controlling factor of the maximum tensile stress of the Geomembrane when the softening stage is short.
(2) When the strength of Geotextile-Geomembrane interface is close to or less than the residual strength of Geomembrane-clay interface, the tensile stress of Geomembrane is very small or even not.
(3) Slope gradient, anchorage length and height of overlying pile of Geomembrane have great influence on the maximum tensile stress of Geomembrane.
(4) The maximum tensile stress of Geomembrane can be effectively reduced by using rough HDPE Geomembrane with high interfacial strength, choosing appropriate geotextile, reducing the anchorage length of Geomembrane and limiting the height of pile on Geomembrane.

