


 Inglés (pdf)
 Articulo en XML
 Referencias del artículo
 Enviar articulo por email
 Citado por SciELO
  Citado por Google
  Similares en
SciELO
Similares en
SciELO  Similares en Google
 Permalink
Introduction
The main sources of heavy metal pollution (Gasiorek et al., 2017) include industrial pollution, metal mining, sewage irrigation, solid waste disposal, etc., and have received extensive attention from researchers in recent years. The accumulation of pollutants (Diepens & Koelmans, 2018) in the soil often presents a high degree of spatial variability due to the enhancement of human activities, which makes the soil heavy metal pollution more complicated, and often forms one or more trends in space. Since heavy metals are not easily mobile and dissolved, they accumulate after entering the organism and have an adverse effect on the organism. For example, when the low concentration of Hg is present in the soil, it can promote in the early stage of wheat germination. However, as the time increases, the respiration will decrease and eventually manifest as inhibition. It can be seen that the latent time of heavy metal pollution is long. Heavy metals that are not easily degraded have adverse effects on the quality and yield of crops, and can even affect human health through the food chain.
The construction of ecological compensation mechanism is an important means to improve the quality of the ecological environment and coordinate the contradiction between environmental protection and economic development. Many experts and scholars at home and abroad have done a lot of research on this and achieved good results. Various methods of ecological compensation standards and their application cases are analyzed to determine the ecological compensation method based on the internet of things (Kokkonis et al., 2017), which provides the scientific basis for the determination of ecological compensation standards and the construction of mechanisms.
(1) In order to solve the ecological environment loss caused by industrial pollution and determine reasonable ecological compensation standards, energy theory is used to calculate energy loss. Taking the measured ecological environment loss as the ecological compensation standard, the research draws the ISW pollution tax to balance the pollution control effect (Liu et al., 2018).
(2) The concept of theoretical deficit. Based on the theoretical deficit, the calculation method of compensation cost between contaminated areas is improved. At the same time, compensation costs are predicted by combining population size, wealth and technology. Finally, the compensation indicators for each contaminated area are determined (Yang et al., 2019).
(3) First-hand information obtained through public statistics and field surveys as the source of data. Conditional valuation method (CVM) is used to estimate the source data and contaminated receptor data associated with the compensation area. According to the survey results, the compensation standard is determined, and the compensation amount is estimated, then the ecological compensation is finally realized (Shu, 2018).
(4) An area-based ecological compensation method is proposed. Based on the traditional ellipsoidal area and 103 regions as reference, the biomass and ecological compensation are determined by surface area method. In this way, we will balance the interests of different regions and make reference for ecological sustainable development (He et al., 2018).
Due to the complexity of the process, it will consume a lot of human and material resources. Therefore, an ecological compensation method based on the area where the soil is contaminated by heavy metals is proposed. By analyzing the living and production of the contaminated area, the cost of pollution compensation is calculated to establish a sustainable ecological compensation plan. The method has short calculation time, easy operation and high accuracy, and has excellent application promotion value.
Materials and methods
The overall structure of the internet of things
First, the concept, necessity, and positioning of the internet of things operating system are briefly analyzed. The basic functions of the internet of things operating system (Gao et al., 2019) are similar to those of the mobile operating system in the field of mobile Internet. First of all, the role of the mobile operating system is to achieve the separation of terminal hardware and software. The developer of any application does not have to consider the physical hardware configuration of the terminal. It can be run on all mobile operating system-based terminals simply by writing an application based on the programming interface provided by the phone. The function of the hardware is limited. If the software and hardware are tightly bundled and not separated, the functions of the entire system are limited. However, by stripping out the hardware functions, the functionality of the entire system can be improved by software changes. Secondly, for the new internet of things, to achieve a benign development, the effect of software and hardware separation must be achieved. The internet of things has limited hardware capabilities. By writing the corresponding application by the specific developer, you can extend the capabilities of the hardware and make full use of the hardware. In addition, the internet of things needs to achieve another separation: the separation of hardware drivers from the operating system kernel. When there is the problem with the hardware of the internet of things used, only the problem hardware needs to be replaced, and the operating system automatically configures the corresponding driver. The installation process is transparent to the programs running on the operating system.
The following diagram illustrates the internet of things ecosystem built on these two separations (application software (Millard et al., 2018) is separated from the hardware; device drivers are separated from the operating system kernel),The work flow diagram of the Internet of Things is shown in Figure 1:
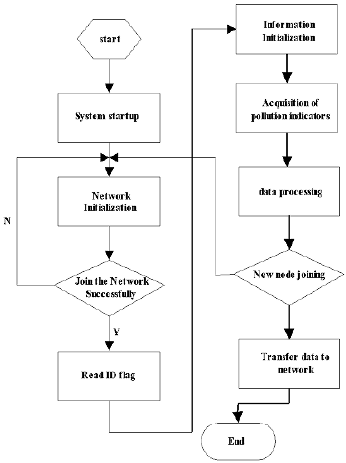
In order to obtain accurate spatial distribution information of pollutants in the soil by using the internet of things, the investigation of heavy metal pollution in the soil usually includes multiple stages such as preliminary investigation and detailed investigation of pollution. The main purpose of the preliminary investigation is to identify major pollutants and potentially contaminated areas of the soil (Monaco et al., 2017), usually with a small sample size. The detailed investigation of pollution is based on the preliminary investigation, and the sample points in the potential pollution area are increased to determine the extent of the pollution area and the degree of pollution. The errors in the soil pollution survey program mainly include the underestimation of the contaminated area and the overestimation of the clean area. Among them, the former will lead to the pollution control of the pollution area is not effectively controlled, and the latter will lead to unnecessary investment. In order to obtain accurate information on contaminated areas, it is often necessary to increase the sample size, but this will result in an increase in the cost of sampling analysis. The efficient sampling scheme minimizes the total cost of economic losses due to sampling survey costs and survey uncertainty. The goal of sampling scheme optimization is to seek the best sample information to reduce the uncertainty of pollution repair. The spatial distribution of soil pollutants is affected by factors such as pollution sources, environmental conditions, and pollutant properties. It exhibits varying degrees of spatial correlation and variability in space. The description of the spatial variability of soil contaminants is the key to the impact of the survey results. Therefore, combined with the specific needs of soil pollution compensation, an encryption method based on pollution probability and local spatial variability of pollutants is proposed to improve the estimation accuracy of ecological compensation methods in terms of pollution range and pollution degree. It also provides methodological support for ecological compensation in soil contaminated areas.
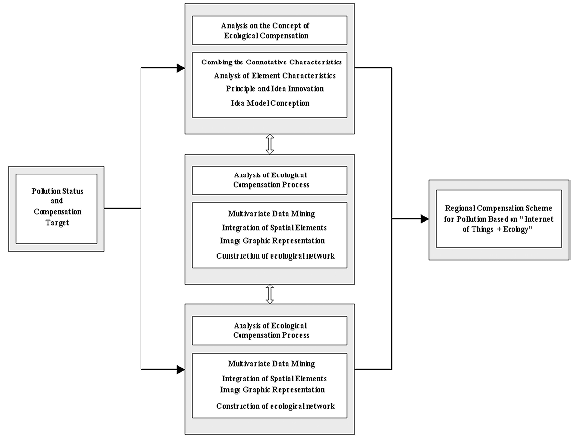
Based on the architecture of this ecological environment (Lin et al., 2018), the architecture of the Internet of things operating system is shown in Figure 2:
Hardware Design
(1) The overall image size of the internet of things operating system must be highly scalable to accommodate applications with limited hardware resources. It can not only adapt to the application scenarios where the hardware resources such as the wristband are relatively rich, but also adapt to applications such as environmental monitors that are not very intelligent. Specifically, the size of the operating system should be scalable from 10K to 10 megabytes;
(2) In addition to providing a Java interface, the Internet of things operating system should also provide a standard C language interface to deal with high efficiency and real-time applications. For example, the manufacturer of the Internet of things terminal can use C interface to develop efficient application for this hardware, while third party enterprises can use the Java interface to develop applications that can be widely ported to RFID information sensing equipment to exchange information.
(3) The framework of the driver of the internet of things operating system should be flexible enough and compatible enough to dynamically load and unload device drivers (Myhre et al., 2017);
(4) The version of the internet of things operating system has a variety of branches or variants. For each industry, even each type of hardware (such as cars, refrigerators, etc.) will have a corresponding version, which requires good support for compiling development tools.
Based on the "the internet of things + ecology" concept, the Internet, GIS and the principles and methods of image graphics, the ecological compensation of soil contaminated by heavy metals is discussed. Based on the connotation and principles and theoretical basis of ecological planning, the basic procedures, contents and methods are elaborated, and the role of the internet of things is emphasized (Li et al., 2017). From the perspectives of the diversity, comprehensiveness, systemicity and logic of ecological factors, the ecological compensation ideas are analyzed.
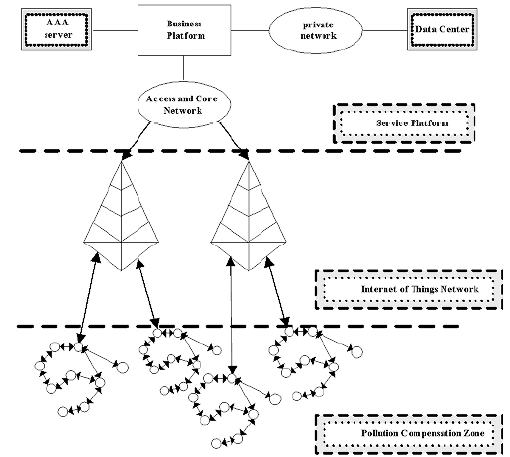
The internet of things operating system kernel, peripheral modules, application development environment, etc., are software system platforms that support the upper-level industry application software. The industry application software is the software that finally releases the hardware function of the IoT terminal. Such the IoT operating system is the basis for the rapid industrialization of industrial applications. Software and hardware vendors and users can only benefit from the standard and secure internet of things operating system. The internet of things can also develop rapidly, laying a good foundation for ecological compensation. The ecological compensation structure based on the Internet of Things is shown in Figure 3.
Ecological compensation
Assume that the factors affecting farmers’ compensation (Kan et al., 2017) include age (Fage), gender (Fsex), cultural level (Fedu), labor population (Fwrf), family cultivated area (Fsize), whether to waste (Fabd), degree of farmland pollution (Fdgr) and bid amount (Fbid). These eight factors are used as independent variables to establish multiple linear regression equations:
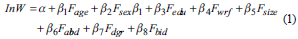
Based on the internet of things, the detailed analysis is carried out to determine a set of relatively fixed methods for analyzing the preference data (Chen et al., 2017). The utility level (U) of the farmer is as follows

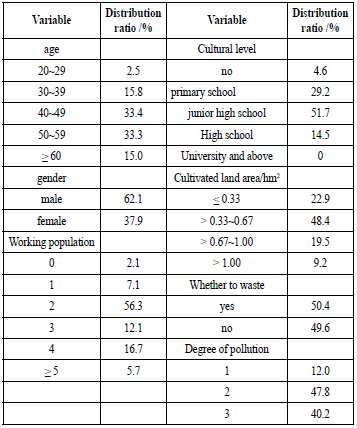
In the above formula, v is an observable variable; ε is an unobservable variable. j = 0 indicates that the sample is willing to stop farming and participate in the project, j = 1 indicates that the sample continues to farm and refuses to participate in the project. y is the income level of the sample under different decision conditions; s is a series of potential influencing factors (including age, gender, etc.) of the sample's willingness to pay. The basic information of the respondents is shown in Table 1.
Assuming the given compensation criterion is A (He et al., 2017), when the given compensation criteria increase the utility level, the survey sample is likely to choose to participate in the project. At this time there are

Assume that the utility difference (∆U) caused by farmers' participation/ non-participation in the project is:

When expressed as an observable variable, the utility difference is

In the above formula, ɑ is a constant term; β is the coefficient of influence of the given compensation criterion on the willingness to participate. When multiple variables are involved, they can be written as

At the same time, let

It is concluded that the possibility of local farmers participating in the project P0 is

It can also be written as following.

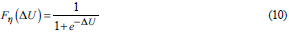
P is the probability value; F η (∆U) is the probability distribution function of ∆U with respect to η. According to the logit model, there is:
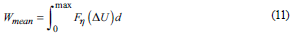
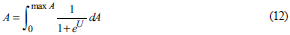
For the model integral, the upper limit of the score is the upper limit of the bidding interval, and the estimated value of the average lower limit of the average lower limit of the willingness of compensation W mean can be obtained:
Where A is expressed as:
Cost of ecological compensation
The use of market theory to calculate the conditions of ecological compensation is very strict, and the establishment of the ecosystem of the ecosystem (Kaiserbunbury et al., 2017) is very difficult. Semi-market theory can determine the criteria for ecological compensation if the market fails to function. The theory is to use the market supply (Zabihollah, 2017) and demand to determine the compensation standard. According to the market theory, there is a corresponding relationship between the quantity and price of goods, and the supply curve and the demand curve are given from the supplier and the demander respectively. According to the theoretical amendments proposed by Mankiw in the principles of economics, the formula is as follows:
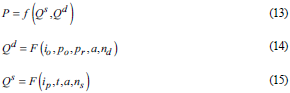
In the above formulas,P is the price; Qs is the supply curve; Qd is the demand curve; io is the income; Po is the price of the relevant product; Pr is a preference; a is expected; nd is the number of demanders; ip is the input; t is technology; a is expected; ns is the number of sellers.
Similar to the market, the determination of ecological compensation standards is also affected by various factors, summed up as formula:

Where, S is the compensation standard; SS is the compensated standard; Ss is the compensator standard; Mac is the macro factor; Mic is the micro factor; ε is the noise (other factors).
Due to the uncertainty and complexity of the macro factors (Zhang et al., 2018) in the study area, there is currently little research on the impact of changes in macro factors on ecological compensation standards. Most of the relevant research is based on microscopic factors (Sun & Ma, 2017). For providers of compensation, the micro-factors (Micd) that affect their compensation criteria include income, preferences, and expectations, which can be reflected by the provider's willingness. For the recipients of compensation, the main influencing factors are income, direct costs, expectations and opportunity costs (Lomas et al., 2018). The first three can be reflected in a willing manner, and the opportunity cost can be used as a basis for determining the criteria. In summary, semi-market theory is based on market theory, and in fact it evaluates the unilateral criteria of providers and recipients of ecological compensation separately. In the end, find the influencing factors and determine the criteria for ecological compensation.
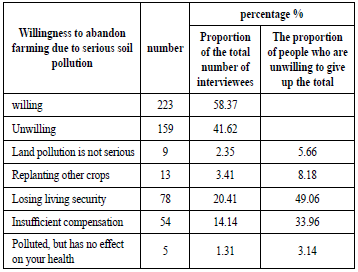
In the investigation of pollution sources, it is known that there are large copper pipe plants, metal material plants and electroplating plants in the research area. Many factories have heavy metals in the waste residue. The survey and analysis of the willingness to abandon contaminated land is shown in Table 2.
Based on the above, the following research priorities are determined: First: The type of ecological compensation is indeed divided. For different types of ecological compensation, specific methods for determining ecological compensation standards were established. Different ecological compensation objects are also classified. According to the different functions of ecosystem services, it can be divided into four types of ecological compensation for biodiversity, carbon emissions, water resources and landscape protection. There are also many projects that combine these ecosystem services to compensate. According to the scope of compensation, it can be divided into global scale, national scale, regional scale and watershed scale. There is no method for determining the corresponding ecological compensation standard for each type.
Second: Based on the three theories (value theory, market theory and semi-market theory), the basic research on the method of determining ecological compensation standards is further strengthened. Among them, the breakthrough point of value theory is to find the appropriate functional relationship to transform the value of ecosystem service function into ecological compensation standard. The difficulty of market theory is how to effectively establish the market and make the standards of ecological compensation self-regulating.
Third, exploring and clarifying the key factors affecting the determination of ecological compensation standards. It is an inevitable trend of ecological compensation standards to determine the standard of compensation by finding one or several specific parameters.
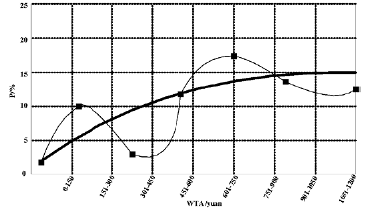
Fourth, with the rapid development of information technology, the study of ecological compensation standards should further strengthen the connection with computers. The WTA distribution feature of the interview area is shown in Figure 4.
Sampling
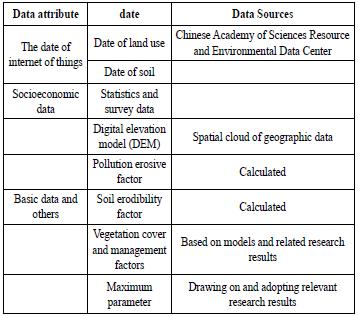
In order to improve the accuracy of the ecological compensation method, the reliability of the survey sampling information increases, as shown in Table 3.
Calculation of new soil retention
Soil retention mainly includes erosion control and sediment retention (Kim et al., 2018). The soil retention is calculated by the soil retention module of the INVEST model, which consists of two main components. The first is the amount of sediment retained by the plot itself, expressed as the product of the uphill sand content and the sediment interception rate. The second is the amount of soil erosion reduced by vegetation cover and soil and water conservation measures (Cunha et al., 2017), expressed as the difference between the potential soil erosion and the actual soil erosion.
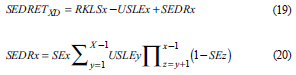
Where, SEDRET XD is the amount of soil retention intercepted by the grid x itself is the amount of sediment retention intercepted by the grid x itself. RKLS x is the amount of potential soil erosion, USLE x is the actual amount of soul erosion. SE x is the interception rate, USLEy is the actual soil erosion amount of the uphill grid y, SE z is the sediment interception amount of the uphill grid z.
The new soil holding amount is obtained by the internet of things data to know the unit soil holding amount after the land use type is changed. In the process of calculation, different forest species (deciduous broad-leaved forest, sparse shrub forest, coniferous and broad-leaved mixed forest, evergreen coniferous forest and deciduous broad-leaved shrub forest) will be produced during the conversion of cultivated land to forest land.
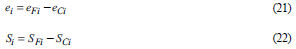
Where, Si is the unit new soil holding capacity, expressed as t/hm; SFi is the soil holding capacity of different forest species per unit area, expressed as t/hm; i represents the soil holding capacity per unit area of cultivated land, t/hm.
The income item sets the planting area, production and selling price of the main crop; the expenditure item takes into account the cost of inputs such as seeds, fertilizers and pesticides. The difference between the income and the expenditure is divided by the planting area, which is the opportunity cost per unit area of land. As shown in equations (23)-(25).
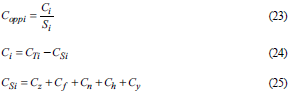
Where C oppi is the opportunity cost amount; Si is a good planting area; Ci is the amount of net income of farmers' cultivated land; Cti is the total income of the crop industry; Csi is the total amount spent on agriculture; Cz is the amount of seed purchase fee; Cf is the amount of fertilizer purchase; Cn is the amount of pesticide purchase; Ch is the total harvesting amount of the main crop; Cy is the total amount spent on refueling agricultural machinery.
Data Processing
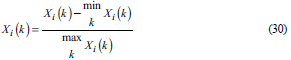
According to the recommended range and value of heavy metals in GB15618-1995 China Soil Environmental Quality Standard, the pollution index of each heavy metal is calculated (Oliveira et al., 2017). Due to the different dimensions of the raw data for each indicator, the magnitude difference is also very different. To eliminate the original data dimension, merge the order of magnitude to make it comparable. The raw data is first preprocessed. Assuming
the sequence
 , the sequence after processing is
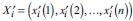 . When analyzing the system, different data can be selected for pre-processing of the original data according to different situations. The main methods of raw data preprocessing are as follows.
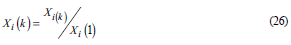
Initial value transformation:
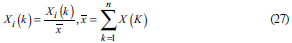
Mean transformation:
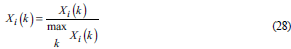
Percentage transformation:
Multiple transformation:
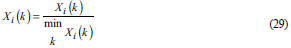
Range transformation
Interval value transformation
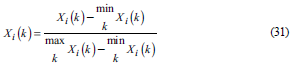
The preprocessed data sequence is

Where i = 0, 1, 2, …, m.
Assume that the compensation indicator based on the internet of things is:

Then

Where, k = 0, 1, 2, ..., n, m is the number of samples; n is the number of pollutions. Then the difference matrix is
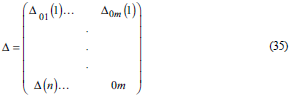
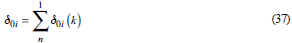
Find the maximum (major difference) and minimum (very small ference) in the difference matrix, expressed by Δmax and Δmin . The correlation coefficient is
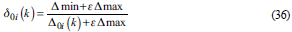
δ in the formula (36) is the resolution coefficient, δ∈ [0,1]. The degree of association is
Based on the internet of things, the calculation of ecological compensation related data has lower requirements on data, and the calculation amount is small, which is convenient for popularization and application. Accurate measurement of new soil holdings is a key issue in the design and evaluation of ecological compensation projects. Compared with previous empirical models, it more accurately reflects the amount of soil retention in different spatial contexts. The internet of things data (Liu et al., 2017) provides quick and timely access to soil and land cover information for the study area.
Results
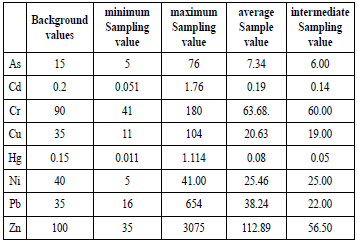
The ecological compensation method based on the internet of things is to change the regional land use type through ecological compensation. It changes the cultivated land to forest land, thereby changing the supply of various ecosystem services such as soil conservation, water supply and carbon sequestration, and achieving the goal of improving the ecological environment. The working schematic diagram of the ecological compensation system based on the Internet of things is shown in Figure 5. The regional background value of heavy metal contaminated soil and the statistical value of the study area are shown in Table 4.
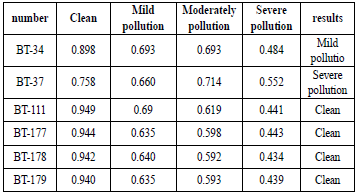
The mass ratio of Cd in soil sample BT-34 was 0169μg/g, and the single factor evaluation reached 2123, which exceeded the moderate pollution index in the national standard. Due to the low mass ratio of the other six heavy metals such as As, the average value of the soil sample is low, and the Nemero index is evaluated as mild pollution. The mass ratio of Zn in soil sample BT-87 was as high as 572μg/g, and the single factor was evaluated as 3136, far exceeding the national standard for heavy pollution. However, the Nemero evaluation index of the soil sample was 21,528, which was evaluated as moderate pollution. In the soil sample BT-111, the mass ratio of Cd was at the critical point of light pollution, and the mass ratios of the other seven heavy metals were all within the clean range, which was evaluated as appropriate for cleaning. However, the Nemero evaluation index at this point was 01857, which was evaluated as mild pollution. The sampling points of soil samples BT-177, BT-178, and BT-179 are less than 3km apart, and the soil pollution levels in the vicinity of more than ten kilometers are clean. However, since the Cd in the soil sample BT-178 exceeded the light pollution threshold of 0104μg/g, it was evaluated as mild pollution, which resulted in a small lightly contaminated area in the spatial interpolation analysis. The degree of pollution is magnified, which affects the correct judgment of local pollution. Through comparative analysis, it can be seen that the gray correlation analysis method (the corresponding soil sample analysis results are shown in Table 5) can more appropriately assess the heavy metal pollution of the samples.
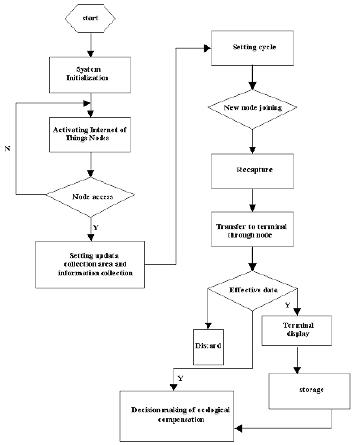
Table 4 Regional background values of soil contaminated by heavy metals and statistical values of study areas
The diversity and complexity of pollution factors in the soil determine that it is difficult to directly analyze the relationship between heavy metal pollution indicators and soil environmental quality. The standard of soil compensation and the amount of soil added in the study area are shown in Table 6.
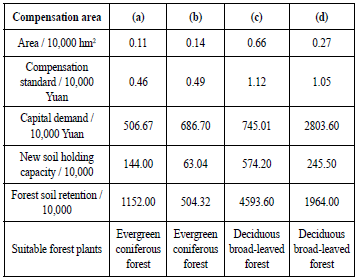
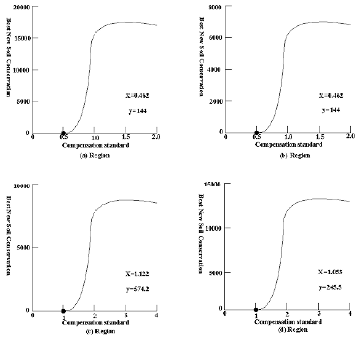
As shown in Figure 6, the four regions (a), (b), (c), and (d) are used as research areas, and the information of the internet of things is processed and extracted based on other information such as the internet of things, land use map, economic data, and basic data. The INVEST model was used to simulate the changes in soil conservation of different forest species before and after returning farmland to forest. The INVEST model was used to simulate the changes in soil conservation of different forest species before and after returning farmland to forest. The spatial distribution of the new soil retention curve for the best forest species was derived using the minimum data method. The relationship between the new soil conservation and the compensation price of the best forest species under different land use conversion ratios was calculated, and the impact of ecological compensation on regional soil conservation was analyzed. With the main goal of increasing soil conservation, the soil in the areas contaminated by heavy metals is all retreated. The best planting species in the research area (b) is evergreen coniferous forest, which needs to be compensated for 0.49 million Yuan/ (hm2,a), and the soil holding capacity can be increased by 630,400 t/a. In 8 years, the soil holding capacity was increased by 5,043,200 t/a. The best forest species in the study area (c) is deciduous broad-leaved forest, which needs to be compensated for 112,000 Yuan/ (hm2,a), and the newly added soil holding capacity is 5,742,200 t/a. The polluted area (d) needs to be compensated for 10,500 Yuan/ (hm2,a), and the newly added soil holding capacity is 2,455,000 t/a, and then the soil holding capacity is increased by 9.64 million t/a in 8 years. In the research area (a), the best forest species is coniferous and broad-leaved mixed forest, which needs to be compensated by 4.6 thousands Yuan/ (hm2,a), and the soil holding capacity can be increased by 7.151 million t/a. In general, the total compensation for the above polluted areas was 178.8319 million Yuan / a, and the total new soil holding capacity was 17.4084 million tons / a.
Conclusions
The proposed method realizes the spatialization and dynamism of quantitative evaluation of ecosystem service functions, and can visually display the spatial distribution and difference of soil conservation in the study area, which is a good choice for ecological compensation research. After years of development, ecological compensation has become an important means of ecological environment protection and heavy metal pollution control in China, but the current ecological compensation model is still too extensive. The internet of things data, the INVEST model and the minimum data method are flexibly utilized. The reasonable ecological compensation project can effectively improve the efficiency of ecological compensation and enhance the sustainability of the project, which helps to achieve visual and refined ecological compensation.

