


 Inglês (pdf)
 Artigo em XML
 Referências do artigo
 Enviar este artigo por email
 Citado por SciELO
  Citado por Google
  Similares em
SciELO
Similares em
SciELO  Similares em Google
 Permalink
Introduction
The pollution of soil and underground water causes many environmental problems. Among all the environmental pollutants, oil and petroleum hydrocarbons have been attracting more attention as global concerns. Soil pollution with petroleum compounds is one of the most prevalent ecological problems. The leakage of petroleum compounds leads to soil contamination and physical and chemical transformations in the soil. This could happen due to the leakage of oil-transferring pipes, worn-out and old petroleum reservoirs, underground and sea oil transmission systems, natural leakages, as well as oil well fires. The amount of pollution depends on soil characteristics and the chemical compounds of pollutants, making it complicated to get removed from the soil. There are different methods for the removal of the contaminants from soil. In general, these methods are divided into three different categories of physical (such as Soil Vapor Extraction), chemical (such as Soil Washing), and biological (such as Phytoremediation). Sometimes, a combination of these methods can be applied (Nathanail & Bardos, 2004; Sharma & Reddy, 2004; Aiban, 1998). In some cases, since soil washing is not cost-effective, petroleum-contaminated soils are used for civil engineering applications like constructing roads. To take the most advantage of the soil, it is essential to precisely study the features and behavior of such soils after contamination. There is no doubt that such actions and features cannot be realized without considering the soil's geotechnical parameters, including Atterberg limits, density, optimum moisture, compaction, cohesion, friction angle, etc. It is not possible to understand the behavior of the structures and their proper designing on the contaminated soil unless all the geotechnical calculations and behavioral parameters of the soil have been explored. Therefore, to achieve an accurate and adequate design, it is necessary to examine different soils and oil pollutants to minimize the probable expenses and damages caused by the geotechnical risks of petroleum contaminated soils. Few studies have been conducted to investigate the physical and chemical characteristics of oil-contaminated soils under natural conditions.
Cook et al. (1992) conducted an analysis to specify the compaction and strength of sands contaminated with oil in the laboratory environment. They reported that, while oil contamination enhanced the compatibility of sandy soils, friction angle decreased. Shin et al. (1997) and Meegoda & Ratnaweera (1994) obtained similar results for sandy and clay soils, respectively. Stewart et al. (2003) discovered that the plasticity features of soil induced changes in clay soil permeability; for example, with a decrease in the plasticity index, the permeability of soil increased. Yong (2000) and Ouhadi & Yong (2006) argued that the liquid limit and plasticity index of/z«e-grained soils were important in using these soils for clay coverage. Khamehchiyan et al. (2007) reported a relationship between decreasing strength, permeability, maximum possible dry unit weight, and Atterberg limit and increasing oil contamination in sandy and clay soils. Al-Sanad et al. (1995) found a decrease in the strength and permeability, but an increase in the compatibility of oil-contaminated sands in Kuwait. Al-Sanad & Ismael (1997) investigated the long-time effect of reducing oil concentration in which the stability of oil-contaminated sands increased over time. According to Jia et al. (2011), increasing the contamination led to a rise in the plastic limit, liquid limit, and coefficient of compressibility in the soil. Kermani & Ebadi (2012) stated that intensifying oil contamination increased the friction angle, maximum possible dry unit weight, the compression index, and Atterberg_ limit, but decreased optimal moisture and cohesion. Also, the long-time effect of contaminants caused more reduction in cohesion but did not affect friction angle. The studies mentioned above showed that the penetration of petroleum contaminants in the soil led to changes in soil properties in different ways. There is an obvious need for more comprehensive studies under natural conditions on the oil compounds released into the environment to obtain their real effects on the soil.
This article aims to investigate the effects of crude oil contaminants on the physical and chemical characteristics of the soil under natural conditions, compared to those in non-contaminated soil samples in the nearby region.
Material and methods
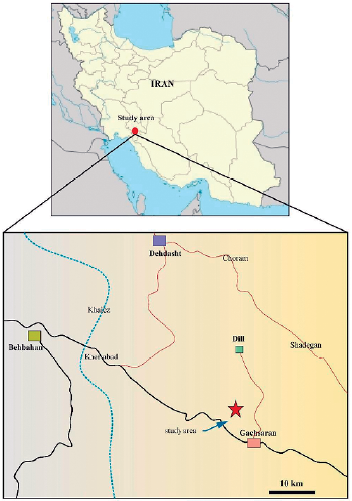
The region under observation is located around Gachsaran city in Kohgiluyeh and Boyer-Ahmad Province at the farthest end of oil-producing zones in Iran, which is about 220 Km to the southeast of Ahvaz (Figure 1). Gachsaran oil field was first studied during 1923 and 1924. Oil production in this field was started in 1937, after drilling some wells and more specifically producing from the well number 3 with an amount equal to 26000 barrels per day. Gachsaran oil field is today one of the five most significant oil-producing areas in Iran, producing 20% of the country's oil. It consists of 10 exploration units, ten gas injection units, three gas refineries, five salt removal units, with 6700 km long oil-transferring pipes.
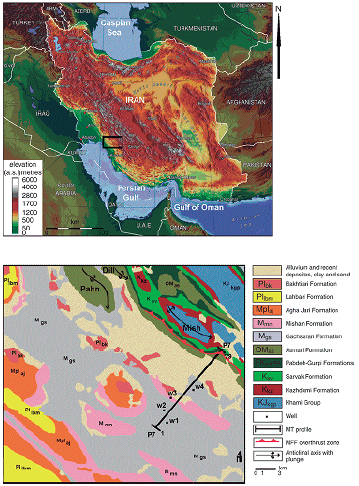
There are 13 oil-producing reservoirs in this corporation, with the total oil production, equal to 470,000, 105,000, and 65,000 barrels per day from Gachsaran, Bibi Hakimeh, and Rag Safid2 reservoirs, respectively. The reservoirs of Bink, Golkhari, Nargesi, Chelinger, Pazenan2, Siahmekan, Gorangan, Solabdar, Rodak, and Khoez rank 4th to 13th, concerning the production volume, respectively. Also, the reservoirs of Kilvar Kerim, Zageh, Chaharbisheh, Mansorabad, and Koohkaki have a total production capacity of 18,000 barrels per day. These reservoirs have been excavated in Kohgiluyeh and Boyer-Ahmad, Bushehr, Fars, and Khuzestan Provinces. Gachsaran oil reservoir is globally the third-largest oil reservoir after Saudi Arabia and Kuwait oil reservoirs. Geologically, the study region consists of Asmari and Gachsaran formations. The most massive oil production is provided by Asmari formation, which is made up of carbonate stones and is the wealthiest reservoir of oil in Iran and the Middle East (Figure 2).
In this study, eight oil-contaminated samples (samples 1, 2, 3, 4, and 5 with CL classification and samples 7, 8, and 9 with SM classification), containing similar oil combinations with different degrees of contamination and two non-contaminated samples (sample 6 with CL classification and sample 10 with SM classification) in a neighboring area with similar geological conditions were selected as the study samples. Also, four regions of 0-500, 500-1000, 1000-1500, and 1500-2000 meters length were selected and categorized as A, B, C, and D. In each region, four samples of soil within 125 meters distance from each other were collected and then were separately mixed. Samples A, B, and D had SM classifications, while sample C had CL classification. The samples were then dried and sifted with a 2mm sifter. Some of the chemical and physical properties of the soil were examined via the following methods: Electrical conduction (EC) using the EC instrument (Sparks, 1996), acidity (PH) using standard ASTM E 7097, Total Petroleum Hydrocarbons (TPH) via Aglient 7890A gas chromatograph with flame ionization detector (Hutchinson et al., 2001), cation exchange capacity (CEC) (Bower et al., 1952), soil classification via the ASTM D 422-63 standard test method, Atterberg limits according to ASTM D 4318, and finally the compaction according to the ASTM D-698 standard.
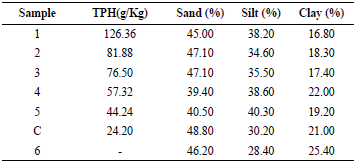
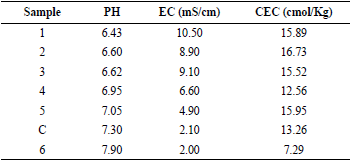
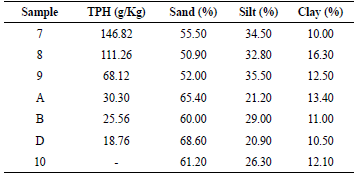
According to the unified classification system, two types of soils in the study area, including silty sand (SM) and clay of low plasticity low-plasticity clay (CL), were detected. The results of gas chromatography (GC), including the percentage of particles in soil samples of CL and SM, along with the physical and chemical properties of CL soil samples are represented in Tables 1, 2, and 3.
Results and discussion
CL soil
Comparing the chemical and physical properties of oil-contaminated soil with those in non-contaminated soil at the refinery revealed excessive hydrocarbon concentrations in oil-contaminated soil, indicating noticeable crude oil contamination in the soil area.
Influenced by the amount of contamination in the soil, soil PH decreases with an increase in the number of pollutants, which can be due to the presence of organic compounds containing hydrogen that can be separated (Laurent et al., 2012). The cation exchange capacity (CEC) in the non-contaminated soil was less than that of the contaminated soil. Also, electrical conductivity in contaminated soil samples compared to non-contaminated ones increased, which could have been due to higher crude oil salts.
As shown in Figure 3, the plastic limit has increased in line with an increase in the contamination. It is higher in contaminated soils compared to non-contaminated ones.
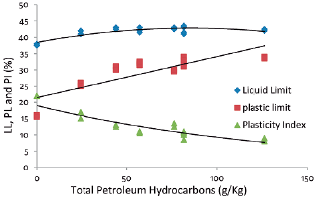
The liquid limit of the contaminated soil was found out to be higher than that of the non-contaminated soil. Still, it was less noticeable than differences in the plastic limit. Increasing the contamination level hasn't made a significant effect on the amount of liquid limit. However, though the liquid limit had a slight decrease in the concentration of 126.36 grams of oil per kilogram soil (g/kg), it was still higher than that in non-contaminated soil.
Over the production years, the refinery has accumulated considerable amounts of oil-contaminated soils. Yet, the duration has been long enough for creating equilibrium between crude oil and the soil. Thus, there can be four conditions influencing the presence of oil in the soil. Some volatile matter in the oil has evaporated due to the sustainability of heat in soil particles and the low thermal conductivity coefficient of clay soil. Some parts of the oil have undergone chemical reactions with the soil, while some others have covered the soil particle surfaces, and the rest settled down in pores of the soil. Since some parts of soil particles are covered by oil, they do not let water molecules reach double layers; thus, more water is needed for the soil to get to the plasticity. However, the portions of water which are unable to access the double layer settle down in the free water layer and increase the soil's liquid limit. This could be the underlying reason for higher liquid and plastic limits in oil-contaminated soils compared to the non-contaminated ones (Estabragh et al., 2016; Kermani & Ebadi, 2012).
According to some researchers, higher liquid and plastic limits in oil-contaminated soils compared to the non-contaminated ones can be due to an increase in the presence of oil contamination in the clay, where the oily material has been absorbed in the clay mineral interlayer space, thus creating enough volume for the water penetration thereby causing an increase in the double layer thickness in clay minerals (Sivapulliah, 1988; Shah et al., 2003).
As shown in Figure 3, the plastic limit of the non-contaminated soil is twice less than that of the contaminated soil. In contrast, the percentage of clay in the non-contaminated soil is 51.2% higher than in the most contaminated soil of the refinery. According to some researchers, the plastic limit of the soil is influenced by the cation exchange capacity, the amount of clay, and the remaining moisture in the soil (Seybold et al., 2008). Therefore, in this study, it is evident that the cation exchange capacity has been more effective than the clay percentage in determining the plastic limit. The highest contaminated soil with low clay percentage has shown more plastic limit than non-contaminated soil with a high clay percentage. In contrast to the results of the present study, the studies by Khomehchiyan et al. (2007) and Lashkaripoor et al. (2010) showed that an increase in the contamination decreased the plastic limit. However, Khoshneshin Langroodi et al. (2010) showed a positive relationship between soil contamination and the plastic limit, which supports the results of the present study.
In contaminated soils, with an increase in the amount of oil contamination initially, the liquid limit increases, but then it decreases. This can be explained according to the double layer theory. As oil is a non-polar solvent, when clay particles are surrounded by it, no double layer of oil and clay is formed, so the moisture increases. However, due to the lubricating property of the oil, water molecules flow smoothly, and less moisture gets to the liquid limit at the end.
Meegada et al. (1994) and Sridharan et al. (2000) mentioned that the soil Liquid limit depends on the percentage of clay in the soil. Thus, there could be two reasons for explaining the decrease in the liquid limit, when the level of oil contamination increases. First, the clay percentage of studied soils in the present research decreases with an increase in the contamination. Second, since crude oil is non-polar and its dielectric constant is lower than that of water, it reduces the repulsion force and increases the gravity force between clay particles and flocculates them (Kaya & Fang, 2000). Therefore, since a significant part of the liquid limit is dependent on the clay soil, due to the flocculation, the amount of clay soil is reduced. In consequence, the liquid limit decreases. Olgun & Yildiz (2012) argued that the existence of oil in soil forces small particles to move towards larger ones. Thus the soil is transformed into grain structure.
In another study, Khamehchiyan et al. (2007) and Rahman et al. (2010) reasoned that the presence of oil around clay particles in the soil reduces the moisture of the soil, as oil gets in contact with the loaded surfaces of clay faster than water, settles down in interlayer space and repulses water. With an increase in oil contamination and clay particles surrounded by the oil, clay particles slide over each other more quickly, and smaller particles get settled among bigger ones to fill soil pores. Thus the soil gets to the liquid limit with less water.
The plasticity index in non-contaminated soil is higher than that in contaminated soil. With an increase in the contamination level of crude oil in contaminated soil, the plasticity index decreases. The plasticity index depends highly on the amount of clay in the soil, and non-contaminated soils contain more clay than the contaminated soils. Therefore, the high clay amount directly affects the plasticity limit and, in consequence, makes the soil change from plastic limit to liquid limit. Another factor in increasing the plasticity index is the percentage of silt in the soil. In sum, based on the findings, it can be concluded that crude oil-contaminated soil should not be used for construction purposes in the refinery zone. Plus, it is suggested that for using crude oil-contaminated soils, appropriate and economic strategies be applied to minimize the contamination.
SM soil
To determine the amount of maximum dry density and optimum moisture content in the silty-sand soils, the proctor compaction test was conducted according to the ASTM D-698 standard. The results are presented in Table 4.
Table 4 The amount of maximum dry density and optimum moisture content based on the proctor compaction test
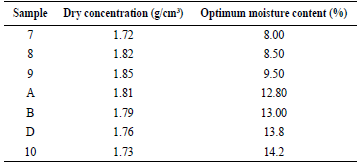
As represented in Table 4, an increase in the crude oil concentration in the soil up to 68.12 g/Kg, increased the maximum dry density with less optimum moisture than the non-contaminated soil. This can be due to the lubricity properties of oil hydrocarbons, making sand and silt particles more slippery. In consequence, more compaction of particles together with a decrease in the friction between sand grains and silt, as well as the closer positioning of grains with each other, cause the number of particles per unit volume to increase.
For the samples 7 and 8, due to a higher level of contamination and lower optimum moisture than other samples, their maximum dry density has decreased. The contaminated soil sample 7 with the maximum crude oil concentration of 146.82 g/Kg has the least optimum moisture and maximum dry density. This could be because, with an increase in the crude oil contamination in the soil, the empty spaces between particles are filled with oil, so less soil content is added into the test mold. Thus the maximum dry density decreases. Also, the high viscosity of crude oil doesn't allow the oil to move easily between the empty spaces, resulting in a decrease in slippery surfaces, which lead to a reduction in the density.
In general, the results of this study show that an increase in oil contamination is correlated with an improvement in the compressibility of grain soils. The present findings are consistent with those obtained by Al-Sanad et al. (1995), according to which an increase in oil contamination in sandy soil up to 4% of the soil weight, led to a decrease in optimum moisture and an increase in the density. However, contrary to the current study, Khamehchyan et al. (2007) indicated a relation between higher oil contamination and less maximum dry density.
Given the percentage of optimum moisture in the non-contaminated soil at the refinery, with an increase in the crude oil contamination up to 30.30 g/ Kg, more oil is absorbed by soil particles, with a small part being flown in the space between particles. Thus, the added water increases slipperiness, and in turn, more compressibility is achieved. At 68.12 g/Kg, compared to the non-contaminated soil, the optimum moisture is reduced by 33.10%, which shows that after the particles have absorbed the oil, empty spaces between particles are filled with oil. Then, less water is required to reach maximum dry density. At 111.26 g/Kg and higher levels, a smaller decrease occurs in optimum moisture, and maximum dry thickness is reduced.
The clay percentage has been effective in the compression of soil samples. The physicochemical behavior of clay in maximum dry density increase in SM soils can be explained as follows. Clay particles are surrounded by oily materials, causing double layers to decrease. After that, an increase in the gravity force between soil particles makes them more compact and flocculated, so the clay's behavior becomes similar to silt and sand. Thus, since clay absorbs more water compared to the silt and sand, optimum moisture is decreased.
Table 5 represents non-contaminated soil sample 10 as well as contaminated soils in which oil is used as the fluid of the proctor compaction test (samples A and D).
Table 5 The amount of optimum moisture and maximum dry density obtained from the proctor compaction test using oil fluid
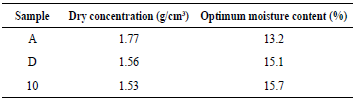
As shown in Table 5, with an increase in the crude oil concentration in non-contaminated soil samples, there is a decrease in optimum moisture, but maximum dry density enhances. The underlying reason is that, due to more lubricating properties between soil particles and less friction force in highly oil-contaminated soil, the particles settle closer to each other, thereby increasing the density. The same results were obtained for samples 10, D and A in the proctor compaction test using liquid water. However, higher maximum dry density and lower optimum moisture were observed compared to proctor compaction test using oil fluid. In fact, as a result of the presence of oil instead of water in the compaction test, the soil becomes more contaminated, so oil is positioned between the soil particles more easily and fills the empty spaces. Consequently, less soil is added to the test mold.
The reason for lower optimum moisture in the compaction test using water fluid compared to the same test using oil fluid in a soil sample with fixed crude oil concentration can be due to lower viscosity of water compared to the oil, where water molecules move easily between soil pores and thus, produce more slippery surfaces.
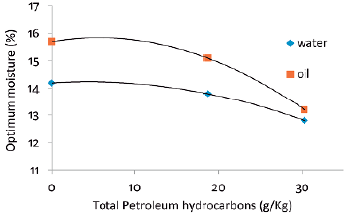
As shown in Figure 4 and Figure 5, with an increase in the contamination level, the difference in maximum dry densities between the compaction test using water fluid compared to the same test with oil fluid decreased. Therefore, in sample A with a higher level of contamination than sample D, maximum dry density in the compaction test using water fluid was more than that in the same experiment using oil fluid by 2.26%. Also, in sample D with a lower level of contamination than sample A, maximum dry density in the compaction test using water fluid was more than that in the same test using oil fluid by 12.82%. Furthermore, in non-contaminated soil (Sample 10), maximum dry density in the compaction test using water fluid was more than that in the same test using oil fluid by 13.07%. Also, with an increase in the crude oil contamination concentration, the difference in optimum moisture between the compaction test using water fluid and the same test with oil fluid decreased. For sample A, the optimum moisture content in the compaction test using water fluid was by 3.03% less than that in the same test with oil fluid. For sample D, the optimum moisture content in the compaction test using water fluid was by 8.61% less than that in the same test with oil fluid. Besides, in the non-contaminated soil, the optimum moisture content in the compaction test using water fluid was by 9.55% less than that in the same test with oil fluid. One justification for this could be that in soils with higher contamination, particles move more easily due to the lubrication property, and less water and oil fluids are needed to get compacted. Therefore, particles in the contaminated soils get maximum dry density with less water and oil contents.
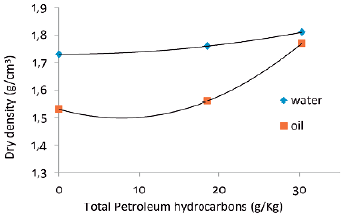
Figure 4 The relationship between maximum dry density in proctor compaction tests using water and oil fluids, and Total Petroleum Hydrocarbons
Conclusions
This research was conducted to analyze the concentration of Total Petroleum Hydrocarbons (TPH) on the Atterberg limit of clay soil (CL), as well as its effect on the maximum dry density and optimum moisture in the compaction test using water and oil fluids for sandy soil (SM). Therefore, contaminated soils, together with non-contaminated soil samples with similar geological conditions, were collected from different locations in the Gachsaran refinery. According to the results, soil behavior is varied and dependent on the amount of soil contamination, i.e., the existence of oil contaminants in clay soils causes an increase in the plastic and liquid limits and plasticity index compared to non-contaminated soils. A significant relationship was found between the plastic limit and cation exchange capacity (CEC). In addition, the liquid limit was found to be highly affected by the clay percentage in the soil. Also, increasing crude oil contaminants in clay soil increased cation exchange capacity and electrical conductivity, but decreased the PH of soil.
Standard compaction tests of contaminated sandy soils (SM) revealed a decrease in optimum moisture and an increase in maximum dry density, compared to non-contaminated soils. With an increase in the oil concentration in the contaminated soils, the soil gets to the maximum dry density with less optimum moisture. With an increase in the contamination concentration by more than 68.12 g/Kg, the maximum dry density decreases. When the oil percentage gets to a certain amount, due to the filling of pores and spaces between particles by oil, less water is needed to get to the maximum density, and thus less soil is added into the test mold.
In the proctor compaction test, using oil fluid, optimum moisture, and maximum dry density for contaminated and non-contaminated soils were less than those in the compaction test using water fluid. Comparing the results obtained from the compaction test using oil fluid versus using water fluid in different samples showed that optimum moisture and maximum dry density were lower in the compaction test using oil. Increasing the crude oil concentration in the non-contaminated soil decreased the 9.55% optimum moisture difference between the compaction test using oil fluid versus compaction test using water fluid to 3.03% in sample A. Moreover, increasing the crude oil concentration in the no-contaminated soil decreased the 13.07% maximum dry density difference between compaction test using oil fluid versus compaction test using water fluid to 2.26% in sample A. When the percentage of the oil concentration is high due to lubricating properties, the particles move on the surface of each other more easily; thus, less water or oil is needed to get to the maximum dry density.

