Introduction
Recently, the trend of environmental conditions deterioration of our country has not been improved, especially for the water environment pollution (Shi et al., 2017). Hundreds of organisms have been detected in main rivers, lakes, and reservoirs in China, and some water areas have been severely polluted by the organisms. The increasing trend is shown in the national water source pollution. Nearly 90% of urban water is contaminated severely, while water quality of water sources of 50% of principal towns is substandard. The water pollution has deteriorated from east to west, extended from tributaries to trunk stream, spread from city to village, permeated from the earth's surface to underground, and diffused from area to watershed. According to statistics, there is universal organic pollution in main rivers in China, and the non-point source pollution is increasingly outstanding (Wang et al., 2018). The Liaohe River and Haihe River are polluted severely. The water quality of the Huaihe River is reduced, while the one of the Yellow River is not optimistic. The water quality of the Songhua River is not bad, while the one of the Zhujiang River and the Changjiang River is right in total. Organic pollution of surface water of seven river basins is universal, and water quality of 58% of fracture surfaces in the trunk stream of each drainage basin belongs to IV grade. In contrast, one of 22% of the fracture surfaces belongs to IV grade and 20% to V grade or inferior V grade. Lake pollution in China is also severe. The water body of most lakes is eutrophication. Mainly, the contamination levels in Taihu Lake, Chaohu Lake, and Dian Lake (the Sanhu for short) are the most serious. For years, the pollutant discharged into the lake from the non-point source pollution on land and factory sewage increases with the rapid development of the economy and growth of population, which results in increasingly outstanding water environment problems of the Sanhu. In addition, many lakes that are close to the populated regions such as cities and towns have been degenerated into the wastewater reservoir in the drainage basin, especially for the dirty pond and stream of the village, which is alarming.
To control the worsening trend of environmental degradation, the decision of the State Council on several issues of environmental protection requires the prevention and control of water pollution in river basins. The total quantity control of critical pollutants and the verification system should be implemented according to the law for the water bodies whose discharge of water pollutants has reached the standard but cannot meet the water environment quality standards stipulated by the state. The total control of water pollutants is mainly based on environmental statistics (Ge et al., 2017), supplemented by measures such as pollution declaration and registration to verify the current situation of regional water pollution and discharge. Based on the pollution type, according to requirements of specific water environment quality target and water quality target of boundary section, local environmental capacity, economic development scale, pollution control technology, environmental management level, and other factors are considered synthetically to reckon the maximum discharge of pollutant allowed by the target of water environment quality. According to the different geographical locations, technical level, pollutant discharge quantity, and pollution control capacity of each source, the responsibility of pollutant reduction is optimized and coordinated. Also, the permitted emission pollutant index and reduction quantity are limited in the form of pollutant discharge allowance to achieve the target of water environment quality finally.
There have been some reports on the research of total emission control. A heuristic method has been used to research pollutant control. The method mainly uses dynamic programming algorithms, which are particularly attractive in this respect. However, the code of dynamic programming is complex, which needs many computer resources. In addition, using algorithms based on mathematical programming still exists resistance in practical application. Therefore, there is a certain difference between theory and practice (Wang et al., 2017) in the system analysis of water quality management. According to the probability restriction condition, the method researches the problem via the optimization model and describes an optimization model that can reflect the uncertainty of water quality. The adopted technology is the chance constraint plan, where the certainty equivalent replaces the probability restriction in optimization problems of water quality. First-order uncertainty analysis is used to represent the intrinsic uncertainty of random factors (Mohamad & Boumahdaf, 2017). The total amount of the polluted water was controlled via a linear programming model.
In the condition of lateral mixing and variation in river flow generated by tributary confluence with different pollutant levels, the optimization assignment model of the garbage load of the drainage basin is proposed. On the premise of meeting the water quality environmental standards of the water intake along the river, the model regards the flow of the river system as a random variable. It is applicable to the river where three tributaries converge at the same point. The flow frequency of the flow group obtained by the statistical method represents the flow frequency of the basin approximately. The priority of sewage treatment transfers from one tributary to another tributary (Huang et al., 2017). However, in general, these control methods are still immature and imperfect. Further research and discussion are still needed.
This research applied the fuzzy mathematical method (Li et al., 2017) to carry out a preliminary attempt for the comprehensive evaluation of water quality (Brix et al., 2017). The measured value reflecting various problems of water quality pollution was translated into the quality value, which indicates superiority and inferiority of water quality via function relationship. Our method considered the fuzziness of the boundary line of the water quality and overcame the insufficient clearness in other evaluation methods of water quality pollution. Therefore, the comprehensive evaluation method of fuzzy mathematics is more scientific while evaluating the water quality pollution in various regions. This article used the weight matrix and membership relation to build the model of water quality (Gao et al., 2019). The total quality of the contribution of sewage exits was used to calculate the allowable discharge capacity of each sewage exit (Molinos-Senante et al., 2017), which would improve the total amount of pollution discharge.
Overall control frame and primary function
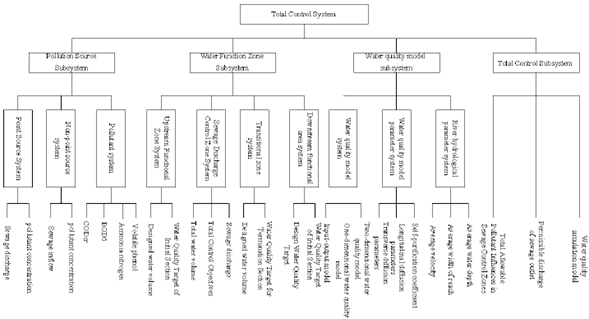
The control frame of the total quantity is comprised of numerous indexes. The control frame is divided into four sub-domains to facilitate the analysis, as shown in Figure 1.
Each subsystem was analyzed via the regional analysis method as follows.
(1) The subsystem of the pollution source
The subsystem included point source system (Eckley et al., 2017), surface source system (Fan et al., 2018), and pollutant system. The pollutant system included indexes such as CODcr (Chen et al., 2017), BOD5 (Bodiga et al., 2017), ammonia nitrogen, and volatile phenols. As the pollutant of total quantity control, it could be selected from the standard-exceeding pollutant of water quality according to the requirement of plan and management.
(2) The subsystem of water function zone
The subsystem included systems of the zone of sewage discharge control, upstream functional zone, transitional zone, and downstream functional area. The zone of sewage discharge control was the river reach where the pollutant from sewage draining exit and surface source were converged intensively. The zone of sewage discharge control was the vital zone for total quantity control of the received pollutant water and the sewage-draining exits, and the complete quantity control was conducted in this zone. The scope of this zone was 100m~500m of upstream from the first sewage exist, namely taking the termination section of its upstream function zone as the starting section and the section where the pollutants discharged from the sewage outlet were mixed with the river water as the termination section. In the control zone, there were not only physical processes of dilution and diffusion of pollutants, but also the processes of chemistry, optics, and biology self-purification (Wang, 2019).
The transitional zone was set up to ensure the pollutants discharged from the sewage control zone could satisfy the water quality target of the next functional region after being diluted and self-purified by the river. The starting section of this area is the termination section of the sewage control area, while the termination section is the starting section of the next function area. If the distance between the termination section of the sewage control area and water intake of the following function area is within 2000 meters, the transitional zone did not have to be set, and the termination section of the sewage control area could be placed at the starting section of the downstream functional area. The migration and transformation process of pollutants in this section was mainly the self-purification. The starting section of the upstream functional area was the section that is 1000m from the first water intake in the upstream region, and the termination section was the one that is 100m~500m from the first sewage exit in the upstream sector. The river reach is the pollutant input area of the sewage control area in the upstream region. The scope of the downstream functional area was the river reach that is below 1000m from the first intake in the upstream of the downstream of the transitional zone. The target of water quality control of the initial section of this area was an essential basis for calculating the total afflux amount of pollutants allowed to enter the sewage control area.
(3) The subsystem of the water quality model
The subsystem included water quality model, parameters of the model, and hydrological parameters. The water quality model was built via the fuzzy mathematical method. The model mainly included the input and output mathematical model, one-dimensional mathematical model, and a two-dimensional numerical model that could reflect the input response relationship between pollution sources and water quality targets (Abubakari, 2017). In conditions of inflow of tributaries, the two-dimensional analytical model and the input and output model were used for the upstream function area of the sewage control area while the two-dimensional model for the transition area (Yao et al., 2017). If the pollution control area was conditional, the numerical solution of a two-dimensional partial differential equation could be carried out for the analog computation of water quality. Parameters of the water quality model included a longitudinal diffusion coefficient, transverse diffusion coefficient, and self-purification coefficient. The longitudinal and transverse diffusion coefficients were calculated via empirical formulas according to hydrological parameters, and the self-purification coefficient was calculated via the measured data of hydrology and water quality or simultaneous monitoring data of water quality and water quantity. River hydrological parameters included average flow velocity, average river width, average depth, and design flow.
(4) The subsystem of total control
The subsystem was composed of the total amount of pollutants allowed to flow into the sewage control area, the allowable discharge capacity of sewage draining exit, and the simulation model of water quality. The simulation model of water quality was composed of the mathematical model established after parameter estimation. Analog computation was carried out for the transition area and sewage control area via the transformation model of one-dimensional and two-dimensional models while the upstream function area via the input and output model directly. The analog computation was carried out for the concentration of the pollutant of the termination section in the sewage control area via the transformation model of the one-dimensional model using the control target of water quality of the termination section in the sewage control area as the basis of calculation. Then, the concentration of the pollutants was multiplied by the designed water quantity of this river. Thus, the total amount of contaminants allowed to flow into the sewage control area was obtained. The contribution of pollutants from the upstream functional area in the sewage control area to the termination section was subtracted, the total amount of contaminants allowed to flow into the part of the sewage control area and the allowable discharge capacity of sewage draining exit was obtained. Then, the allowable discharge capacity of each sewage-draining exit was calculated via the transformation model of the two-dimensional model and hydrological parameters under the condition of design water quantity.
Method and procedure of total quantity control
The total quantity control work starts from the survey of regional water environment and ends up with the water resources protection plan. As shown in Figure 2, the entire process consists of seven workflows.
Survey of regional water environment
The survey mainly investigated the distribution of sewage exits, the distance between sewage exits, the discharge of wastewater, and the types and concentrations of pollutants. Intake quantity of water of each intake, intake time and intake location were also investigated. To determine the major regional water pollutants, the regional water quality was investigated and evaluated. The function of upstream and downstream reach of sewage exit was surveyed. So were the distance between the last sewage exitand the first water intake of downstream reach, the water quality control target of the functional area, and the hydrological characteristics of the regional reach. According to the requirement of compilation of total quantity control, the investigation data were classified systematically. The pollutants of total quantity control were determined, So were the water quality mathematical model adopted by total quantity control, water quality simulation scheme and total quantity analysis method and the total quantity control scheme was put forward. According to the function of the total quantity control area, the river reach in the area was divided into sewage control area and transition area, and the scope was determined. Meanwhile, the scopes of upstream reach of the sewage control area and downstream reach of the transition area were determined. So were the function of water and the target of the water quality control.
Fuzzy mathematics method to control the water pollution
The work plays a key role in establishing the input response relationship between pollution sources and the target of water quality control. The fuzzy mathematics method uses the weight matrix and the maximum membership principle to consider the factors or main factors related to the evaluated things and carries out the total quantity control for the factors.
Comprehensive judgment of the fuzzy mathematics method
The membership function is the precondition for building the fuzzy mathematical model. To select a model truly reflecting the self-purification law of pollutants in the water body is very important using the "lower semi-trapezoidal fuzzy number", "triangle fuzzy number" and "upper semi-trapezoidal fuzzy number" as the gist for building membership function. Generally, the model is selected as the following principles. The model is selected according to the needs of dilution and diffusion, self-purification process and total quantity control of pollutants in water. The dimensions of the selected model are determined according to the existing hydrological data, water quality data, and the difficulty of evaluating parameters in the model. The model should be strived to be simple, applicable, with clear physical concept, and simplified according to the actual situation; the application conditions, application scope, advantages and disadvantages of the model should be understood in order to make the model have a good simulation property.
According to the protection target and the purpose of water area use, integrated with the "groundwater quality standard" (Read et al., 2017) (GB 3838-2002), the membership function of water quality evaluation is divided into 5 categories by function.
I Class is mainly applicable to the source of water and state reserves, while II class applicable to the first-grade protection zone of centralized drinking water source, habitat of rare aquatic organism, fish protection zone, spawning ground of fish and shrimp, feeding ground of larvae, etc.
III Class is suitable for the second-grade protection zone of centralized drinking water source, wintering ground of fish and shrimp, migration channels, fishery waters and swimming areas of aquaculture.
IV Class is applicable to general industrial water zone and general industrial water zone and recreational water zone that is non-direct contact with humans, while V Class applicable to agricultural water zone and water zone with general landscape requirements.
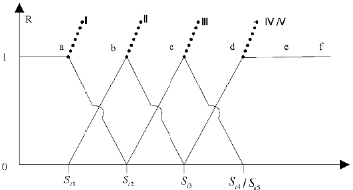
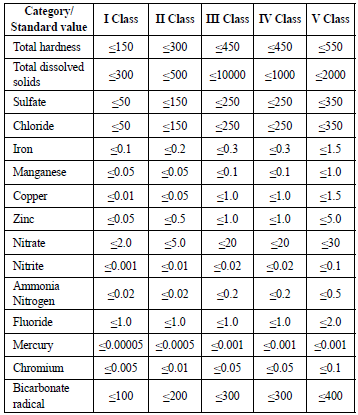
Corresponding to functions of the above five categories of water areas of surface water, fundamental items of environmental quality standards of surface water were divided into five categories, The corresponded standard values of the categories were carried out for different functional categories respectively. The standard value with higher functional category of water area was stricter than that with lower functional category. If the same water area had multiple use functions, the standard value corresponding to the highest function category was performed. It was the same meaning to realize the function of water area and reach the standard of function category. As shown in Fig. 3, Membership functions of index factors the polluted water was built according to the classification standards of water quality. It could be seen from the classification standard of single quality of the polluted water (Table 1) that standard value of IV class and V class water quality was a critical value (namely the standard values of Si4 and Si5 were equal, that were critical values of IV class and V class water quality). In fact, they were only distinguishing value and the transition from IV class to V class was absent, resulting in the repetition and discontinuity of the membership function. Parts of evaluation results of water quality were V class, however belonged to IV class actually. It was obvious that the water quality evaluation could not build the membership function (Si4-Si5=0), leading to distortion of the evaluation result. In view of the membership function with IV-grade connection degree was symmetric about xi = Si4, it was modified via triangular fuzzy number, restraining Si4 - Si5 = S4 - Si3, which could build the membership functions of water quality of IV class and V class.
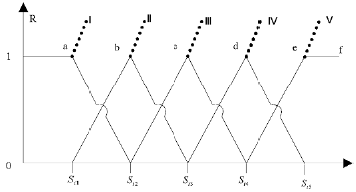
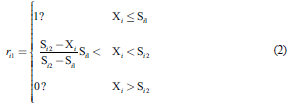
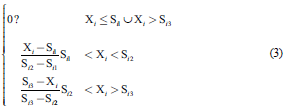
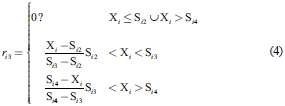
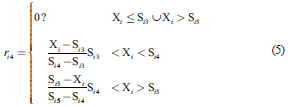
The relationship of subordination of I - V type of water quality was continuous via the modified membership function (Fig.4) and conformed to the evaluation standard of the "groundwater quality standard" (GB/T 14848-93). The expression of the modified membership function was shown in Formulas 2-6.
A set of pollution factors for a given section was known μ = {μ1; μ2,···, μn},where elements μ;(i = 1, 2,···, n) were factors influencing the evaluation object. Usually the importance of each factor was different, hence a corresponding weight a i (i = 1, 2, ..., n) should be given for each factor μί.
Element ai is an important degree of membership of factor Therefore, weight set A is a fuzzy subset of factors μ. General evaluation sets V = {V x ,V 2 ,...,V m } was established. The elements Vj (j = 1,2,...,m) were various possible evaluation results, which could be fuzzy or non-fuzzy, but the relationship to "V" was clear. The evaluation started from a μί to confirm the degree of membership rij (j = 1,2,..., m) of the evaluation object to the element Vj of the evaluation set, which was called single-factor fuzzy evaluation. Evaluation result R of the factor μi was the single-factor fuzzy evaluation set. When μi belongs to the I class, the expression of membership function was shown in Formula 2.
When μi belongs to the II class, the expression of membership function was shown in Formula 3.
When μi belongs to the III class, the expression of membership function was shown inf Formula 4.
When μi belongs to the IV class, the expression of membership function was shown in Formula 5:
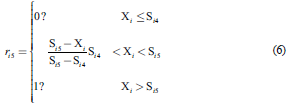
When μi belongs to the V class, the expression of membership function was shown in Formula 6:
Si1, Si2, Si3, Si4 , Si5 in Formulas 2-6 corresponded respectively with the standard limiting value of I,II, III, IV, V grades in water quality standard, where S ¡5 = S ¡5 + |S¡ 4 - S ¡5 | . The xi was the measured value of sampling point in the research area and r a , r i2 , r a , r ¡4 , r i5 were degree of membership of III, IV, V class water.
Degree of membership R = (r i1 , r ¡2 , r i3 , r ¡4 , r ¡5 ) of factor μi to evaluate V was confirmed via the fuzzy mathematics. Expression of fuzzy relationship from U to V was defined as R ¡ = {R i1 , R i1 ,···, R i1 }y, (j = 1,2,...,n), which is further expressed via matrix representations as Formula 7 shows.
It is obvious that the fuzzy evaluation of single factor only reflects the influence of one factor on the evaluation object, but does not reflect the comprehensive influence of all factors. So the comprehensive evaluation result cannot be obtained. Therefore, the influence of all factors must be considered comprehensively, which is called fuzzy comprehensive evaluation. The set of comprehensive assessment R is the fuzzy subset of the V, which can be expressed as follow:
where
 = 1,2, ... , m,, m is the evaluation index. It considers the influence of all factors comprehensively.
Obviously, the line i of B represents the influence degree of ifactor staking each evaluation element on the evaluation object. The column J represents the degree of all factors taking i evaluation element on the evaluation object. Hence, each column element is multiplied by the corresponding factor weight (i = 1,2,..., n), which more more reasonably reflect the comprehensive influence of all factors.
Establishment of water quality model and calculation of evaluation results
Given the condition of {U, V,R} evaluation space, operational rule was built via weight matrix W and membership relation matrix R. Thus, the membership matrix Y of fuzzy comprehensive relation between evaluation object of water quality and each evaluation order was obtained as shown in Formula 9.
where Y was the comprehensive evaluation results. Θ represented the operational rule. c l , c 2 , … , c j ( j = 1,2,3,·--, n)was the membership degree. Common fuzzy operational rules are the type of main factors determine the I type of main factors highlighted, the II type of main factors highlight, type of weighted average model, which were shown from Formula 10 to Formula 13.
(1) Main factors determines
Formula 10 adopted the principle of "small to large" operation, namely the weight matrix W took the minimum value from the evaluation element (index) corresponding to each column in the membership relation matrix R, then took the maximum. The advantage of the algorithm is to remove the repeated factors in membership degree and weight index. Therefore, it avoided the repeated consideration of the membership degree and weight of indexes to take the minimum value first, which highlighted the role of extreme value.
(2) I type of main factors highlight
Formula 11 adopted the principle of "multiply to take the maximum", namely the weight matrix W took the minimum value after multiplying the element corresponding to each column in the membership relation matrix R. The algorithm not only considered the interaction effect of index membership degree and weight on evaluation results, but also highlighted the role of extreme value.
(3) II type of main factors highlight
Formula 12 adopted the principle of "adding small values ", namely the weight matrix W took the minimum value from the element corresponding to each column in the membership relation matrix R, then added together. This algorithm removed the important factors in the membership degree and weight of the index. However, the overlapping budgets might cover the influence of the maximum pollution index on groundwater. When the concentration of some indicators was particularly large, the comprehensive evaluation results were unreasonable.
(4) Type of weighted average model
Formula 13 adopted the principle of "multiplication and addition", namely the weight matrix W multiplied the element corresponding to each column in the membership relation matrix R, then carried out a linear weighted average. The algorithm reflected the comprehensive influence of all factors, which was a comprehensive evaluation with a membership weight type in fact.
The establishment of weight matrix plays an important role in building water quality model, which directly affects the application of model and the calculation result of total quantity control. To construct the weight matrix, the tracking and monitoring data of water mass should be obtained and proceeded according to certain methods, which requires a large amount of time and funds. It is difficult in establishing the process of the protection planning of water resources. In condition of the limited funds and time, establishment of the weight matrix and regression method can be used to estimate the parameters.
Due to different importance degrees of μ ί (i = l,2,3, - , n) in the comprehensive evaluation of water quality and environmental quality in subset U, such as function, contribution, and influence, the index factors participating in the evaluation should be weighted. Different weights influence the evaluation results in varying degrees. There are two major methods for weight definition, subjective weighting method and objective weighting method. The latter is usually used in practical evaluation. Our research used the method of rate of pollution contribution to confirm the weight. It is a dynamic/variable weight method, which can not only highlight the impact of major pollution indexes, but consider the comprehensive impact of individual pollution indexes on the environment. The weight calculation was shown in Formulas 14-16, concretely.
In Formulas 14-16, xi is the measured values of water quality samples in the research area. Sij is the standard limiting value of I,II, III, IV, V grade in water quality standard and wi is the weight of underground water indexes in different places obtained by normalization.
Confirming the target of water quality control
The main purpose is to determine the target of water quality control of the functional areas in the upstream sewage control area and downstream transition area. The determination of the target of water quality control is mainly based on the river function and management requirement of total quantity control. Therefore, it has certain timeliness.
Calculation of discharge total amount allowed in the control area
According to the water quality control target and designed water quantity of the initial section of the downstream functional area of the transition zone, the pollutant concentration value of the final section of the sewage control area was calculated via the water quality model. The concentration value was multiplied by the designed water quantity and the discharge total amount was obtained. The required designed water quantity, river width, average water depth, river velocity and other parameters could be calculated according to the established relevant model and hydrological calculation methods. According to the total amount of allowable pollutant discharge, the established water quality model was used to calculate the allowable pollutant discharge for each sewage exit. According to the development of control section, pollution control situation, sewage discharge and water pollution treatment situation, through the actual data of the specific control unit, the maximum allowable discharge of control unit, COD discharge and concentration of each point were calculated.
Total discharge amount (Q)=Total quantity (Q ottaJ ) X Fuzzy evaluation matrix (R) (17)
Examination of method
The total quantity control scheme was examined. If there is any shortage, adjustment should be carried out for the design of control scheme or target of water quality control and calculation should be proceeded by a working routine until the results are satisfied. The achievement was brought into the program of water resource protection.
Simulation experiment and results
The main technology of total quantity control is to establish the water quality model via fuzzy mathematical method, and to calculate the total quantity of pollutants allowed to flow into the sewage control area and the allowable total quantity of sewage outlets. This paper takes the pilot project of total quantity control in the water function zone in a certain area as an example to illustrate the main technical methods of total quantity control.
General situation of region water environment
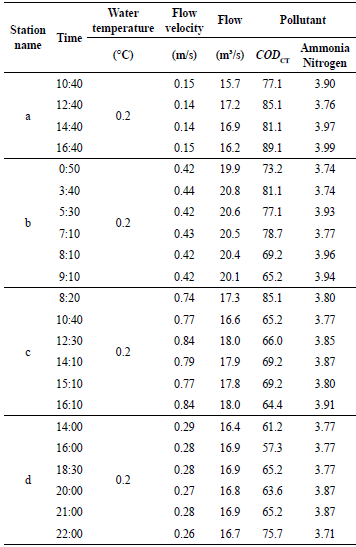
The river section in this area is 98 kilometers long, and there are hydrological and water quality stations on the main stream. The monitoring data of the hydrological and water quality station are shown in Table 2.
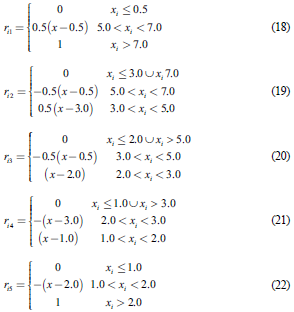
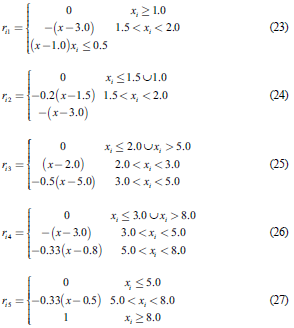
There are many tributaries in the middle of the river and 5 sewage exits. The length of sewage exits is 3.2 km. The calculation and comprehensive evaluation results of the membership function based on the fuzzy mathematics were shown as follows. The membership functions of each grade water are shown from Formula 18 to Formula 27.
There are many tributaries in the middle of the river and 5 sewage exits. The length of sewage exits is 3.2 km. The calculation and comprehensive evaluation results of the membership function based on the fuzzy mathematics were shown as follows. The membership functions of each grade water are shown from Formula 18 to Formula 27.
Membership function of BOD to each grade water
The membership functions of other comment factors to each grade water are analogized in order.
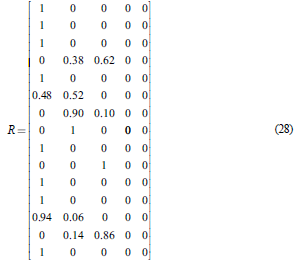
According to the above membership calculation formula, membership functions of each evaluation factor for 5 grades are established to obtain membership degrees respectively. The single-factor evaluation matrix R is established:
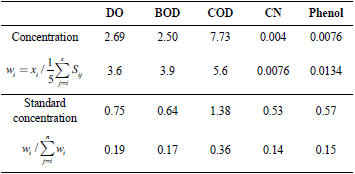
According to the above weight calculation method, the normalized weight matrix W is established after normalization. The results are shown in Table 3.
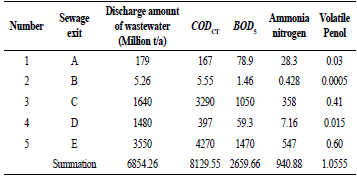
As shown in Table 3, Y = 0.3855 and comprehensive evaluation grade is ri3. It means that the level of water quality in the region is III grade. The main pollutants are CODcr, BOD5, ammonia nitrogen, and volatile phenol, which are all the non persistent pollutants. The discharge of the above pollutants from the five sewage exits in this area is shown in table 4.
Experimental procedure and results
Step 1: Total amount of pollutants allowed to follow into the sewage control area
The total amount of pollutants allowed to import into the sewage control area refers to the total amount of pollutants allowed to import into the termination section of the sewage control area. Based on the concentration index of regional water quality control, the pollutant concentration was calculated via the established model. Then, the concentration was multiplied by the design of water to obtain the total amount of pollutants. The target of water quality control in the region is III class water. Thus, the concentration of CODcr is 15 mg/L. The concentration of ammonia nitrogen is 0.5mr/L. According to the calculation, the concentration of CODcr of the section is 15.96 mg/L, while the ammonia nitrogen is 0.503 mg/L. The calculation concentration is multiplied by the designed water quality (7.47m3/s). The allowable total amount of CODcr is 3759.8 t/a, while the ammonia nitrogen is 118.5t/a.
Step 2: Quantity allocation of allowable pollutant discharge of sewage exit
The total amount of pollutants allowed to flow into the section consists of two parts. One part is the amount of pollutants discharged from estuary to the section, and the other part is the amount of pollutants discharged from the five discharge exits in the sewage control area. In the calculation of the quantity allocation of allowable pollutant discharge, the amount of pollutant imported from the first part should be subtracted, and the rest is the total contribution of the discharge exits. Then the total contribution amount of each exit is used to calculate the allowable discharge amount. The specific steps are as follows:
(1) contribution of the imported pollutants to the pollution at the section
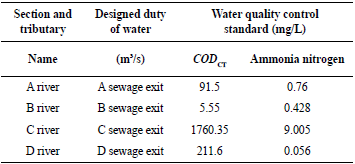
For the pollutants afflux of non-point source discharge, there are only four rivers containing the pollutants, which are named as A, B, C, D respectively. The pollutants and river water have been mixed evenly at this section. The targets of water quality control of the section of main stream estuary of A river and D river are II class while the one of B river and C river are III class. The standards of water quality control and designed duty of water are shown in Table 5.
The pollutants in this section are mainly self-purification process and the mixing process after the import of tributaries. When the tributaries flow into the main stream, the concentration of the pollutants after the afflux is calculated via the model. When there is no tributary inflow, the model is used to calculate the self-purification process of pollutants. The data in table 3 are substituted into the model. The pollutants concentration value of the termination section of the sewage control area is calculated via the water quality model. The concentration value is multiplied by the designed water amount of the section, which is the total amount of pollutants allowed to import into the sewage control area. After computation, the contribution concentration of CODcr is 4.94mg/L and the contribution amount is 1163.7t/a. The concentration of ammonia nitrogen is 0.4mg/L, and the contribution amount is 94.23t/a. The total contribution of CODcr from the sewage exits is 2596.1t/a and the concentration was 11.02mg/L. The total contribution of ammonia nitrogen is 24.27t/a and the concentration is 0.103mg/L.
(2) Quantity of allowable pollutant discharge of sewage exit
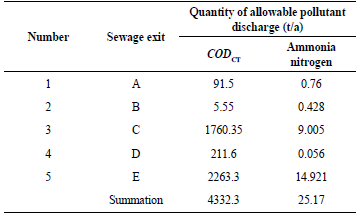
According to the total contribution of pollutants from the discharge exits at the section and the proportion of pollutant discharge from each discharge exit in the total discharge, simulation calculation is carried out for the water quality via the transformation formula of the established water quality model, and the allowable pollutant discharge amount of each discharge exit is obtained respectively. The calculation results are shown in Table 6. It can be seen that the control results are improved apparently.
Conclusion
(1) The framework and functions of total quantity control are analyzed, and the workflow and technical method of total quantity control are put forward, which is of practical significance for the current work of water resources protection planning.
(2) The comprehensive evaluation method is normative and applicable, and the existing hydrology and water quality data can be used to evaluate the water quality, which has good practicability.
(3) The membership function and weight value are used to establish the water quality model to calculate the allowable discharge amount of pollutants from the sewage exit. And the existing hydrology data are used for calculation. The method is used in the calculation of the allowable discharge amount from the sewage exit for the first time, which is simple, applicable and highly simulated.
Total amount control of pollutant is to make a control plan and allocate total amount of pollutant after in-depth investigation and research and application of scientific method. To some extent, it is the dynamic planning of regional pollution sources, scientific, quantitative and standardized management of pollution sources, rational use of environmental capacity, and reducing pollution pressure to ensure the realization of regional environmental quality goals. Fuzzy comprehensive evaluation is comprehensive, concrete, objective and scientific in comprehensive evaluation and planning control of main pollutants judging and pollution trend tracing. It can be seen from the calculation results that the method can integrate the specific situation and characteristic, and has excellent accuracy and adaptability. It can be applied to the control of water pollution extensively.


