


 Inglês (pdf)
 Artigo em XML
 Referências do artigo
 Enviar este artigo por email
 Citado por SciELO
  Citado por Google
  Similares em
SciELO
Similares em
SciELO  Similares em Google
 Permalink
Introduction
Lava landform is also called Karst landform. Karst geomorphology refers to all kinds of landforms formed by dissolution, transportation, and sedimentation of soluble rocks (limestone) by water, such as stone buds, stone ditches, stone forests, peak forests, falling water caves, funnels, karst depressions, karst caves, underground rivers, etc. (Masiokas et al., 2017). In the karst geomorphological development area, the ground is often crowded with odd peaks, the surface water system is relatively scarce, but the groundwater system is relatively developed (Jian et al., 2017). Guangxi, Guizhou, Yunnan, and other places in China widely distribute Karst landforms, which is one of the most typical Karst landforms in the world (Zhu, 2018).
Engineering geological survey, geophysical prospecting, and drilling are mainly used in the geological exploration of lava area, in order to obtain the relevant information of lava landform, development degree, development law, hazard nature and geological activity law of highway section (Gu et al., 2017). The first is the lava survey of the highway subgrade section. When the lava geomorphology is located on both sides of the highway subgrade, through the investigation and information collection of the direction of surface water runoff, the estimation of water volume, the development degree of surface karst groove and the scale of karst depression in a certain area on both sides of the subgrade, the development degree of lava in this area is determined, and then targeted drilling is arranged to reveal the buried depth of karst cave through drilling. The safety thickness of the lava roof can be obtained by the roof and floor thickness and filling species, which can provide corresponding excavation and filling parameters for highway subgrade construction. Next is the lava survey in the bridge area (Zhao et al., 2017). When the bridge crosses the lava area, through the geological survey in a certain range of the bridge site area, the data of surface water runoff direction, water flow, the development degree of surface dissolution ditches, the scale of dissolution depression, the development degree of bank slope dissolution on both sides and underground rivers are obtained. According to the characteristics, the related data such as drilling hole encounter rate, the vertical height of karst cave and depth of roof and floor are further obtained to determine the development degree of lava in the bridge site area and to provide the basis for the elevation design of bearing stratum of pile foundation (Wu et al., 2018). Finally, it is the tunnel lava survey. Generally speaking, it is more difficult to survey tunnels in the lava area, and the safety problems in later construction and operation are more prominent. Therefore, the investigation of tunnels in the lava area, especially long tunnels, is the focus of tunnel lava exploration (Liu, 2017). Firstly, engineering geology survey and hydrogeology survey are used to make a detailed investigation of surface water runoff direction, spring outcrop, surface dissolution depression and falling tunnel in a certain range of tunnel site area to draw engineering geology map and hydrogeology map and to preliminarily determine the relationship between surface water and groundwater, runoff model and fault structure (Kugler, 2017). Then geophysical exploration and drilling methods are used to further determine the relationship among the underground lava pipeline, underground river, karst cave, and the design cavern, and the connectivity and water flow of the underground river of lava pipeline are determined by means of connection test analysis. The surrounding rock of the cavern and the water inflow after excavation are accurately classified to provide reliable geological parameters for the design (Wang et al., 2018).
Monitoring is widely used in a safe city, railway monitoring, bank monitoring, warehouse monitoring, construction site, and other occasions because of its intuitive, accurate, timely, and rich information content (Khan et al., 2017). Remote monitoring and control of geological exploration refer to the exploration of the geology of lava area by various means and methods, to determine appropriate bearing strata, identify geological details and the technical conditions for mining and utilization, provide the provision of geological information needed for highway construction and design, and investigate and study geological conditions such as the rocks, structures, minerals and strata in a certain area, so as to provide favorable data support for geological research in lava areas (Zhao & Miao, 2018). This paper designs a remote monitoring system for geological exploration in the lava area based on GPS in order to contribute to construction data and exploration data in the lava area.
Materials and Methods
The architecture of System Hardware
Geological exploration in lava areas requires high equipment requirements. All remote monitoring equipment selection has been certified by the security department (Riordan et al., 2017). The three core function modules of a remote monitoring system for geological exploration in lava area based on GPS are the data acquisition module of geological exploration in lava area, the data analysis and management module of geological exploration in lava area, and the location module of geological anomaly based on GPS (He & Yan, 2017).
The data acquisition module of geological exploration in the lava area is the monitoring end of the system. It transmits the collected geological data of the lava area to the data analysis and management module of geological exploration in the lava area using a GPS network. After filtering and analyzing the acquired data, if there are abnormal values in exploration data, it transmits positioning instructions to the geology based on GPS. The anomaly location module carries out positioning feedback to users (Liu et al., 2017). The overall structure of the remote monitoring system for geological exploration in the lava area based on GPS is shown in Figure 1.
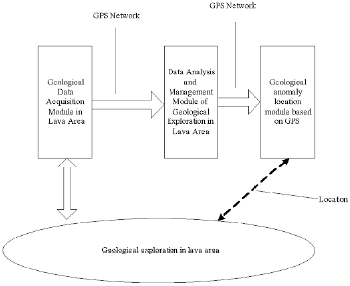
Figure 1 Structural diagram of the remote monitoring system for geological exploration in the lava area based on GPS
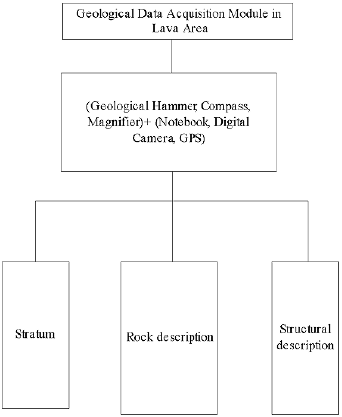
(1) Data acquisition module for geological exploration in the lava area The main task of the data acquisition module of geological exploration in lava area is to combine the old three pieces (geological hammer, compass, magnifier) and the new three pieces (notebook, digital camera, GPS) to achieve multi-S integration and to collect formation information, rock information and structural information of lava area (Geng et al., 2017). The structure of the data acquisition module for geological exploration in the lava area is shown in Figure 2.
(2) Data analysis and management module of geological exploration in the lava area
The data analysis and management module of geological exploration in the lava area is responsible for receiving, analyzing, and managing the geological data of the lava area collected by the data acquisition module of geological exploration in the lava area. After receiving the geological data collected by the data acquisition module of geological exploration in the lava area, the module filters the geological data in the lava area using the method of monitoring data processing based on unascertained filtering. According to the data, it judges whether there are abnormal values in geological exploration in the lava area. If there are abnormal values, it transmits positioning instructions to the geological abnormal situation positioning module based on GPS (Kostopoulou et al., 2017). The structure of the data analysis and management module for geological exploration in the lava area is shown in Figure 3.
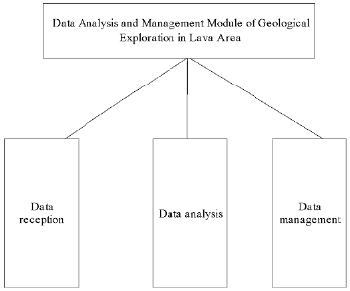
Figure 3 Structure diagram of data analysis and management module for geological exploration in the lava area
(3) Geological anomaly location module based on GPS
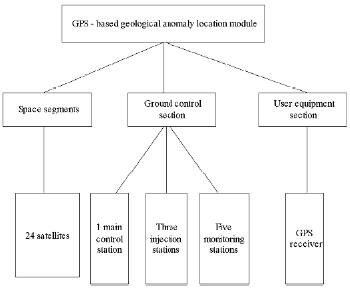
A geological anomaly location module based on GPS consists of a space part, a ground control part, and a user part (Alison et al., 2017). Details are shown in Figure 4.
GPS - based geological anomaly location module
a. Spatial part
The space part of GPS is composed of 24 GPS working satellites, which together constitute the satellite constellation. Among them, 21 are localizable satellites and 3 are standby microsatellites. The 24 satellites are evenly distributed in six orbital planes about 20183 km from the ground. The angle of intersection between each orbital plane and the equatorial plane is 55°, and the distance between the orbital planes is 60° (i.e. the ascending point of the orbits is 60° different from each other). There are four satellites in each orbit. Each GPS working satellite sends out signals for locating abnormal materials in the geology of lava areas.
b. Ground control part
The ground control part is composed of a monitoring system consisting of several tracking stations distributed around the world. According to their different functions, these tracking stations are divided into main control stations, monitoring stations, and injection stations.
c. User equipment section
The user equipment is composed of GPS receiver, data processing software, and corresponding user equipment. Its function is to receive GPS satellite signals to obtain necessary positioning information.
Monitoring Data Processing Method based on Unascertained Filtering
During the operation of the remote monitoring system for geological exploration in the lava area based on GPS, there are more or fewer errors in monitoring data due to the influence of monitoring instrument accuracy and observation conditions. When analyzing the monitoring data, it will be found that there will be jumps in the monitoring data and local jumps in the time-displacement curve drawn. On this basis, the analysis and survey of geological stability in the lava area will encounter difficulties in data screening. Therefore, before analyzing the monitoring information, it is better to do filtering to minimize the systematic error, random error, and gross error in the monitoring data, so that the monitoring data can better reflect the geological conditions of lava areas.
In the monitoring of geological exploration in the lava area, abnormal data processing is very important. There are generally two reasons for abnormal monitoring data: errors caused by monitoring, called gross errors; abnormal monitoring data caused by geological abnormalities, called abnormal values. In data processing, gross errors should be eliminated, abnormal values should be processed and analyzed, and effective measures should be taken to deal with the geological abnormal part of the lava area (Hu et al., 2017).
Based on the modern error theory, this paper uses the unascertained filtering method to judge the gross errors and outliers of monitoring data, to effectively eliminate gross errors and identify abnormal values (Song et al., 2017).
There are essential differences between gross errors and abnormal values. The greatest difference is that gross errors are contingent, and the frequency of occurrence is not high. Compared with the monitoring data of this group, gross errors are usually single and have a certain contingency. The abnormal values are continuous and accumulative after the catastrophic data are generated, which is essentially due to the geological anomalies in lava areas. In this paper, we use unknown rational numbers to distinguish gross errors from abnormal values (Amiri-Simkooei et al., 2017).
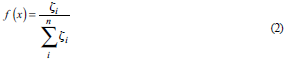
Taking the monitoring data sequence V 1 ,V 2 ,V 3 ,….V n as an example, an unascertained rational number is defined.

Where, 1 ≤ V 1 ,≤ n, f (x), f (x) is the distribution density function of the reliability of remote monitoring data for geological exploration in the lava area. The main purpose of processing monitoring data is to identify and screen anomalous data, eliminate the gross errors caused by various factors, and reduce their impact on data analysis. Through the analysis of gross error and abnormal value of monitoring data, it is found that if the value of gross error appears in the monitoring sequence, the data must exist in isolation, and there is only one [a, b] in the remote monitoring data interval of geological exploration in lava area; if the value is abnormal value, the adjacent monitoring sequence has continuity. Over time, this data appears more and more frequently. Therefore, the combination of monitoring data and its reliability density function f (x) can effectively eliminate gross errors, identify outliers, and reduce its impact on monitoring data analysis.
If the trend of monitoring data sequence changes too much, it will affect L. number of neighborhoods of monitoring sequence, thus affecting the judgment of gross errors. In order to reduce the impact of sequence trend change on V, n detection values of monitoring data can be divided into several data segments, each data segment has k + 1 detection value, k< n, then:
When x = V i ,
When x ≠ V ¡ ,

Where, x represents the monitoring value in remote monitoring data interval [a, b] of geological exploration in the lava area, and ζ. represents the number of (i ≠ j) in V i field.
The size of the credibility density function determines the probability of V i as the likelihood of gross error, the greater the reliability of V i is, the smaller the probability of gross error is; and the smaller the reliability of V is, the greater the probability of gross error is. Then the gross error is determined according to the value of f(x). After determining the gross error in the monitoring sequence, the gross error needs to be eliminated. In order to eliminate the gross error, the unascertained expectation of V i and its monitored values in the neighborhood is used as the final result of the monitoring sequence. It is not known that the expected E (A) calculation method is:
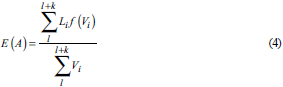
Where, l means that in the original monitoring data, the value of monitoring data starts from l, and the length of the data segment is k+1. l value varies with the location of V in the selected monitoring data. Let m be a definite even number. The selection of monitoring data is as follows:
When i = 1, the first and second monitoring data are taken as the search area of ζ in the data sequence segment where V is located. When formula (2) and formula (3) are used to calculate, k of confidence density function f (x) is taken as 1, and l = 1 of unascertained expectation is calculated by the formula (4).
When
 , the values of
 in the monitoring data are taken as the sequence search area, and then

When
 , the values from 2i - n to n-th in the monitoring data are taken as the sequence search area, where
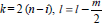
When i = n, the n-1 and n values in the monitoring data are taken as the search area of the sequence, and then k = 1 and l = n - 1 are taken.
Gross error recognition depends on the reliability of monitoring data. The reliability depends on the number of monitoring data in the V i neighborhood, and the number of monitoring data depends on the size of λ in the neighborhood radius. The value of λ is determined according to the actual situation in the field. When the average difference between two adjacent monitoring values is large, the value of λ is larger. When the average difference between two adjacent monitoring values is small, the value of λ is smaller. In practical engineering, if the value of λ is too large, the ability to identify gross errors will decrease; if the value of λ is too small, the normal data may be misidentified as gross errors, resulting in increased workload and inaccurate calculation. Therefore, the reasonableness of λ value will directly affect the effectiveness of data processing by filtering method (Yu & Lu, 2017).
For the value of λ, it is usually determined by the method of calculating the difference variance of the monitoring data sequence. With the help of the criterion of double or triple median error in gross error identification, the difference variance of double or triple is obtained. Considering that λ is bigger in the monitoring data sequence with gross errors, λ is taken as double-difference variance in the processing of remote monitoring data of geological exploration in the lava area.
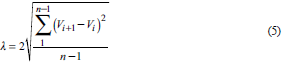
The upper and lower limits of the neighborhood of the selected monitoring sequence are determined according to the neighborhood radius calculated by the formula.
Where λ is the threshold parameter of gross error recognition. In the process of gross error identification, gross errors need to be eliminated and the remaining monitoring data need to re-calculate λ until there is no gross error (Li et al., 2017).
Because the value of k depends on the selection of m, m generally chooses all even numbers from 2 to n/2 and calculates the value of r iteratively. The value that makes λ converge sufficiently and can identify gross errors is taken as the selection value of m. In concrete calculation, if m is too small and there are continuous gross errors, there will be zero gross errors, and the total reliability of the data segment is zero. At this time, E (A) cannot replace gross errors. We should select a larger data segment to obtain the unascertained expected value, or select more data to expand the neighborhood radius.
For the monitoring data sequence with a small change range, m usually chooses a larger value to get a better result. If the data segment is wider, the ability of gross error recognition is stronger; for the monitoring data sequence with the large change, if m is selected, it is difficult to obtain satisfactory results. The reason is that the detection data sequence has volatility, which will result in the occlusion of gross error recognition, thus affecting the accuracy of data processing results (Wang et al., 2017).
Test Settings
The strata in the test area are mainly limestone of the Tianziling Formation in the Devonian. In the detailed exploration stage of engineering geology in this area, besides ascertaining the stratum structure and geophysical and mechanical properties (Gao et al., 2013; Liu et al., 2014), the emphasis is on ascertaining the distribution, shape, size, scale of lava and the associated soil caves and ground subsidence in the overlying strata. This system is used to monitor the process of engineering geological exploration in this area.
(1) Location function test
In the lava monitoring area used in the experiment, 12 small caves are set up. The system is used for remote monitoring of exploration, and the positioning function of the system is tested (Hendrikx & Gestel 2017).
(2) Reliability testing of monitoring data
Combined with the distribution of small soil caves in the experimental area, the monitoring data of 23 m and 3.2 m geological survey points in the lava area are extracted as the analysis objects.
23 m: A total of 22 monitoring data from May 2019 to July 2019 are selected for analysis. When the serial number of the monitoring data is greater than 3, the monitoring data is taken as the center and three values are taken forward and backward as their neighborhoods to calculate the reliability of the monitoring data in their neighborhoods (Liu et al., 2018).
3.2 m: Through collating and analyzing the monitoring data of this system, 22 monitoring data from August 29, 2019, to August 12, 2019, are selected for analysis.
Results
Test Results of Location Function
In this paper, the location function test results of 12 small soil caves in the geology of lava area are shown in Table 1.
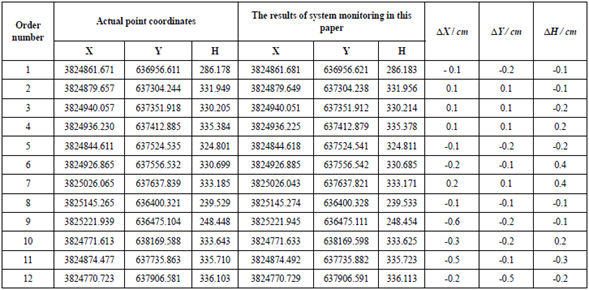
The statistical results of the positioning errors of the system in this paper are shown in Table 2.
Table 2 Systematic positioning errors in this paper

Note: X and Y are coordinate values of soil cave and H is height value. ∆X, ∆Y and ∆H are positioning differences.
According to Table 1 and Table 2, we can see that the maximum error is 0.3 when the system locates 12 small soil caves, and the error is small.
The Reliability Test Results of Monitoring Data of the Systemin This Paper
(1) Reliability test results of monitoring data at 23m survey point
The calculation process is shown in Table 3, where i represents the number of monitoring data in the neighborhood. In this paper, the difference variance of R is λ times. The reliability of the monitoring data of the system is tested several times by setting different monitoring dates.
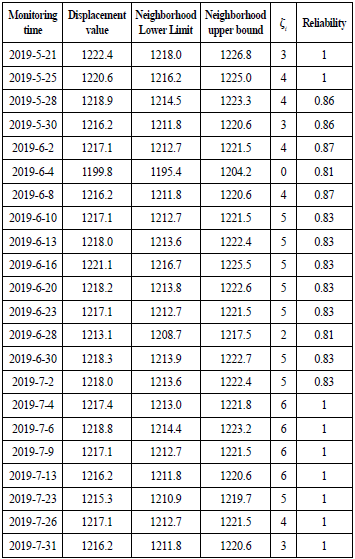
According to Table 3, the reliability of monitoring data before May 28, 2019 is 1, and the reliability of monitoring data is high. During the period from May 28, 2019 to June 2, 2019, the reliability of monitoring data fluctuates to a certain extent, but it remains above 0.8, which can be considered that the monitoring data is basically in the normal range. From June 8, 2019 to June 23, the reliability of monitoring data is maintained above 0.8, and the reliability is basically stable. The reliability of monitoring data from June 28, 2019 is 0.81, and that of monitoring data from June 30, 2019 to July 2, 2019 is 0.83, which basically meet the requirements of the project. After July 2, 2019, the reliability of monitoring data has remained basically stable.
According to the reliability analysis of the monitoring data of the system in this paper, we can see that most of the monitoring data have high reliability, which is basically maintained above 0.8. The reliability of the monitoring data in June-4, 2019 and June-28, 2019 are both 0.81, which indicates that the monitoring data in these two periods are encouraging, and the credibility is the lowest compared with other monitoring data. On the whole, the reliability of the monitoring data in this system is better, which meets the remote monitoring standard of geological exploration in lava area.
(2) Reliability test results of monitoring data at 3.2m survey point Combined with the distribution of small soil caves in the experimental area, the monitoring data of 3.2m geological survey points in the lava area are extracted as the analysis object. Through collating and analyzing the monitoring data of this system, 22 monitoring data are selected from August 29, 2019 to July 2, 2019. Details are shown in Table 4.
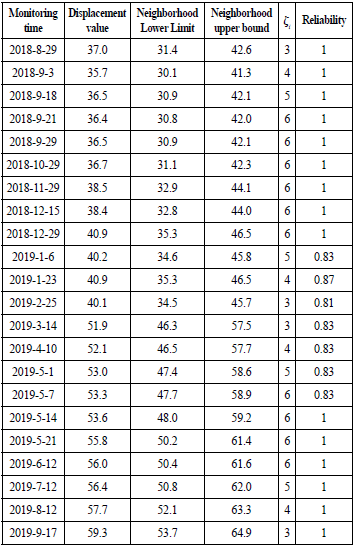
According to Table 4, the reliability curve of monitoring data of 3.2m survey point is drawn, as shown in Figure 5.
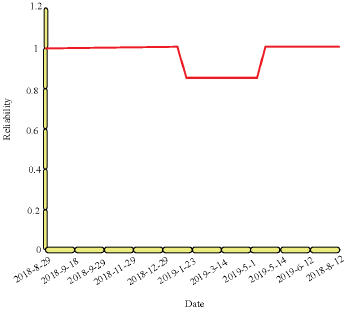
Among them, the abscissa represents the monitoring day, the ordinate represents the credibility data, and the maximum value is 1. During the period of August 29, 2018 to Dec. 29, 2018, the credibility of monitoring data is 1, and the credibility of monitoring data is high in this period; during the period of January 1, 2019 to February 25, 2019, the credibility of monitoring data continues to decrease, to a minimum of 0.81; during the period of March 14, 2019 to May 7, 2019, the credibility of monitoring data continues to rise, to a maximum of 1; after May 7, 2019, the credibility of monitoring data remains stable, at this time, the credibility of monitoring data is high.
Discussions
In this paper, the application of GPS in remote monitoring of geological exploration in lava area is discussed. GPS has the following advantages:
(1) High accuracy
In the past engineering surveying and mapping work in China, the relevant workers usually use traditional surveying and mapping technology, but the traditional surveying and mapping technology is gradually replaced by GPS engineering surveying and mapping technology because of its shortcomings in surveying accuracy and material consumption. For GPS engineering survey technology, it has the perfect advantage of high accuracy. GPS engineering surveying and mapping technology itself has the function of static surveying, and this function of static surveying can make the accuracy of surveying and mapping results to millimeter units, which is incomparable with traditional surveying and mapping technology in China. Therefore, in this respect, GPS engineering survey technology shows its unique advantages.
(2) The measurement time is short and the efficiency is high.
For GPS engineering surveying technology, it not only has the characteristics of high accuracy and stronger adaptability, but also has the characteristics of short surveying time and high efficiency. In the traditional engineering surveying and mapping technology of China, due to the lack of relevant application software, it usually consumes a lot of manpower to complete the surveying and mapping work. However, GPS engineering survey technology can solve this problem very well. GPS engineering surveying and mapping technology is mainly the application of GPS system, which can work uninterruptedly without the influence of time, geographical environment and weather, thus greatly saving working time and improving the overall surveying efficiency.
(3) More adaptable
GPS engineering surveying technology adopts the grid method in the process of surveying, and the grid structure is very simple. The density of each point and the length of edge distance can be freely selected according to the actual situation of surveying and mapping, even if the known point is far away from the measuring point, it can also be measured. In addition, for GPS engineering survey technology, this technology effectively solves the problem that points cannot be seen each other, and can select known points without elevation. For GPS engineering survey technology, when surveying a large grid, GPS engineering survey technology can show the advantages of high accuracy and uniform error of GPS grid. Therefore, for GPS engineering survey technology, it has certain adaptability.
Conclusions
At present, although China has achieved certain success in the development of geological survey and research work, the investigation of lava area is still the key and difficult problem that puzzles project researchers. How to carry out a series of economic, reasonable, technically feasible, effective and scientific exploration work and realization of remote and high-precision monitoring on the basis of fully understanding the actual geological background of local lava area and the limitation of existing resources of the project is a subject worthy of study. This paper designs a remote monitoring system for geological exploration in lava area based on GPS. The system consists of three functional modules: data acquisition module for geological exploration in lava area, data analysis and management module for geological exploration in lava area, and positioning module for geological anomaly based on GPS, so that the three major functions of geological exploration in lava area: data acquisition, analysis and management and anomaly positioning can be realized. The system is applied to the remote monitoring task of geological exploration in a lava area. Several conclusions are drawn:
(1) When the system locates 12 small soil caves, the maximum error is 0.3, and the error is small.
(2) When the geological survey point in the lava area is 23m, according to the reliability of the monitoring data of this system, it can be seen that most of the monitoring data have high reliability, which basically maintains above 0.8.
(3) When the geological survey point in the lava area is 3.2 m, the minimum and maximum reliability of the system monitoring is 0.81 and 1, which is high.
With its unique and powerful functions and advantages, GPS technology fully demonstrates its superiority in the field of development, as well as greater and broader development space. However, some shortcomings have also been exposed in the actual construction process and in the construction and monitoring of follow-up projects in this field.
(1) The key of precise positioning of GPS system lies in the accurate calculation of the distance between satellite and receiver. According to the fixed mode: distance = speed* time, after the time is determined, the speed is determined by the propagation speed of the electromagnetic wave. It is well known that electromagnetic waves propagate rapidly in vacuum, but he atmosphere is not a vacuum state, and the signals are subject to heavy interference from the ionosphere and troposphere. The GPS system can only: calculate the signal averagely and there must be some errors in some specific areas. Because of the influence of high-rise buildings and trees on the signal in big cities or mountain areas, the non-linear propagation of the signal will also be caused, and some errors will be introduced in the calculation.
(2) The difference of control point position in GPS measurement directly affects the accuracy of observation point position. Because GPS measurement obtains point coordinates (including elevation) by receiving signals from satellites through data processing, any factors that may affect signal reception ay cause errors when interference occurs.
In the future research work, we should pay attention to the above shortcomings and optimize them.

