


 English (pdf)
 Article in xml format
 Article references
 Send this article by e-mail
 Cited by SciELO
  Cited by Google
  Similars in
SciELO
Similars in
SciELO  Similars in Google
 Permalink
Introduction
A country and region will undergo a process of rapid industrialization and urbanization on the way to modernization. The expansion of construction land is always accompanied by this process as an important feature of industrialization and urbanization. With industrialization and urbanization, the current social economy is in a critical period of rapid transformation and development. In addition, the disorderly expansion of construction land in recent years has restricted the intensification of agricultural land management and neglected the benefits of environmental economy. The expansion of construction land has attracted high attention from scholars at home and abroad (Ye et al., 2013; Liu et al., 2016).
There are few studies on the expansion of construction land in foreign, and the related research mainly focuses on urban expansion. The expansion control theory of urban construction land originated in the early 20th century, including the unified planning, strict policy and laws and regulations. The urban land is divided into areas according to the land development plan, specifying the use of construction land in each area, building volume ratio, building density, building height, etc. (Seto et al., 2012). The concept and identification method of urban spatial form were proposed respectively (Boyce & Clark, 1964; Lee & Sallee, 1970). ArLinghaus (1985) first proved the central theory of urban expansion through fractal theory. Frankhauser (1990) used the fractal theory to analyze the characteristics of urban expansion patterns and urban expansion. Batty et al. used the fractal theory to analyze the shape of urban expansion (Batty & Xie, 1994). And in terms of urban expansion mode, Forman (1995) proposed the filling, edge and enclave. SDSS technology was utilized to construct the spatial decision support system, which is used to evaluate the driving factors of urban and rural construction land use (Xuan et al., 1996). Sharifi and Van Keulen (1994) used the GID and linear programming models to design and analyze the driving force of factors of urban and rural construction land use in decision support systems. American scholar Ventura et al. (1988) used the multi-purpose planning to analyze the driving force of rural residential areas, and obtained the driving influence on rural residential areas, which provides the scientific support for subsequent decision-making.
The domestic research on the construction land mainly focuses on the spatial characteristics of urban expansion at different scales, the driving mechanism of urban expansion and the impact of urban expansion on the environment. It scientifically guides the expansion of construction land and maintains urban ecological security. Wherein, the cities with the fastest expansion of construction land, such as Beijing, Shanghai, Guangzhou and Shenzhen, are studied in depth, analyzing the overall situation of urban land expansion at the national or regional scale (Chen & Wu, 2014; Liu, Liu, Kuang & Ning, 2016; Qu & Qiu, 2013; Xu et al., 2012). Chi and Hu (2011) used the Markov model to simulate the future changes of land resources in Chongqing, and played the leading role in the land use planning of Chongqing in the future. The SLEUTH model was utilized with GIS and RS technology, the simulation and prediction of the spatial expansion of Jiuquan City and Jiayuguan City were carried out, showing that the urban expansion under different scenarios is different (Jiang et al., 2017). Lv and Chen (2009) analyzed the relationship between manufacturing location selection and urban spatial reconstruction. Chen et al. (2014) taking Nanjing (the central city of the Yangtze River Delta) as an example, used the remote sensing and land using survey data and other data to study the expansion process, pattern and mechanism of construction land in metropolitan areas (Chen et al., 2014). Yao et al. (2018) used the dynamic change measurement methods of land use and land use multi-functional methods for the cities in the middle reaches of the Yangtze River from the perspective of socio-economic systems. Besides, they measured the spatial structure and internal function transformation of construction land use (Yao et al., 2018). With the advancement of science and technology, technical means such as aviation and remote sensing have been applied, with the trend, mode and driving force of construction land expansion analyzed.
In recent years, with the emergence of environmental issues, domestic scholars pay attention to the relationship between land use change and environmental benefits. By integrating the time scales of social and environmental changes, the China's cultivated land transformation and land consolidation have been studied, proposing the theoretical assumptions of China's cultivated land transformation (Li et al., 2018; Qu et al., 2014). Therefore, the work measured the change of construction land in the Wanjiang City Belt by the remote sensing images of 1995, 2000, 2005, 2010 and 2015, the detailed investigation and change data of land use from 1995 to 2015, and the GIS grid analysis method. In the process of expansion intensity, hotspot area and spatial transformation process, the work analyzed the evolution trend and reasons of construction land in the Wanjiang City Belt from 1995 to 2015.
Data sources and research methods
The land-use data comes from the Resource and Environmental Science Data Center of the Chinese Academy of Sciences (http://www.resdc.cn), and the socioeconomic data from the Anhui Statistical Yearbook. The main research methods are as follows:
Land use change rate
It is used to describe the change in a type of land use within a certain period, reflecting that the type of land use is affected by human activities. Its formula is:
where Ki is the land use change rate of the land use of type i in the period from t1 to t2; St1 and St2 are the areas of the land use of type i in the initial and final stages of the study.
Spreading Strength Index (Sprawl Intensity Index)
The expansion strength index can reflect the expansion speed of a certain type of land within a region. By standardizing the land area of a certain type, the expansion strength index in the regional space can be obtained. The standardized value can be used for different research periods. The comparison between the growth rates of a certain type of land area in a region during the period can be expressed as:

where A sii is the growth area of a certain type of land in different time periods; A the total area; T the year of the study period. The study area is divided into a total of 3,325 cell grids of 5 km*5 km, with the expansion strength index of each cell grid calculated. We can obtain the expansion strength index of the cell grids of the Wanjiang City Belt in 1995-2000, 2000-2005, 2005-2010 and 2010-2015.
Hotspot analysis (Getis-Ord Gi*)
Hotspot analysis is generally used to identify the clustering of hot spots and cold spots in an area. By looking at the value of each element in the area and the value of its neighborhood, the z-score and p-value represent the clustering of hotspots and cold spots, and the results are often statistically significant. Its formula is as follows:
where x is the expansion strength index of the j-th unit; wi the spatial weight of the i-th unit and the j-th unit; n the total number of cells (Baruah & Pathak, 2011). The calculated G*I represents the z-score. If it is statistically significant, the larger value means the higher value around the cell and the closer cluster, belonging to the hot spot region. The smaller value means the lower the value around the cell, and the more dispersed cluster, belonging to the cold spot region.
Analysis of the characteristics of construction land use
The construction land includes urban land, rural residential areas, and other construction land. Table 1 shows the variation range of various construction land. The maximum change of all types of construction land is in C period (2005-2010), and the absolute value of area change is higher than those of other periods. With the same time of change, the land use is different, and the minimum value of urban land appears in period A (1995- 2000). The rural residential area is in the D period, and other construction land appears in the B period (2000-2005).
Table 1 Changes in construction land in the study area
| Change amount (hm2) Rate of change (%) | ||||||||
|---|---|---|---|---|---|---|---|---|
| Type | ΔSA | ΔSB | ΔSC | ΔSD | KA | KB | KC | KD |
| Urban land | 3859.17 | 13088.47 | 45032.27 | 28308.98 | 8.80 | 27.44 | 74.08 | 26.75 |
| Rural residential area | 32036.17 | 4351.57 | 33448.80 | -4005.90 | 8.73 | 1.09 | 8.30 | -0.92 |
| Other construction land | 1634.29 | 1257.08 | 24064.21 | 12886.86 | 42.15 | 22.81 | 355.50 | 41.80 |
Note: 5s in the figure is the area of the node at the next time minus the area of the node at the previous time; K is the rate of change; A is 1995-2000; B is 2000-2005; C is 2005-2010; D is 2010-2015; T is the total change from 1995-2015.
Type Change amount (hm2) Rate of change (%) ΔSA ΔSB ΔSC ΔSD KA KB KC KD Urban land 3859.17 13088.47 45032.27 28308.98 8.80 27.44 74.08 26.75 Rural residential area 32036.17 4351.57 33448.80 -4005.90 8.73 1.09 8.30 -0.92 Other construction land 1634.29 1257.08 24064.21 12886.86 42.15 22.81 355.50 41.80
Type Change amount (hm2) Rate of change (%) ΔSA ΔSB ΔSC ΔSD KA KB KC KD Urban land 3859.17 13088.47 45032.27 28308.98 8.80 27.44 74.08 26.75 Rural residential area 32036.17 4351.57 33448.80 -4005.90 8.73 1.09 8.30 -0.92 Other construction land 1634.29 1257.08 24064.21 12886.86 42.15 22.81 355.50 41.80
Judging from the change rate of construction land area, other construction land is higher than the other two categories from 1995 to 2015. The size is as follows: other construction land> urban land> rural residential area (Hao & Chunjing, 2013). The maximum change rate of urban land and other construction land area appears in the C period, while the rural residential area is in the A period. The time when the minimum rate of change occurs is also different for each land use, and the urban land used in the A period is 8.8%. The rural residential area is in the D period, and other construction land appears in the B period.
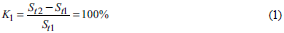
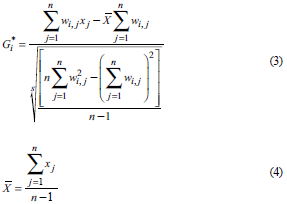
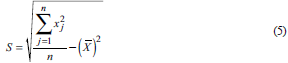
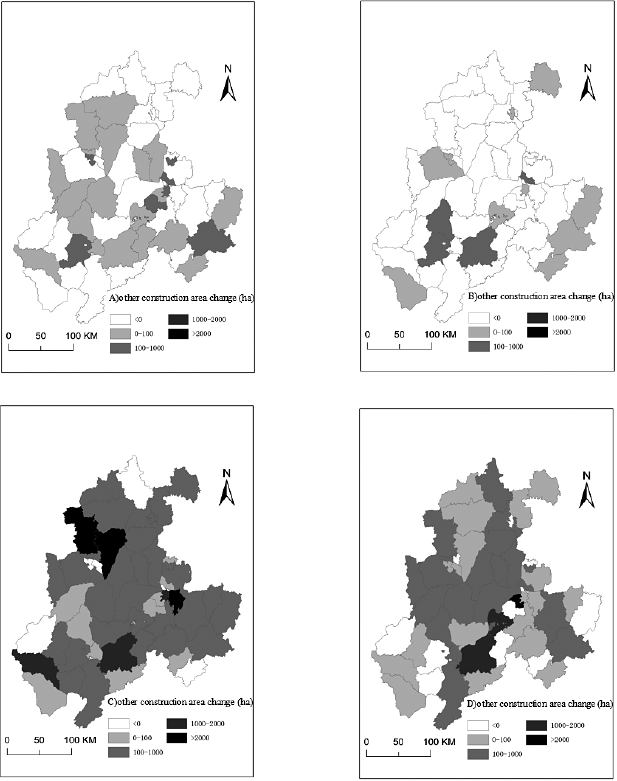
Using the spatial analysis function of ArcGIS, the area change of urban land, rural residential areas and other construction land in various areas of the Wanjiang City Belt is made into a spatial variation distribution map according to different variation ranges (See Figures 1 and 2).
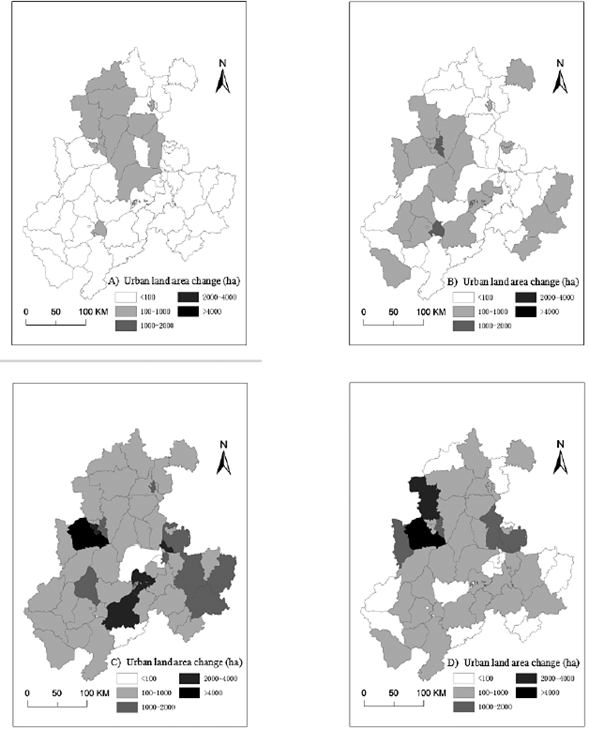
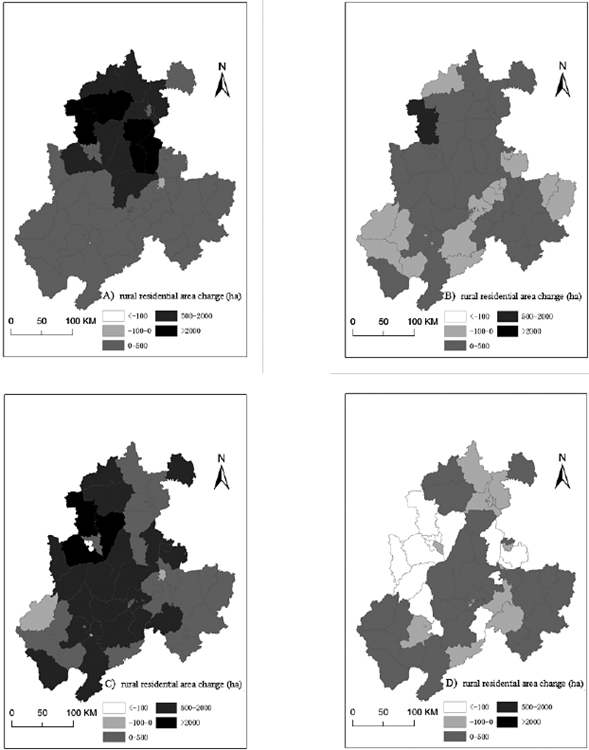
The analysis of the following figures shows: (1) The area of urban land used has a small change in 1995-2005, and most of the areas have increased, but the increase is less than 100 hectares. During the period of 2005-2015, the urban land area of Feixi County has increased by more than 4,000 hectares, and the increase in other areas is less than 2,000 hectares. This is related to the construction of Hefei High-tech Zone in Feixi County and the main carrier of Hefei's industrial development, which enables Feixi County to increase a large amount of construction land.
During the period of 1995-2010, the most areas of rural residential showed a small increase trend. Some areas such as Changfeng County, Dingyuan County, Feixi County and Feidong County increased by more than 2,000 hectares. However, in 2010-2015, the area of rural residential reduction has increased a lot compared with the previous periods, especially for Changfeng County, Feixi County, Feidong County, Hefei City, Jin'an District, Shucheng County, He County and Dangtu County; the area has been reduced by more than 100 hectares. Due to the gradual development of the Wanjiang City Belt, the process of urbanization is also accelerating, and the rural population in most areas' flocks to the towns, which reduces the area of rural settlements.
During the period 1995-2010, the area of construction land in most areas of the Wanjiang City Belt has decreased in small range, while in 2005-2015, the area of other construction land has increased significantly. Changfeng County, Feidong County, Wuhu City and other places have increased by more than 2,000 hectares, and the increase in most areas is more than 1,000 hectares. Since 2006, the Wanjiang City Belt has been included in the key development areas of the country's central improvement strategy. Some large industrial areas have been gradually developed, including the construction of traffic roads and airports, which has increased the area of other construction land.
Analysis of (he expansion strength of construction land in Wanjiang Gry Belt
The superposition analysis function in ArcGIS software was used to obtain the average expansion intensity of each city in the above 4 different time periods. The results are shown in the following Table 2.
Table 2 Various prefecture-level cities expansion strength analysis of Wanjiang City Belt
| 1995-2000 Year | 2000-2005 Year | 2005-2010 Year | 2010-2015 Year | |
|---|---|---|---|---|
| Anqing | 2.06 | 4.01 | 17.21 | 5.79 |
| Chizhou | 1.69 | 1.05 | 16.72 | 7.64 |
| Chuzhou | 18.43 | 2.02 | 16.85 | 4.11 |
| Hefei | 18.3 | 10.67 | 45.71 | 16.25 |
| Maanshan | 25.5 | 5.69 | 52.78 | 19.91 |
| Tongling | 4.52 | 9.2 | 62.47 | 36.83 |
| Wuhu | 7.87 | 3.68 | 35.33 | 15.43 |
| Xuancheng | 3.17 | 1.19 | 13.88 | 2.56 |
| LuAn (part) | 3.32 | 4.55 | 17.28 | 11.51 |
| Overall | 10.78 | 4.78 | 28.92 | 10.69 |
Generally speaking, the construction land of the Wanjiang City Belt from 1995 to 2015 has always shown the continuous expansion. The overall expansion intensity index from 2000 to 2005 was the lowest in the study period, and its value dropped from 10.78 in the previous period to 4.78, with the urban expansion rate greatly delayed. However, the overall expansion intensity index from 2005 to 2010 increased rapidly to 28.92, which was about six times the growth rate from 2000 to 2005 (it is the highest in the study period). By 20102015, it has dropped to a level similar to that from 1995 to 2000, dropping to 10.69, and the rate of urban expansion has once again fallen sharply.
From different cities, during the period of 1995-2000, Maanshan City had the highest urban expansion intensity, and its expansion intensity was as high as 25.5, about 15 times that of the lowest value of Chizhou City. It was followed by Chuzhou City and Hefei City (18.43 and 18.3), respectively. The areas with the highest expansion intensity index in 2000-2005 were Hefei City and Tongling City, with values of 10.67 and 9.2, respectively (Wang, 2013). The expansion strength index of all prefecture-level cities showed a significant decrease (below 5) except for Tongling City during this period. It was indicated that the expansion speed of construction land has been controlled during this period, and the degree of human activities tended to slow down. In 2010-2015, the expansion intensity index of each region has dropped significantly from the previous period, and it was similar to the initial period, showing a relatively gradual growth trend.
(1) This trend is often attributed to two reasons. First, in the process of rapid and rapid development of the city, the city will encounter restrictions and reduce its own expansion speed to adapt to the local economic development. Secondly, with the development of the economy, people's protection and management of the ecology has also been improved. The expansion of construction land has gradually been suppressed. These reasons lead to a sharp decline in the urban expansion intensity index of various cities after experiencing rapid growth.
Hot spot analysis of construction land expansion in research area
The above analysis only counts the average index of urban expansion intensity of different regions in the Wanjiang City Belt from the perspective of the city. It is impossible to judge which specific areas of the Wanjiang City Belt belong to the hotspots or cold spots of construction land expansion from the regional space. Through the hotspot analysis tool in ArcGIS, the expansion intensity index of each cell in the study area was calculated, and the result of expansion intensity hotspot analysis was obtained (See Figure 4).
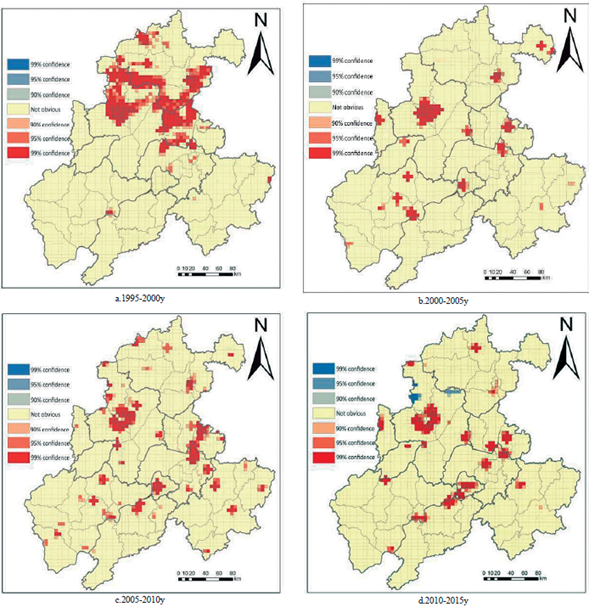
We take the Yangtze River as the axis and Hefei as the core, with the advancement of urbanization; the location of the hotspots is also complex and changeable. However, the central urban area has always been the main hotspot distribution and expansion area. In addition, the cold spot area rarely appears, different from the trend of spreading development of hotspots. In 2010-2015, only a few cold spot areas appeared in the northern districts and counties of Hefei.
During the period of 1995-2000, the hotspots for construction land expansion in the Wanjiang City Belt were still in the northern part of the region. With Hefei as the center, the northward development was connected to Chuzhou, and the southeast was extended to connect Maanshan and Wuhu City, eventually forming a large U-shape agglomeration hotspot with high expansion strength. The hotspots with large expansion intensity mainly included Hefei City, Fengyang, Dingyuan, Quanjiao, Lai’an and other counties in Chuzhou, including Hanshan and Hexian in Maanshan, Wuwei County and Wujiang District in Wuhu, and Daguan District of Anqing. Except for the districts of Hefei, Jiujiang District and Daguan District, others are all county-level units of cities. The areas with weak development foundations such as county towns were still the main development direction in the early urban expansion of the Wanjiang City Belt.
From 2000 to 2005, the hotspots of expansion strength agglomeration gradually dispersed, and Hefei City was still the main development of the core hot area. In addition, small hot spots appeared in Langya District and Tianchang City of Chuzhou, Huashan District, Yushan District of Maanshan, Yijiang District of Wuhu, Tongling County and its suburbs and Tongling City, Yixiu District, Daguan District, Tongcheng City and Huaining County of Anqing, and Jin'an District and Shucheng County of LuAn. The hotspots with county-level units as the expansion direction were gradually transferred to the district units within the city, indicating that the spread and development of the city to the periphery was faster than the development speed of the county and surrounding towns during this period. Construction land around the city had been utilized.
In 2005-2010, while Hefei was still the core hotspot, there were also non-aggregating non-significant areas in the city center, and the surrounding areas such as Changfeng County and Feidong County also showed an agglomeration hotspots of expansion strength. Maanshan and Wuhu spread to the surrounding area. The hotspots in Tongling continued to agglomerate and expand. In addition, compared with the previous period, new hotspot clusters have appeared in Fengyang County, Handan District, Xuanzhou District, and Guichi District, opposite in Jin'an District and Shucheng County, Yixiu District, Daguan District and Tianchang.
During 2010-2015, the hotspots in various regions have a narrow development trend. Most of the hotspots were located in the surrounding areas of cities, such as the urban areas of Hefei, Chaohu City, Yushan District of Maanshan, Jiujiang District of Wuhu, and Shizishan District of Tongling , Guichi District of Chizhou, Daguan District of Anqing and Yixiu District, and Xuanzhou District of Xuancheng. Other areas were basically insignificant areas, affected by economic restructuring and ecological protection policies. Construction land no longer blindly expanded, and the speed of urban expansion tended to be stable. In addition, for the first time at the junction of Hefei and LuAn and the junction of Hefei and Chuzhou, there was a cold spot area with an expansion strength index, affected by the introduction of ecological protection policies. The unreasonable construction land had changed into ecological land during the construction process, with the improved ecological environment. The relationship between man and land had moved toward a friendly development direction.
Driving mechanism of construction land change in Wanjiang Cit Belt
There are many factors driving the change of construction land, including natural and socio-economic factors, such as the mentioned elevation, slope and climatic conditions. The socio-economic factors mainly refer to the macroeconomic conditions that affect the changes of the social environment, GDP and industrial added value, the output value of the second production, the output value of the three productions, the investment in fixed assets, and the total retail sales of social consumer goods. The polarization region of Wanjiang City Belt is in the subtropical zone-the terrain is dominated by plains, and the topography of the mountains and low hills intersect. The correlation measure is performed by selecting the correlation between the main socio-economic development indicators and the construction land area of the region.
Table 3 shows a simple Pearson correlation analysis of construction land and other economic and social development indicators in the above five groups of data.
Table 3 Construction land and major economic development indicators of Wanjiang City Belt
| y | x 1 | x 2 | x 3 | x 4 | x 5 | x 6 | x 7 | |
|---|---|---|---|---|---|---|---|---|
| 1995 | 414544 | 864.19 | 178.9 | 306.4 | 412.48 | 252.01 | 286.46 | 22.57 |
| 2000 | 452074 | 1763.18 | 201.2 | 355.2 | 803.07 | 627.40 | 645.36 | 21.64 |
| 2005 | 470771 | 3562.46 | 1142.6 | 1080.2 | 1600.58 | 1416.39 | 1127.43 | 23.45 |
| 2010 | 573354 | 8904.99 | 6717.1 | 3756.3 | 4929.11 | 3040.25 | 2699.51 | 48.20 |
| 2015 | 611931 | 15650.31 | 16204.4 | 6845.4 | 8255.08 | 6105.28 | 5778.11 | 55.74 |
Table 4 shows that the construction land area has strong correlation with the above-mentioned types of economic development indicators, and the construction land use are expanded by the GDP, fixed asset investment, industry, secondary or tertiary services. Wherein, the GDP, industrial added value, secondary output value and urbanization rate are all significantly correlated at the level of 0.01 (on two sides). The main factors causing land change in the development of the undertaking industrial transfer area as Wanjiang City Belt are industries and cities, consistent with the industrialization and urbanization in the past 20 years. These two factors promote the region. The urbanization driven by industrialization and industrialization is the core driving force for the increase of construction land in the demonstration area for undertaking industrial transfer.
Table 4 Pearson correlation between construction land and other economic factors
| y | x1 | x2 | x3 | x4 | x5 | x6 | x7 | |
| y | 1 | |||||||
| x1 | 0.967** | 1 | ||||||
| x2 | 0.923* | 0.989** | 1 | |||||
| x3 | 0.960** | 0.998** | 0.993** | 1 | ||||
| x4 | 0.973** | 0.999** | 0.986** | 0.999** | 1 | |||
| x5 | 0.949* | 0.997** | 0.992** | 0.994** | 0.992** | 1 | ||
| x6 | 0.937* | 0.994** | 0.996** | 0.993** | 0.989** | 0.998** | 1 | |
| x7 | 0.973** | 0.963** | 0.940* | 0.969** | 0.975** | 0.940* | 0.935* | 1 |
Note: y is the construction land area; x1 the GDP; x2 the fixed asset investment; x3 the industrial added value; x4 the second production value; x5 the third production value; x6 the social consumer goods retail sales; x7 the urbanization rate (%). **: Significantly correlated at the 0.01 level (both sides); *: Significantly correlated at the 0.05 level (both sides).
Conclusions
From 1995 to 2015, the changes in construction land in various areas of the Wanjiang City Belt are complex and diverse. By analyzing the variation characteristics of its spatial quantity and its factors, the following conclusions can be obtained.
From the area and extent of time and space changes in construction land, the area changes of urban land in the Wanjiang City Belt from 1995 to 2015 was higher than the other two categories. The order of its size was as follows: urban land > rural residential area > other construction land. Among them, the urban land and other construction land area showed an increasing state at each time period, while the area of rural residential areas showed an increase state in the first three periods, and the last period of time D (2010-2015) decreased. The urban land area of the Wanjiang City Belt increased in small range in most areas from 1995 to 2005, and was less than 100 hectares. The change ranged from 2005 to 2015 was larger than 2,000 hectares. Rural settlements increased in most areas during 1995-2010, but continued to decrease during 2010-2015. Other construction land area decreased in most areas in 19952005, and increased in 2005-2015. In 2005, the state officially implemented the construction of new countryside. The Wanjiang City Belt was included in the key development areas of the national central rise strategy. Policy support and economic development were the main factors for its change.
From the perspective of the expansion of construction land, it has always shown a growing trend of outward expansion for nearly 20 years. The expansion strength index shows a trend of decrease, rise and decrease. The expansion between 1995 and 2005 was relatively flat. The overall expansion intensity index from 2000 to 2005 was the lowest in the study period, and its value dropped from 10.78 in the previous period to 4.78. The rate of urban expansion was greatly delayed. The overall expansion intensity index between 2005 and 2010 increased rapidly to 28.92, which was the highest in the study period. The urban expansion rate in 2010-2015 was greatly reduced, and gradually became flat. Hotspots in various regions had a narrow development trend, and most were located in the surrounding areas of the city, such as the urban area of Hefei, Chaohu City, Yushan District of Maanshan, and Jiujiang District of Wuhu. Other areas were not significant. Under the influence of economic restructuring and ecological protection policies, construction land no longer expanded blindly, and the rate of urban expansion stabilized. In addition, due to the impacted of the ecological protection policy, unreasonable construction land had been changed into ecological land during the construction process. For the first time, at the junction of Hefei and LuAn and the junction of Hefei and Chuzhou, there was a cold spot area with an expansion intensity index. The ecological environment gradually improved, and the relationship between man and land tended to be friendly.
The two important driving factors for the change of construction land area include natural and social. Among them, GDP, industrial added value, secondary output value and urbanization rate are the main driving forces for changes in social and economic factors. As a strategic fulcrum for regional coordinated development, the Wanjiang City Belt is an important part of the Yangtze River Delta Urban Agglomerations. It is not only an important link for the coordinated development of East, Central and West, but also an important growth pole for the implementation of the strategy of the rise of the Central Region. The undertaking industrial transfer policies and economic development in China have led to changes in construction land in the region.

