


 Inglés (pdf)
 Articulo en XML
 Referencias del artículo
 Enviar articulo por email
 Citado por SciELO
  Citado por Google
  Similares en
SciELO
Similares en
SciELO  Similares en Google
 Permalink
Introduction
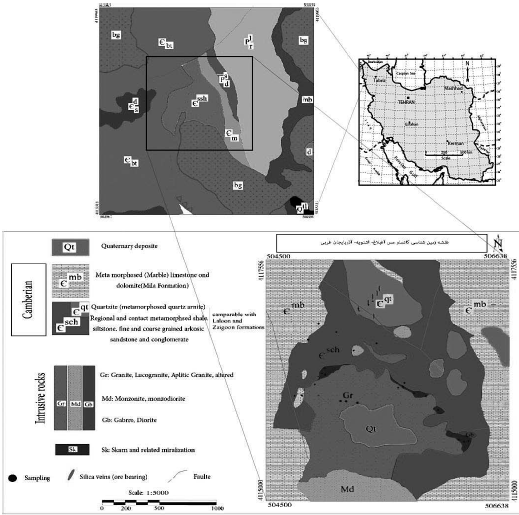
The Aghbolagh copper deposit in the southwest of West Azarbaijan Province and 10 km north of Oshnavieh city, in the range of 45°,01' to 45°, 09' east length, and 37°, 09' to 37°, 13' in the northern latitude in the contact of the Oshnavieh granitic mass was created with the Cambrian carbonate rocks and in the Sanandaj-Sirjan zone. Also, infiltration of the mass and mineralization solution at distances away from contact and within the sandstone sequences resulted in the formation of quartzite rocks and copper ore veins (Figure 1). The Oshnavieh intrusive assemblage has emerged of three intrusive families of diorite, granite, and alkali syenite-alkali granite (AS-AG) in the northwestern part of the Sanandaj-Sirjan zone. The granite family (one of the three Oshnavieh intrusive mass) with the distinctive features of S-type granites is the result of the partial melting of the Polite-Gray Wake stones (Ghalamghash et al., 2011).
Oshnavieh intrusive masses are one of the actual intrusions in the Sanandaj-Sirjan zone. This area has previously been investigated by researchers such as Naghizadeh et al. (2004) to prepare a geological map 1: 10000 of Oshnavieh (Ghalamghash et al., 2011). From the perspective of isotopic age determination, the K-Ar method has been investigated. Due to the formation of region diorites and their synchronization of formation with granite rocks 100 million years ago, the Oshnavieh intrusive assemblage appears to be the result of the subduction of the Neotethys oceanic crust beneath central Iran. Dating by the K-Ar method on granitic biotites has shown periods of 100 + 1.9 and 98.9 + 1.5 million years (late Early Cretaceous) (Ghalamghash et al., 2011).
One of the most useful ways to interpret the petrogenetic of intrusive masses is to use geochemical data and to study changes and ratios of major and trace elements in these masses (Tabatabaiemanesh et al., 2011). Experimental proof of the origin of hydrothermal solutions responsible for the formation of skarn deposits is one of the most essential stages of studies of these types of deposits. The condensation of rare earth elements, La to Lu, in hydrothermal solutions provides useful information on the origin of the constituent elements of the deposit containing the basic elements (Kato, 1999). One of the significant advances in ore deposits researches in recent years is the development of geochemical models related to various stages of transport and deposition of the ore-bearing fluids. These models, which are widely used in the design of exploration strategies, are primarily based on information obtained from fluid inclusion.
Fluid inclusions are the only source of information on the density of mineralized fluids. The eutectic point for the NaCl + H2O system is approximately Te <-20.8CO. However, the eutectic point or Te in some of the samples studied is lower than -20.8 CO, indicating the presence of salts other than NaCl in the mineralizing fluid.
Materials and methods
For the microscopic study of samples, 21 thin sections and polished sections were prepared. After microscopic studies of samples and determination of tissue relationships between minerals and for geochemical works, 22 samples were analyzed by XRD and 22 samples of ICP-MS and three samples for analysis of 10 oxides analyzed by Zarazma Company (Table 2).
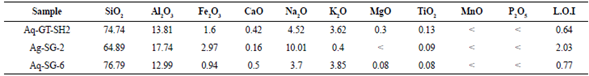
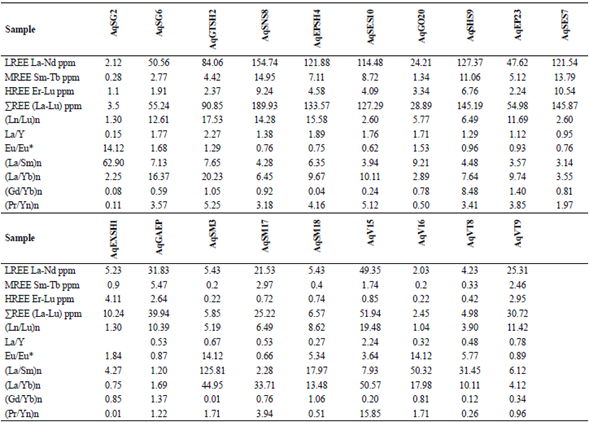
Table 2 Values of Rare earth Elements of Aghbolagh Ore deposit Samples and Ratios Between Rare earth Elements for Conditions Evaluation of Ore Formation
For investigating the involved fluids, measurements were done using the Linkham THMSG600 heater and freezer plate and mounted on a polarized microscope with the Olympus model and separate from staging.
Fluid inclusion studies have been performed on quartz (3 samples) and garnet minerals (2 samples). For the study of fluid inclusions, five polished doubly sections were prepared. After performing petrographic fluid inclusions on them, five samples were selected for micro-thermometers measurements, and micro-thermometers measurements on 30 inclusions in quartz ore and 15 inclusions in garnet ore was performed.
Geology
The Aghbolagh copper deposit is located in the northwestern end part of the Sanandaj-Sirjan zone in terms of structural position. According to map 1:100,000 (Naghizadeh, 2004), Oshnavieh is partially separated and located in the Aghbolagh copper deposit, including Cambrian geological units. Barut Formation: alternating limestone and gray dolomite crystallized with shale; Soltanieh Formation: dolomite, creamy dolomitic limestone containing chert, marble; Mila Formation: limestone and dolomite locally associated with dark-gray shale; Equivalence of Zagun-Lalun Formation: shale-siltstone and sandstone in green, red-gray archaeozoic sandstone. The Permian unit includes Ruteh Formation: Limestone with an interlayer of dolomite, shale and quartzite sandstone; Dord Formation: Red quartzite sandstone with shale and limestone interlayers, granite intrusive masses, diorite monzogabbro are coarse grains (Figure 1).
The most prominent geological units in the order of old to new consist of Cambrian units (quartz sandstone, metamorphosed carbonate rocks (dolomite and metamorphic limestone), shale, and siltstone altered), Permian units (quartzite rocks) and sandstone and dolomite, which are from Quaternary formations. The most important economic and geological features of this area are Cu mineralization at the site of granitoid contact with marble and outward copper mineralization within quartzite sandstones and veins (Figure 1).
Aghbolagh granite mass
In field surveys, the granite mass is in the central part of the range. These medium to coarse-grained granites have a bright, white appearance (Figure 2A and 2D). This mass is leucocratic, containing significant quartz minerals, feldspar, plagioclase, and biotite, muscovite, sericite, and dark minerals, mainly pyrite (Figure 3). These granites are poor in terms of the percentage of dark minerals, which is a characteristic feature of these granitoid, reducing their color coefficient. The low rate of mafic minerals in these rocks can be called leucogranite (Moein Vaziri and Ahmadi, 2001).
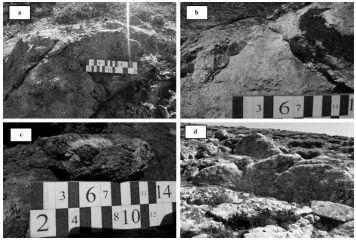
Figure 2 a: A view of the light granite mass, b: A view of the granite mass with pyrite minerals, c) A view of the alteration of the iron ore and its discoloration, d: A view of the Aghbolagh copper ore deposit's granite outcrop.
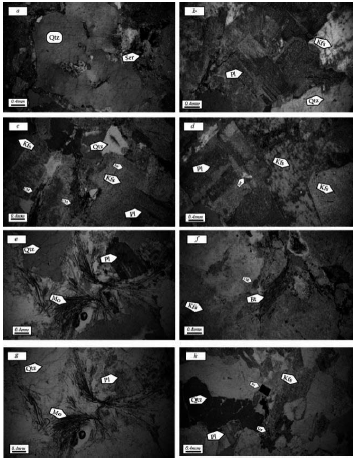
Figure 3 Microscopic images of igneous rocks of the area: a) amorphous quartz minerals and intrusions of sericite, b) polysynthetic micelle in plagioclase showing little alteration, c) minerals forming granite, chlorite, feldspar potassium altered to sericite, quartz, and plagioclase, d) altered plagioclase and feldspar potassium, e) birefringence of muscovite with plagioclase and quartz, f) biotite and chlorite (biotite chlorite). Qtz=quartz, Pl=plagioclase, Kfs= K feldspar, Bt= biotite, Chl= chlorite, Ser= sericite, Mo= muscovite
The granite intrusions are weathering, and have been altered at the surface. The color of the mass is predominantly white with fine- to medium minerals and crystal-coarse in some places.
The anorthosite minerals were visible in the central, coarse-crystalline sections, and towards the contact, the size of the minerals decreases, and it takes on aplitic texture. The dark minerals of this mass are mainly pyrite (Fig. 2b), and in areas where more alteration has taken place, the mass has been reddish to brown (Fig. 2c). This unit is the leading cause of the formation of skarn, and the resulting solutions have formed mineralized veins.
For naming, determination of the magmatic type, series, and tectonic position of Aghbolagh intrusive mass have been discussed. In this regard, two samples from different sections and one from the contact boundary were taken and sent to Zarazma Company for analysis of ten oxides (Table 1).
Based on the diagram (Cox et al., 1979), the intrusive mass object of this study has a granite composition, and according to the diagram (De La Roche et al., 1980), they have a combination of granite to alkali granite. And based on the diagram (Peccerillo and Taylor, 1976), the samples are in the range of high-potassium calc-alkaline series (Figure 4b). Based on the work of Shand (1943), modified by Villaseca et al. (1998), the granite mass is in the pre-alumina class (Figure 4d). And also, by using SiO2 diagram against A/CNK (Taylor, 1976), the mass can be classified into S-Type granites.
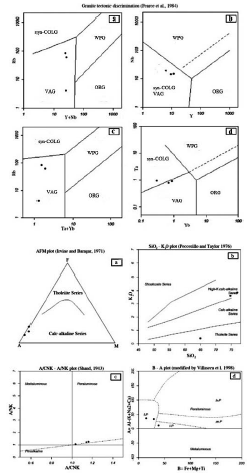
Figure 4 Diagrams used to determine the magmatic series of Agbolagh granitic mass a) The position of the intrusive samples in the AFM diagram (A = (Na2O + K2O), F = FeOt, M = Mgo), (Irvine and Baragar, 1971) b) The position of the samples in the SiO2 diagram versus K2O (Peccerillo and Taylor, 1976) c) Position of the specimens in the A/CNK-A/NK Aluminum Diagram (Shand, 1943) d) The position of the samples in the B-A Plot diagram (A = Al- (K + Na + 2Ca), B = Fe + Mg + Ti (Villaseca et al, 1998)
The position of the intrusive mass is based on diagrams (Pearce et al., 1984) of Volcanic Arc Granites (VAGs), which is formed simultaneously as the Syn-collisional. According to the diagrams (Schandl and Gorton, 2002), the studied granites are related to the active margin of the continents, consistent with the nature of the Sanandaj-Sirjan zone (Figure 5).
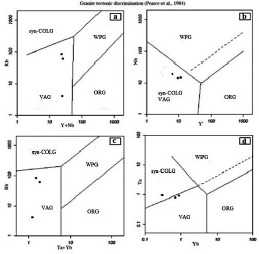
Figure 5 The position of the specimens related to the Aghbolagh granites mass in the diagrams (a) Rb against Nb, (b) Y + Nb against Rb, (c) Y against Ta, (d) Ta+Yb against Yb, to determine its tectonic position. (Adapted from Pearce et al., 1984).
Geology of skarn unit
The skarn unit is continuously expanding in the northern part of the intrusive mass along the west to east. This unit is fully covered and can only be identified with garnite outcrops (Figure 6a) and Hornfels and gossans (iron hat). Mineralogy is only visible in a small part of the western range, but the presence of iron warhead indicates the presence of sulfide ores below (Figure 6C). The minerals that can be identified in the hand sample in this section are quartz, garnet, epidote, cordierite, calcite, and minerals, including chalcopyrite, bornite, malachite, and azurite (Figures 6 and 7).
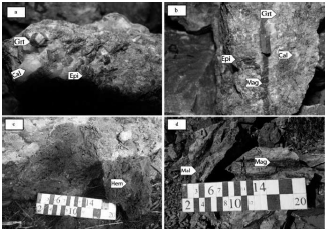
Figure 6 Macroscopic images of the Aghbolagh copper ore deposit exo-skarn zone a. View of garnet's hand sample, epidote, and calcite of the exo-skarn zone; b. View of garnet's hand sample in light brown, epidote, calcite, and magnetite vein; c. View of the iron cap showing is a supergene zone; d. View of the mineralization in the exo-skarn zone with magnetite, malachite, azurite, and chalcopyrite minerals. Grt= garnet, Mag= magnetite, Epi=epidote, Mal= malakite, Hem=hematite, Cal=calcite
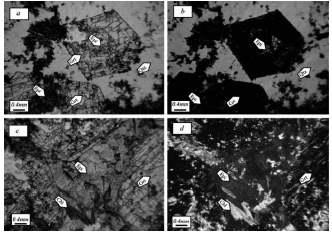
Figure 7 Microscopic images of the exo-skarn zone of Aghbolagh region: a) garnet mineral in normal light and its alteration to epidote; b) garnet mineral, epidote, and quartz in cross light; c) epidote mineral of pseudomorph garnet, chlorite in normal light; d) pseudomorph epidote after garnet. Qtz=quartz, Grt=garnet, Epi= epidote, Chl=chlorite
Geology of vein ore deposit
These deposits in particular contain sedimentary rock (dolomite, limestone, sandstone and shale) that have been affected by the intrusions of Stoke, Dyke and Middle to Felsic igneous floods. (Figure 8) (Morris, 1986; Cox, 1986).
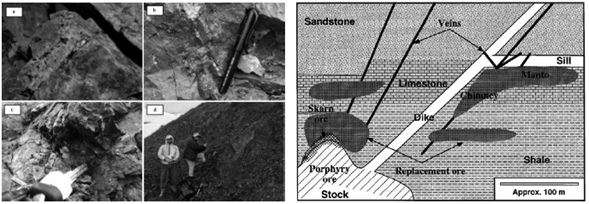
Figure 8: Schematic image of a substituted polymetallic deposit, that showing different types and host rocks. (Morris, 1986; Cox, 1986) Figure 9: (a): Overview of quartz samples containing chalcopyrite mineralization, malachite, (b): Quartz vein containing copper mineralization (chalcopyrite, chalcocite, malachite and azurite), (c): View of azurite and chrysocolla mineralization, (D): A view of the quartz vein containing mineralization
The sandstone zone is located about 200 meters from the intrusive mass behind marble rocks. The ore solutions enter through the marble through the seams and crevices in the sandstones (the seam and crevice was probably caused by the igneous mass intrusion), which is a good place to deposit soluble materials. . In the meantime, veins of several centimeters to 3 meters thick are formed in these rocks. The veins are quartzitic and contain minor amounts of microcline, muscovite, sercite, hematite, goethite and sulfide and carbonate minerals based on XRD and light analyzes. Soil space filling structures and dog teeth construction are abundant in this area.
Chalcopyrite, chalcocite, malachite, azurite and quartz are minerals in this part of the deposit (Figure 9).
Discussion and investigation
Rare Earth Element Geochemistry (REE)
Most studies of the behavior of Rare Earth Elements (REEs) in hydrothermal environments in active systems have been reviewed. So far, relatively few studies have been performed on the distribution processes of rare earth elements in fossilized hydrothermal systems or leachate metasomatism products from igneous, metamorphic or hydrothermal fluid associated with leached skarn deposits in carbonate rocks and adjacent silicates. Extensive metasomatism of rare earth elements can occur in low- to medium-depth hydrothermal systems, and the geochemistry of these elements can be useful in identifying the origin of skarns and related deposits (Adriana et al., 2009).
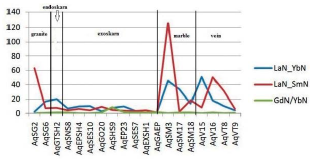
The chondrite-normalized REE pattern for the granite mass, skarn, marble, and vein deposit indicates that although the REEs pattern is slightly uniform, the LREEs overall show more enrichment than the HREEs in different lithologies (Figure 9). The range of numbers normalized to chondrite in Aglabagh deposit varies considerably, (2.58 to 141.93 for La and 0.14 to 27.27 for Yb). This indicates that distinct differences in the increase and decrease of LREEs and HREEs occurred during the formation of the Aghbolagh ore deposits.
To evaluate the separation coefficient, between REEs, different ratios of REEs including (La/Yb)n', (La/Sm)n and (Gd/Yb)n are used. (La/ Yb)n calculates the separation coefficient of LREEs from HREEs during geochemical processes (Aubert et al., 2001; Yusoff et al., 2013) and calculates two other ratios of separation coefficients between LREEs and MREEs and between MREEs and HREEs. (Yusoff et al., 2013).The extent of these ratios, range from (0.42 to 50.56) for (La / Yb) n and (0.25 to 125/80) for (La / Sm) n and (0.006 to 8.48) for (Gd / Yb) is n). The highest separation occurred between LREEs and HREEs (more than 125) and the least separation occurred between MREEs and HREEs during the scanning process. The highest coefficient of these ratios is in marble zone and only the coefficient (Gd / Yb) n in skarn has the highest coefficient, indicating that the highest separation in marble zone is not only due to HREE deficiency but also due to HREE and MREE deficiency.
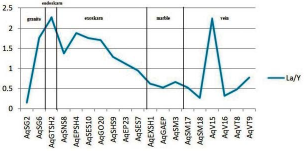
It is a zone. The La / Y ratio well indicates the pH conditions of the deposit formation environment. (La / Y> 1) indicates alkaline conditions and (La / Y <1) represents acidic conditions (Crinci and Jurkowic, 1990). This ratio in the Aghbolagh deposit ranges from (0.09 to 2.26). Intrusive mass shows the highest (La / Y) ratio of 2.26.
The granite mass shows the highest amount of La / Y (2.26). The skarn zone (endoskarn and exoskarn and ore present in exoskarn) show two types of conditions. Type 1: Section where La/Y> 1 ratio is observed in samples close to the mass and skarn ore is also in this range. Option 2: Part where the ratio La/Y<1 is close to marble lithology. These divisions are indicative of acidic conditions and hydrothermal alteration during the skarnification process. This is also observed in the veins of the Aghbolagh deposit. According to the diagram of the deposit from the beginning of the granitic mass to the middle of the exoskarn zone (sample Aq-SES7), alkaline conditions were dominant and from this point to the end of the host rock (marble) acidic conditions were present. In the case of vein deposit, the sample also contains alkaline mineralization and other samples show acidic conditions. Hence, we can predict that in an environment affected by hydrothermal solutions where acidic and hot solutions containing REE are found due to interaction with dilute carbonate rocks and they are found to be alkaline state.
The Eu / Eu * anomaly in the Aghbolagh copper deposit ranges from (0.62 to 12.14) (Figure 2 and Table 2). More than one is called a positive anomaly and less than one is called a negative anomaly. The Eu / Eu * anomaly was positive in the intrusive mass, negative in the skarn zone, and again positive in the marble section. So in this section we have two positive anomalies on the mass side and host rock and one negative anomaly is observed in the skarn zone. These anomalies can be interpreted by the presence of plagioclase at the mass side and the presence of albite minerals in the marble zone and vein-section. In the skarn zone, the anomaly is negative due to the absence of plagioclase (Zamanian and Radmard, 2016). The positive Eu anomaly indicates the stages of rock change in an acidic environment (Kikawada, 2001). Positive anomalies of Eu and (La / Lu) n also indicate high temperature acidic liquids (Wood, 1990). Based on two parameters Eu / Eu * and (Pr / Yb) n in the skarn zone, two types of hydrothermal solutions can be identified that affect the host rock: 1) solutions of low REE concentration with anomaly Eu positive and acidic conditions and oxidizing property. 2) REE-rich solution with negative Eu anomaly indicates alkaline conditions of such a solution (Figure 10).
The presence of a high ratio of exoskarn to endoskarn and extension of the exoskarn zone indicates low depth conditions (less than 5 km) and intense oxygen activity (oxidation conditions) (Zamanian, 2003).
Involved Fluids
Sample Number: Ag-SG-2
Sample Feature: This sample consists of quartz and carbonate. Large crystalline quartzes are observed between the faceted carbonate crystals. Gaseous single phase phases are abundant in quartz crystals. These inclusions are elliptical and elliptic and vary in size from 2 to 10 microns. These inclusions also coincide with fluid-rich biphasic inclusions, which is evidence of boiling.
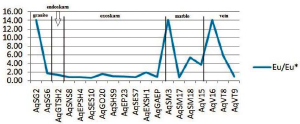
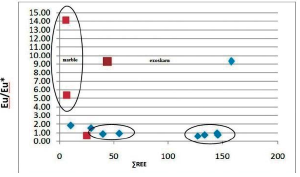
Figure 12 Graph of changes in the ratio of £REE to Eu / Eu * in the Exoskarn Zone and Aghbolagh ore deposit marble.
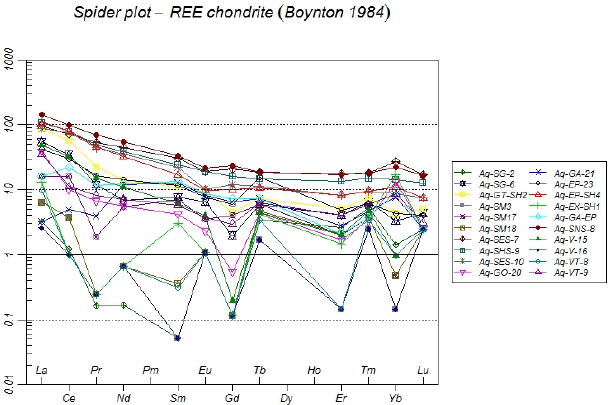
Figure 13 Spider diagram of samples of different zones of aghbolagh copper ore deposit, normalized to chondrite (Boynton, 1984)
Liquid-rich biphasic inclusions are often observed as dispersed aggregates and to a lesser extent as single ones. These inclusions are very high in sample (Figure 14).
Figure 14 Left: Accumulation of liquid-rich biphasic inclusions with irregular shapes. Right: A single fluid-rich two-phase inclusion.
Homogenization temperatures to liquid phase of fluid-rich two-phase inclusions are from 190 to 325.2 ° C. Most of the measurements were done at temperatures of 310 to 340 ° C.
The salinity of these inclusions varies from 7.31 to 20.67 % weight percent of salt equivalent and most of the measurements are between 9 and 12 % weight percent of salt equivalent. In the salinity versus homogeneous temperature diagrams for a fluid-rich two-phase inclusions, an isothermal mixing process is observed (Figure 15).
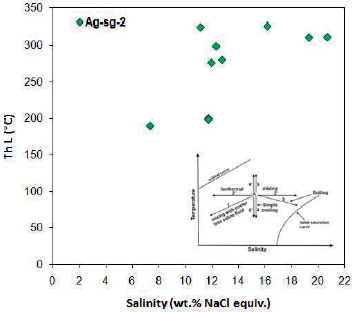
Figure 15 Distribution of homogenization temperature against salinity for liquid-rich two-phase inclusions in Ag-sg-2 sample. The isothermal mixing process is observed. Trends from Wilkinson (2001).
By examining the fluid inclusions in the quartz mineral in this sample, a main fluid was identified as a fluid with high temperature and low to medium salinity (temperature 310 to 340 ° C and salinity about 9 to 12 % weight percent of salt equivalent). The mixing process of fluid temperatures affected the evolution of the fluid.
The modified source diagram of Kesler, 2005 was used to determine the source of the fluids, based on which the fluid-rich two-phase inclusions are located within the seawater (Figure 16).
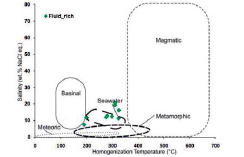
Figure 16 Chemical composition of hydrothermal fluids based on the type of hydrothermal system in the salinity diagram against homogenization temperature (modified after Kesler, 2005). Most of the samples are within the seawater range.
Sample Number: Ag-Ga-21-B
Sample Feature: This sample consists of a massive garnet with quartz. Transparent quartz crystals are formed in the space between the faceted garnet crystals. Fluid inclusions have been identified in garnet and quartz crystals.
Types of Fluid inclusions in Garnet: Single-phase gas-liquid, liquid-rich two-phase short-lived gas-phase single-phase inclusions are often found in garnet crystals. These inclusions are tear-shaped, irregular, and elliptical, varying in size from 2 to 10 microns.
In garnet, liquid-rich biphasic inclusions consist of a liquid phase and a vapor bubble. In these inclusions, the vapor phase volume is about 20 to 30 percent of the inclusion volume. These inclusions range in size from 2 to 10 microns and are often elliptical. The abundance of these inclusions in Garnet is low (Figure 17).
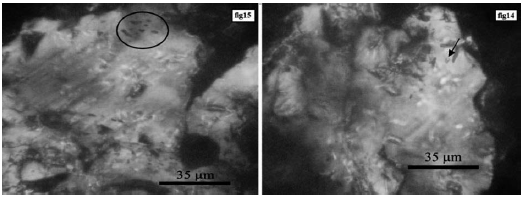
Figure 17 Left: Accumulation of single phase gas inclusions, in garnet. Right: A single liquid-rich two-phase inclusions in garnet.
In this sample micrometer studies were performed only on garnet minerals. Liquid phase homogenization temperatures are fluid-rich two-phase inclusions from 295.3 to 460 ° C. Most of the measurements were performed at temperatures of 310 to 350 ° C.
The salinity of these inclusions varies from 11.58 to 18.96 % weight percent of salt equivalent and the highest salinity frequency is from 13 to 19 % weight percent of salt equivalent. In the diagram of the homogenization temperature against salinity for fluid-rich two-phase inclusions, a distinct process of fluid isothermal mixing is observed.
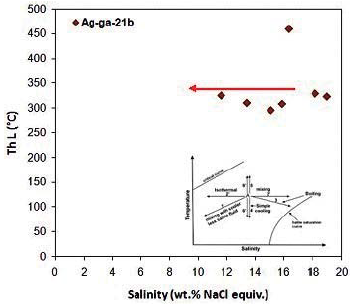
Figure 18 Distribution of homogenization temperature against salinity for liquid-rich two-phase inclusions in Ag-ga-21b sample. The specific mixing process of fluid temperature is observed. Trends from Wilkinson, 2001.
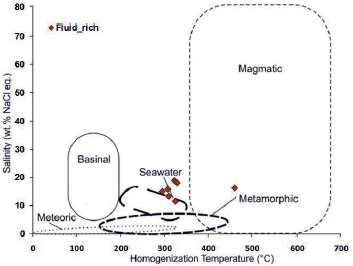
Figure 19 Chemical composition of hydrothermal fluids based on the type of hydrothermal system in the salinity graph against homogenization temperature (modified after Kesler, 2005). The position of the data in this sample is not in a certain position due to fluid mixing.
By examining the fluid inclusions in the garnet mineral in this sample, a high temperature fluid (310 to 350 ° C) and a salinity ranging from 13 to 19 % weight percent of salt equivalent were identified. The mixing process of the fluid temperature justifies the relatively large changes in fluid salinity.
Sample Number: Ag-Ga-21-A
Sample Feature: This sample consists of a semi-faceted mass garnet with coarse-grained quartz. Quartz fills the space between garnet crystals. The garnet and quartz minerals host fluid inclusions in this sample (Figure 20).
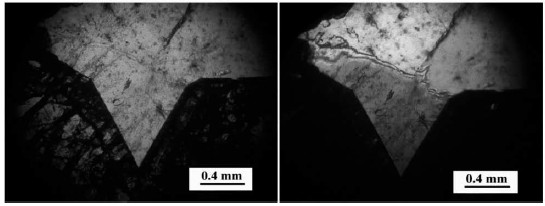
Figure 20 Left: Transparent quartz containing fluid inclusions between garnet (isotropic) crystals. PPL light. Right: Transparent quartz with fluid inclusions between garnet crystals (isotropes). XPL light.
Types of Fluid inclusions in Garnet Minerals: Single-Phase Liquid inclusions, Single-Phase inclusions, Liquid-Rich Two-Phase inclusions, and Halite Multiphase inclusions (Figures 21).
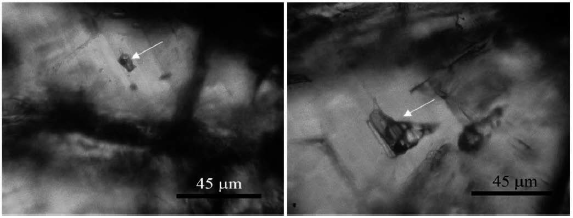
Figure 21 Left: A halitized multiphase inclusion in garnet. Right: A halitized multiphase inclusion with clear and dark solid phases in garnet.
Types of Fluid inclusions in Quartz Minerals: Single-Phase Gaseous Intermediate, Liquid-Rich Two-Phase inclusions (Two Generations)
In garnet, there is a low frequency single phase liquid inclusions ranging from 5 to 10 microns, and most of them about 5 microns, often with irregular shapes. Single-phase gas inclusions are abundant and often have elliptical and lacrimal forms. These inclusions range in size from 5 to 15 microns and are dark in color because of the rich gas.
Liquid-rich biphasic inclusions consist of a liquid phase and a vapor bubble. In these inclusions, the vapor phase volume is about 30 to 40 percent of the inclusion volume. These inclusions range in size from 5 to 25 microns and often have irregular, lacrimal and elliptical shapes. The frequency of these inclusions in the sample is low.
Multi-phase halite inclusions were observed in the Garnet mineralization. These inclusions have little frequency. These inclusions are irregular and irregular. These inclusions range in size from 10 to 30 microns. The vapor phase volume in these inclusions is 30-40% of the short-circuit volume and the halite phase volume is about 40% of the short-circuit volume. Most of them have one or more solid or dark solid phases.
Single-phase gas quartz mineral inclusions are observed as dark inclusions due to the presence of gas phase in them. These inclusions are elliptical and tear-shaped, and their abundance is low in quartz.
Two generations of liquid-rich biphasic inclusions were observed in quartz. Generation 1, which is a liquid-rich two-phase inclusions in which the volume of the vapor phase is about 40 to 50 percent of the short-circuit volume. These inclusions are elliptical, rectangular, and lacrimal. These inclusions range from 3 to 15 microns. These inclusions are abundant in quartz. This inclusions is observed with single-phase gas inclusions, which can be evidence of fluid boiling.
Generation 2, which is a liquid-rich biphasic inclusion whose vapor phase volume is about 20% of the inclusion volume. The vapor phase Brownian motion is seen in these inclusions. These inclusions are 3 to 10 microns in size. The abundance of these inclusions is low in quartz.
In this sample, two-phase liquid-rich inclusion and halite-rich of garnet minerals were measured by micro-thermometers. Liquid phase homogenization temperatures are fluid-rich two-phase inclusion from 270.3 to 510.2 ° C, with the most frequent measurements being carried out at temperatures of270 to 310 ° C.
The salinity of these inclusions varies from 13.17 to 21.68 % weight percent of salt equivalent and the highest salinity is 16 to 22 % weight percent of salt equivalent. There is no particular trend in the salinity diagram for the homogenization temperature for liquid-rich two-phase inclusion (Figure 22).
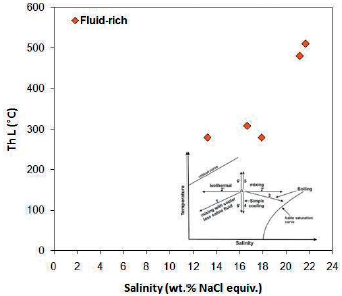
Figure 22 Distribution of homogenization temperature against salinity for liquid-rich two-phase inclusion in Ag-ga-21a sample. There is no clear trend. Trends from Wilkinson, 2001.
In this sample, due to the low frequency of halite inclusions in garnet mineral, only 3 inclusion of this type were analyzed. Liquid phase homogenization temperatures are halite-rich multiphase inclusion ranging from 395.2 to 490.3 ° C.
The salinity of these inclusions varies from 46.9 to 58.5 % weight percent of salt equivalent and the dissolution temperature of the salts in the studied multi-phase inclusion varies from 395.2 to 490.3 ° C.
Examination of the fluid inclusions in the Garnet mineral revealed two fluids in this sample: a high temperature fluid (about 500 ° C) and a salinity of about 50 wt% salt equivalent and a fluid with a temperature of270 to 310 ° C. C and salinity 22-22% by weight percent of salt equivalent. The initial formation of the garnet is likely to have occurred with the first fluid and the subsequent fluid with lower temperature and salinity has affected the garnet, causing the garnet to calcite and quartz alteration.
The modified fluid diagram of Kesler, 2005 was used to determine the source of the fluids, based on which the fluid forming most of the fluid inclusions in this sample has magmatic water origin (Fig. 23). Wilkinson, 2001 diagram was also used to determine the type of fluid genesis in the study sample. In this diagram, fluid-rich, two-phase inclusions and fluid phases are in the fluid range associated with skarn deposits and with tin and tungsten granitoid deposits. Since the fluid inclusions data in this sample are obtained from garnet ore, the type of this sample is related to skarn ore deposit.
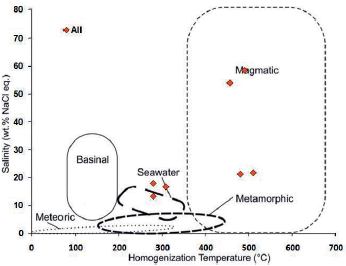
Figure 23 Chemical composition of hydrothermal fluids based on the type of hydrothermal system in the salinity diagram against homogenization temperature (modified after Kesler, 2005). The position of most of the data in this sample is in the magmatic water range.
Sample Number: Ag-v-16
This sample is a vein composed of quartz and ore matte. Large crystalline quartzes are observed between the faceted carbonate crystals. The readable fluid inclusions were observed only in quartz crystals.
Liquid-rich biphasic inclusions consist of a liquid phase and a vapor bubble. In these inclusion the vapor phase volume is about 30% of the inclusions volume. These inclusion range in size from 2 to 15 microns and often have irregular, lacrimal and elliptical shapes. The frequency of these inclusions is high in quartz (Figure 24).
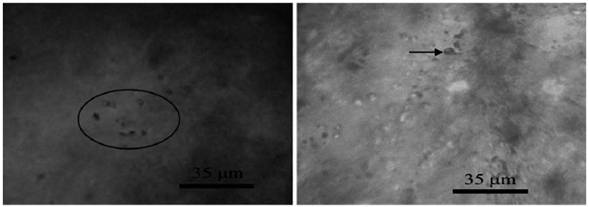
Figure 24 Left: Accumulation of liquid-rich biphasic inclusion with irregular shapes. Right: A single gas single-phase inclusion.
By examining the fluid inclusions in the quartz mineral in this sample, two fluids were identified: a fluid with higher temperature and salinity (temperature 280 to 310 ° C and salinity 12 to 15 % weight percent of salt equivalent) and a fluid with low temperature and salinity Low (190 to 220 ° C and salinity 9 to 12 % weight percent of salt equivalent).
The modified source diagram of Kesler, 2005 was used to determine the source of the fluids, based on which the fluid constituting this sample has seawater and basin salinity (Figure 25). The modified fluid diagram of Kesler, 2005 was used to determine the fluid genesis type in the studied sample, based on which the fluid constituting this sample has seawater and basin salinity (Figure 1). 25). Wilkinson, 2001 diagram was also used to determine the type of fluid genesis in the study sample. In this diagram, fluid-rich two-phase inclusions are in the fluid range with epithermal and skarn deposits.
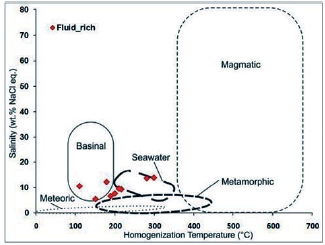
Figure 25 Chemical composition of hydrothermal fluids based on the type of hydrothermal system in the salinity graph against homogenization temperature (modified after Kesler, 2005). The location of the data in this sample is in the seawater and basin salinity range.
Discussion
In the samples of these studies, micrometers of fluid inclusions were performed on the garnet and quartz minerals. In the study of liquid-rich biphasic fluid inclusions in a garnet mineral, a fluid with a temperature of 270 to 350 ° C with an average salinity of 16 to 19 wt.% Salt equivalent was identified (Figures 26 and 27). This fluid is probably related to a retrograde alteration in the scarification process that resulted in the alteration of garnets and the formation of low-temperature minerals such as quartz and calcite from the garnet. The evolution of this fluid mixing process has been inluenced by the fluid temperature. Garnet minerals also identified halitoneic inclusions that have a temperature of about 500 ° C and a salinity of about 50% by weight of salt, which can be related to the progressive fluidization of the skarn systems and lead to the formation of skarn systems. Garnet is included in this system.
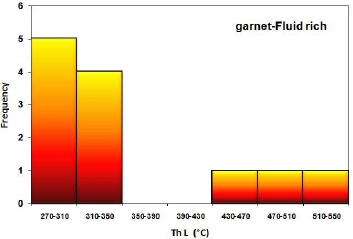
Figure 26 Frequency distribution of homogenization temperature in liquid-rich two-phase inclusions in garnet minerals in studied samples.
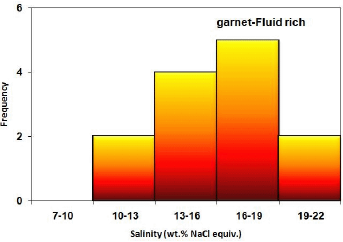
Figure 27 Frequency distribution of salinity in fluid-rich two-phase inclusions in garnet minerals in studied samples
In the investigation of fluid-rich biphasic fluid inclusions in quartz minerals, two fluids were identified, with the first fluid having a temperature of 260 to 300 ° C and a salinity of about 15 to 12 % weight percent of salt equivalent (Figure 28). This fluid is most likely equivalent to a retrograde alteration fluid in the garnet mineral and reflects the initial quartz formation temperature. Quartz mineralization also revealed a fluid with a temperature of 180 to 220 ° C and a salinity of 9 to 12 % weight percent of salt equivalent, which is a delayed fluid in the system. In the evolution of these two fluids in quartz, fluid mixing processes with lower and cooler salinity, fluid temperature mixing, and cooling process have a significant impact.
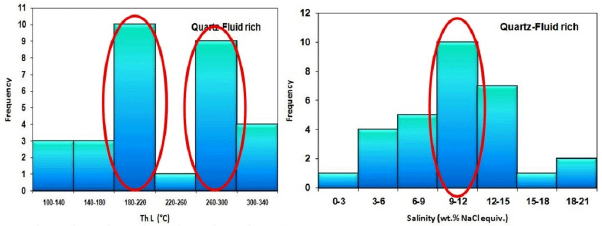
Figure 28 Left: Frequency distribution of salinity in fluid-rich two-phase inclusions in quartz minerals in the studied samples. Right: Frequency distribution of homogenization temperature in liquid-rich two-phase inclusions in quartz minerals in studied samples and identification of two fluid groups.
For halite multiphase inclusion, in all the measured inclusion, the salt dissolution temperature is equal to the temperature of the liquid phase homogeneity. The location of these inclusion near the TH = TS midline can be one of the signs of boiling in the mineralization system.
Examination of the fluid inclusion from the study sample revealed that two main groups of fluids were present in the formation of fluid inclusion:
Group 1: Salt supersaturated fluids that have been the source of the formation of halitite multiphase intermediates in the Garnet mineral during the progressive skarn alteration process.
Group 2: Salt-saturated fluids that are the source of fluid-rich two-phase interconnects in the garnet and quartz minerals in this skarn system and have been effective in retrograde alteration in the skarn system.
BULK software (Bakker 2003) was used to calculate of the formation pressure of liquid-rich biphasic inclusion. The homogenization temperature of 350° C with an average salinity of 18 % weight percent of salt equivalent was used to calculate the average pressure of the formation of liquid-rich two-phase inclusion in garnet. According to this software, the average pressure formation in the sample is 15.7 MPa (MPa), which indicates moderate pressure and formation at moderate depths (proportional to the regressive alteration in the skarn system). Homogeneous temperature of 300° C and average salinity of 12 wt% salt were used for liquid rich two-phase inclusions in quartz. Accordingly, the mean pressure of the formation of inclusion in this sample is 8.1 MPa (MPa), indicating moderate pressure and formation at low depths (proportional to retrograde alteration).Wilkinson, 2001 diagram was used to determine the type of fluid genesis in the studied samples. In this graph the fluids associated with the Garnet ore are within the fluid range associated with the skarn deposits (Fig. 29). Also, the quartz mineral fluids are partly in the skarn range and the lower temperature and salinity are in the epithermal range (Fig. 29). Finally, it is necessary to integrate geological information, alteration and mineralization in order to precisely determine the fluid genesis of the area.
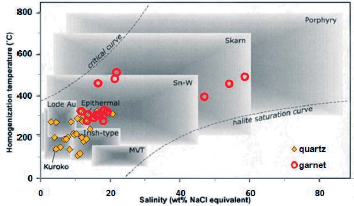
Figure 29 Salinity diagram against homogenization temperature for all types of hydrothermal deposits: Most of the garnet ore fluid inclusions in the studied samples are in the fluid range associated with skarn deposits and quartz ore fluid inclusions are in the range of skarn and epithermal deposits. Limits from Wilkinson, 2001.

