


 Inglês (pdf)
 Artigo em XML
 Referências do artigo
 Enviar este artigo por email
 Citado por SciELO
  Citado por Google
  Similares em
SciELO
Similares em
SciELO  Similares em Google
 Permalink
Introduction
The El Bagre mining district is located in the NE part of the Antioquia department of Colombia (Figure 1A), in the region known as Bajo Cauca in the Cauca-Nechí river basin between Zaragoza and El Bagre municipalities (Figure 1B). This region has long been recognized as an important historic alluvial gold district in Colombia (Shaw, 2000; Sillitoe, 2008; Londoño et al., 2009; Leal-Mejía, 2011). Lode gold type mineralization is hosted in shear zones with fragile-ductile deformation within Carboniferous granitic rocks (diorite and tonalite) of the El Carmen stock (Leal-Mejía, 2011; Naranjo-Sierra et al, 2016). Few studies (Londoño et al, 2009; Leal-Mejía, 2011; Naranjo-Sierra et al., 2016; Naranjo-Sierra and Alvaran-Echeverri, 2018; Naranjo-Sierra, 2019) related to geological characteristics, structural controls, ore-forming fluids, and metallogenic processes regarded the El Bagre area, have been reported. Londoño et al, (2009), highlighted the marked structural control of vein-type mineralization and the displacement associated with dextral inverse faults. Leal-Mejía (2011), demonstrated according to sericite K-Ar dating of280±6 Ma and isotope geochemistry data (208Pb/204Pb, 207Fb/204Pb and 206Pb/204Pb) that vein-type mineralization at El Bagre pre-dates the Jurassic intrusions of Segovia batholith (188.9±2.0 Ma., U/Pb in Zircon, Spikings et al, 2015), and proposed an intimate spatial relationship between gold vein mineralization and the carboniferous El Carmen stock. The sericite K-Ar dating of 280±6 Ma reported by Leal-Mejía (2011) from the La Ye mine and sericite Ar-Ar dating of276±5 Ma reported by Naranjo-Sierra (2019) from the Los Mangos mine, are the only evidence of a Permian gold rnineralization to date in Colombian Andes.
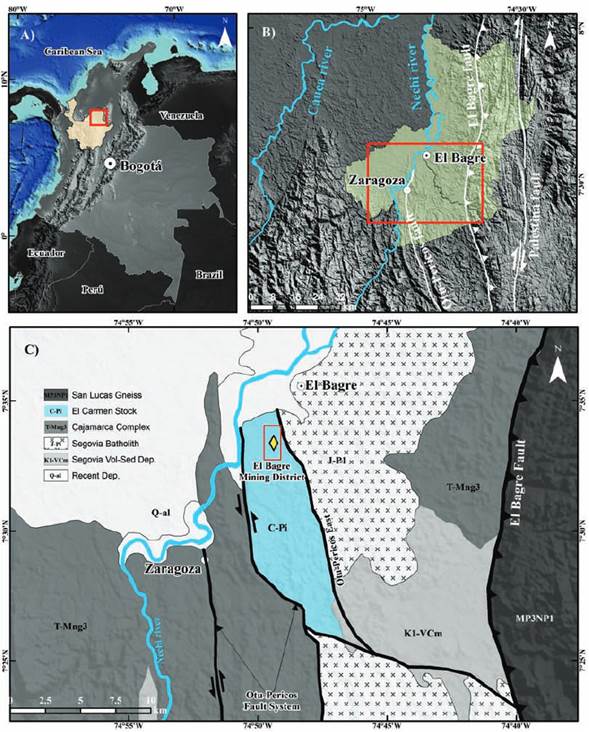
Figure 1 A). Simplified map showing the location of Colombia and Antioquia department. B). Regional map of the NE region of the Antioquia department, showing the main major faults and (in green) the region of Bajo Cauca. C). Simplified geological map of the study area based on Gomez-Tapias et al., (2015).
Based on δ18O, δD and δ34S isotopes, Naranjo-Sierra et al, (2016) proposed that the ore fluids from the La Ye shear-zone lode-gold-type deposit at El Bagre are compatible with magmatic and/or metamorphic origin. Although the fluid inclusion characteristics of the gold lodes were hitherto unknown, the authors proposed H2S or HS ligand species as the predominant sulfur species, indicating that Au(HS)- 2 was likely the gold-transporting complex. This paper presents the first microthermometric data of the main lodes from the El Bagre mining district, with the aim of characterizing the thermal and compositional evolution of the hydrothermal fluids and discuss their implications for gold mineralization. The evolution of the hydrothermal system is discussed in terms of fluid composition and temperature, with emphasis on fluid sources, gold transportation, pressure estimates, and depositional mechanisms.
Geological setting
Based on Restrepo and Toussaint (1988) and Cediel et al. (2003), the El Bagre mining district is characterized by accreted terranes (Chibcha and Tahamí terranes). Major strike-slip Otu-Pericos fault system (Figure IB and 1C) is the dominant structure in the area. This major fault system separates the Triassic low to medium grade metamorphic rocks associated to the Cajamarca Complex from the carboniferous intrusive rocks of the El Carmen stock (Gómez-Tapias et al, 2015). The western limit of the Segovia batholith and the El Carmen stock is marked by the N to NNW trending Otu-Pericos East fault (Figure 1C). The kinematics of this regional fault are not fully understood in detail; however, right-lateral as well as left-lateral faulting and thrusting seem to have occurred (Horner, 2018). To the East, along the El Bagre reverse fault system, San Lucas Precambrian metamorphic rocks make contact with the Jurassic granitic rocks of the Segovia batholith (Figure 1C). This fault system forms branches of N to NNE trending Palestina feult system, which has been recognized as a regional fault with right and left-lateral movement (Horner, 2018).
Lode gold deposits at the El Bagre mining district are best described as structurally controlled mesothermal gold-sulphide-telluride-bearing quartz vein deposits, with veining emplacement in the NS shear zones within the competent intrusive rocks of the El Carmen stock (Figure 2).
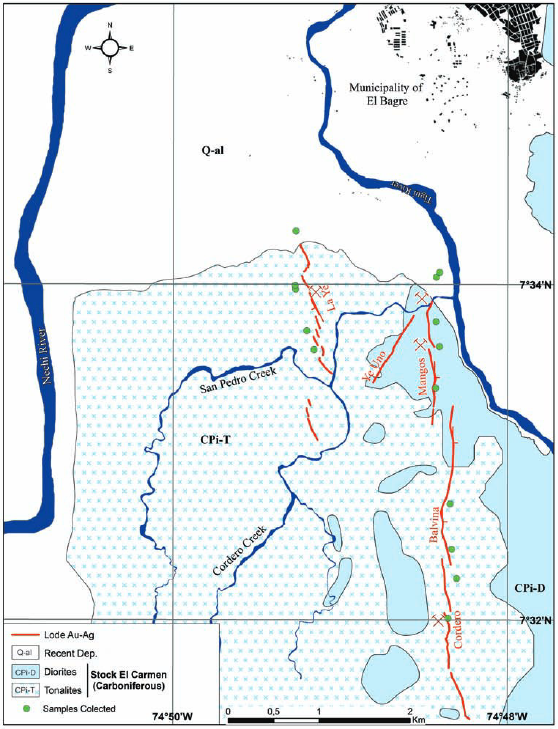
Figure 2 Local geological map of the El Bagre mining district, showing the main lode gold deposits and the samples used in this study.
These shear zones have undergone brittle-ductile deformation and are usually mylonitized around their contacts. Boudinage and vein off-sets are common associated structures in these deformed rocks. According to Starling (2015), four deformation events can be recognized at the El Bagre mining district. The D1 deformation that formed the NS-NNW structural corridor. This stage covers all the pre-mineralization events. The D2 deformation event reactivated the NS-NNW corridor as a dextral transpressional shear structure, generating WNW low-angle thrust faults and introducing significant volumes of quartz with low contents of sulphide (mainly pyrite) and gold (Figure 3A). The D3 deformation reactivated the main veins as a sinistral transpressional shear with NW-trending riedel cross faults controlling the main phase of high-grade gold-base metal-telluride mineralization (Figure 3B). The D4 deformation covers all the post-mineralization events.
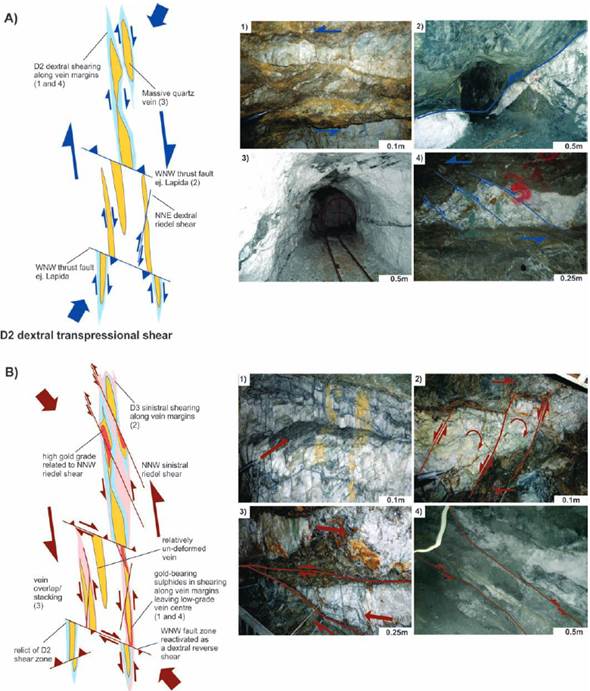
Figure 3 Principal deformation events defined by Starling (2015) at El Bagre mining district. A). D2 deformation related to dextral shearing due to NNE/SSW compression. For Figure 3A: picture # 1 showing tension gash veins indicating D2 dextral shearing along vein margins, picture #2 showing WNW thrust fault, picture #3 showing massive low-grade quartz vein and picture #4 showing domino faulting and block rotation within the D2 shear. B). D3 deformation related to sinistral shearing due to NNW/SSE compression. For Figure 3B: picture #1 showing strong NNW fracturing due to low-angle shears and step joints, picture #2 showing domino faulting and block rotation within the D3 shear, picture #3 showing overlap or duplication of vein due to vein-parallel sinistral shearing during D3 deformation and picture #4 showing massive quartz reactivation due to D3 deformation. Note: views are up-dip in roof of mine and so apparent shear sense is opposite of that in plan.
The veins consist of milky white quartz containing native gold and up to 20% mixed sulfides, dominated by pyrite with occasional galena and chalcopyrite. Sulphide and native gold distribution within the veins is patchy. Gold mineralization is restricted to massive quartz veins with pyrite, chalcopyrite, galena and tellurides. The thickness of the veins averages approximately one meter. Chloritization halos are generally restricted to the carboniferous rock near the veins contacts. Sericite and carbonates are the most common alteration minerals within the auriferous quartz veins. Sericite occur as fine-grained flakes filling fractures of massive quartz (Qvl) and reactivated quartz (Qv2). Calcite occurs as fine-grained crystals or formed narrow sheeted veins cutting massive quartz (Qvl).
Methods
Twenty quartz veins samples of different types (massive and reactivated) and at different mineralization stages were sampled from several locations within the El Bagre mining district (Figure 2). Doubly polished thin sections (80-100um) of these samples were prepared by Minerlab, Bogotá, Colombia. All the sections were studied first for petrography to define the relative timing of the fluid inclusions using a Nikon 200i Pol microscope in the laboratory of mineral deposits at Universidad de Caldas (Manizales). There were used the principles given by Roedder (1984) and the concept of Fluid Inclusion Assemblage (FIA), defined by Goldstein, (2003). Ten samples were selected for the microthermometry; measurements were performed using the Linkam THMS 600 with maximum and minimum temperature limits of 600°C and -196 C, coupled to an Olympus BX41 pétrographie microscope in the Fluid Inclusion Laboratories at the Universidad Nacional (Bogotá). According to the methods described by Roedder (1984), Goldstein (2003) and Lai et al., (2015), the Linkam stage was calibrated using two synthetic fluid inclusions from the University of Leoben, containing H20 (final ice melting temperature of 0.5°C and critical point of 374.1°C) and CO2 (CO2 melting temperature of -56.6°C), The estimated precisions of the measurements were ±0.1°C and ±1°C for freezing and heating, respectively. The heating/freezing rate generally ranged from 0.2°C/min to 5°C/min but decreased to <0.5°C/min near phase transformation. Based on Roedder (1984), Goldstein (2003) and Lai et al, (2015), the measurements at this stage, include eutectic temperature (Te), ice melting temperatures (Tm-ice), clathrate melting temperatures (Tm-cla) and total homogenization temperatures (Th). Fluid inclusions salinities were estimated by the final ice melting and final clathrate melting temperatures respectively. The results were complemented with Raman spectroscopy for the determination of the vapor phase composition, using a Renishaw inVia Centras 0281QÍ equipment which uses a laser with a wavelength of 532nm. This equipment is located in the Fluid Inclusion Laboratories at the Universidad Nacional (Bogotá). The FLUIDS software of Bakker (2003) was used for the calculations. Microthermometric measurements were performed on small groups or trails of fluid inclusions, which have constant liquid to vapor ratios. The fluid inclusions groups or trails that have experienced leakage or decrepitation were discarded. Salinity estimates were calculated using the equations summarized in Diamond (1992) for the H2O-CO2-NaCl±CH4 system and the equations of Bodnar and Vityk (1995) for the H2O-NaCl system. In this study, the equation of state proposed by Brown and Lamb (1989) for the H2O-CO2-NaCl±CH4 system and the equation of state from Bodnar and Vityk (1995) for H2O-NaCl system were used to estimate the trapping pressure.
Sample description
Quartz veins at El Bagre can be divided into two types: (1) massive quartz veins (Qvl) mostly related to dextral shear zones with low gold grades, and (2) massive reactivated quartz veins (Qv2) related to NNW Riedel shearing with high gold grades. Based on these observations and previous studies (Londoño et al, 2009; Leal-Mejía, 2011; Naranjo-Sierra et al., 2016; Naranjo-Sierra and Alvaran-Echeverri, 2018) mineralization processes could be divided into two stages (Figure 4): the quartz-pyrite stage (1) and the reactivation-sulfide (galena-chalcopyrite)-telluride stage (2).
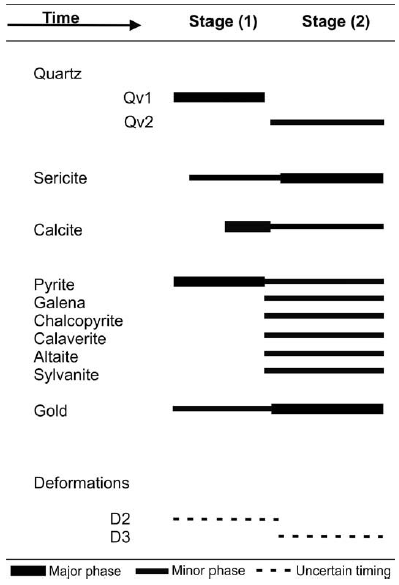
Figure 4 Paragenetíc sequence of ore, gangue and alteration minerals. Significant volumes of quartz, pyrite and low content of gold were introduced during stage (1). Main gold mineralization was during stage (2).
Stage (1) is characterized by the development of massive quartz with coarse-grained euhedral to subhedral pyrite deposited as a clusters and scarce gold mineralization (Figure 5A). Gold occurrence (Figure 5B) in this stage are mainly as small inclusions (<10um) in coarse-grained pyrite (Pyl), attached to pyrite crystals surfaces and as free-rmlling particles in massive quartz (Qvl). This early stage was significant in terms of quartz volume (see Figure 3 Apicture #3). This stage is associated with dextral shear zones due to D2 deformation. Sericite is present in this stage mainly as small flakes filling fractures in massive quartz (Qvl). Confident assignment of calcite to this stage is possible only where this carbonate mineral is associated to coarse-grained pyrite (Figure 5A).
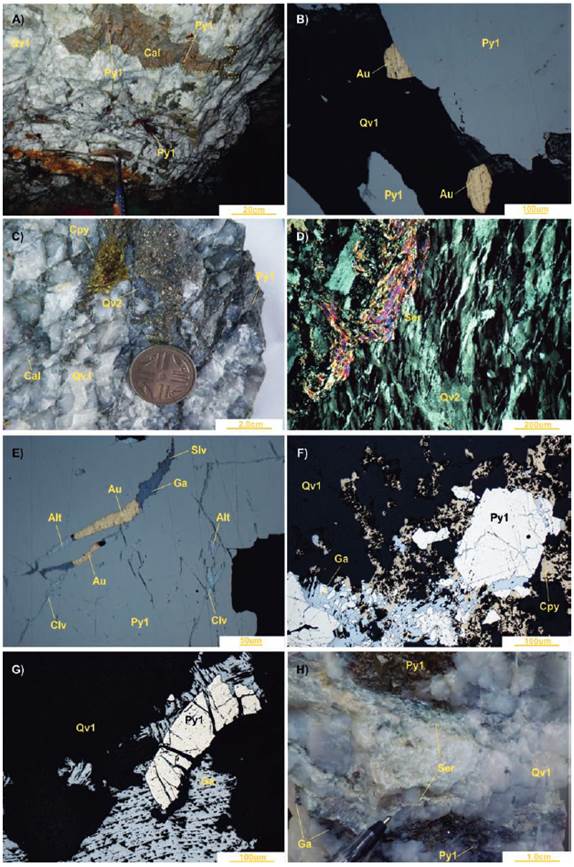
Figure 5 General aspects of shear zone hosted lode gold type deposits at the El Bagre mining district. A). Low gold grade massive quartz vein with coarse pyrite crystals associated to clusters of calcite. B). Photomicrograph (reflected light) of gold attached to coarse pyrite crystals and gold as a free-milling particle. C). High gold grade quartz vein with fragments of Qvl and pyrite (Pyl), sheeted veins of calcite and crystals of chalcopyrite. D). Photomicrograph (transmitted light) of sample show in Figure 5C. Note the sericite aggregates associated to quartz crystals showing undulose extinction, deformation lamellae and dynamic recrystallization E). Photomicrograph (transmitted light) of sample show in Figure 5C. Note gold, galena, altaite, sylvanite and calaverite filling fracture in coarse pyrite crystals (Pyl). F). Chalcopyrite and galena sealing fractures and partially replaced coarse pyrite (Pyl) crystals. G) Deformation of the characteristic triangular pits of galena. H). Sericitic alteration related to stage 2.
Stage (2) is the main mineralization stage and is characterized by modification of existing massive quartz veins (Qvl) by deformation (reactivation) associated with D3 deformation due to sinistral shearing (Figure 5C). This stage consists of an assemblage of fine-grained quartz (Qv2) with irregular-shapes and recrystallized crystals, fine-grained pyrite (Py2), base metals sulfides (chalcopyrite and galena) and tellurides. Under the microscope, the quartz crystal shows undulate extinction, deformation lamellae and dynamic recrystallization (Figure 5D). Significant gold mineralization is observed in this stage. Gold are spatially associated with (Figure 5E) chalcopyrite, galena and tellurides (calaverite, sylvanite and altaite) sealing fractures in early pyrite crystals (Pyl). Coarse pyrite is also replaced by chalcopyrite and galena (Figure 5F). Galena show deformation in their pits (Figure 5G). Major sericitic alteration is related to this stage (Figure 5H). Paragenetic relationships between tellurides is not well known, although it is likely that calaverite, sylvanite and altaite were cogenetic with gold and base metals sulfides. Calcite sealed interstitial voids around quartz crystals or formed narrow (width 1-5 mm) sheeted veins, cutting massive quartz (Qvl).
FLUID INCLUSION CHARACTERISTICS
Well-developed primary and secondary fluid inclusions are observed in quartz veins from stages (1) and (2). The analyzed fluid inclusions are trapped in quartz and calcite (Figure 6). Their paragenetic chronology was established using the criteria of primary, secondary and pseudosecondary, defined by Roedder (1984).
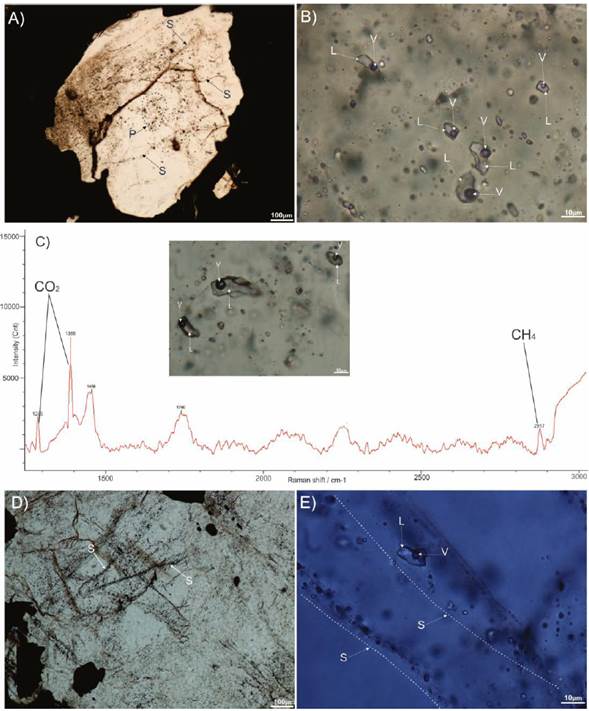
Figure 6 General aspects of the fluid inclusion observed. A). Isolated clusters (FIA) of primary (P) aqueous-carbonic fluid inclusions and secondary (S) fluid inclusions cross-cutting grain boundaries. B). Primary fluid inclusion topped in a massive quartz vein (Qvl). C). Raman spectra for type I fluid inclusions. D). Cross-cutting secondary (S) fluid inclusions. E). Secondary fluid inclusions trapped in a reactivated quartz vein (Qv2). L=liquid; V=vapor.
According to the nature of phase relationships at room temperature (20°C) and phase transitions during heating and cooling, two types of fluid inclusions were recognized: aqueous-carbonic inclusions (type I) mostly related to massive, low-grade quartz veins and aqueous-saline inclusions (type II) related to main stage of mineralization (stage 2). All the fluid inclusion types are two-phase with a L/V ratio between 0.82 to 0.97. Aqueous-carbonic inclusions [(CO2±CH4)V+(H2O)L] are volumetrically liquid-dominant, with L/V ratio between 0.93 to 0.97. These type of inclusions present natural contours with ovoid and irregular shapes. They occur as isolated clusters or FIA (Figure 6A and 6B) in deformed quartz samples, and are therefore, interpreted as primary. Laser Raman spectroscopy study indicated a low content of CO2, and detected CH4 in minor quantities (Figure 6C). Type (H) fluid inclusions [(H2O)V+(H2O)L] are the most common inclusions observed in the studied plates and are easily identified as secondary inclusions aligned as trails crossing boundaries grains (Figure 4D and 4E). They are liquid-rich inclusions with liquid ratios between 0.92 and 0.82. They have different shapes, from regular with soft edges to irregular with jagged edges.
Microthermometric properties
Type I fluid inclusions do not exhibit a melting temperature of solid C02. These fluid inclusions are characterized by the presence of clathrate, which melts between 5.0 and 9.1°C (Figure 7A), revealing the presence of CO2, confirmed by Raman spectroscopy (Figure 6C). A minor quantity of CH4 was also detected by Raman spectroscopy (Figure 6C). First melting temperature of ice range between -20.0°C and -22.6°C (±0.1°C), indicating predominance NaCl in solution (Figure 7B). Total homogenization (to liquid) temperatures occurred between 238.1°C and 297.1°C (±1°C) (Figure 7C). Molar fraction of CO2 range between 0.042 and 0.079 and molar volume range between 18.72 to 20.23 cc/mol. This relatively complex composition (H2O-CO2-NaCl±CH4) and the non-determination of the CO2 homogenization temperature make the bulk salinity estimates difficult. Using the equation by Diamond (1992) based on clathrate melting, the estimates of salinities range between 1.5 and 8.3 wt% NaCl equiv. (Figure 7D). For the primary aqueous-carbonic inclusions, the estimation of trapping pressure was calculated ignoring the CH4 content in the fluid and the non-observation of separated vapor to liquid C02-phases is indicative of a low density of the CO2 phase (Diamond, 1992; Diamond, 2001; Wilkinson, 2000; Fall, 2008). Tm-cla allows the appropriate figure to be chosen based on salinity (Brown and Lamb 1989). In the absence of CO2 homogenization temperatures, the calculations can be made using a specific CO2 density of 0.75gcm-3 (Brown and Lamb 1989; Diamond, 1992; Wilkinson, 2000; Diamond, 2001; Haeberlin, 2002). Based on the above simplifications, the estimated trapping pressures for aqueous-carbonic inclusions (type I) show relatively high pressures conditions of <5Kbar.
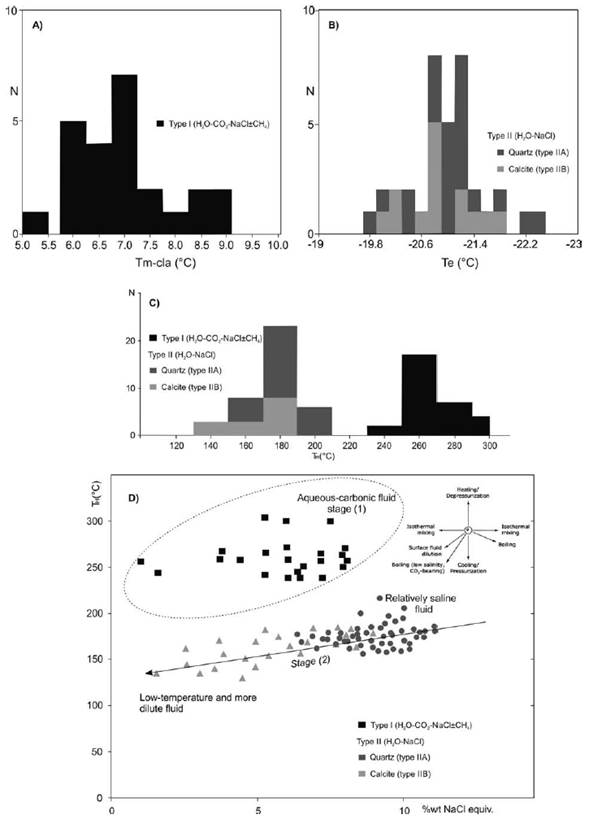
Figure 7 A). Type I fluid inclusions clarhrates melting temperatures (Tm-cla). B). Type H fluid inclusions eutectic temperatures (Te). C). Homogenization temperature (TH) histogram of type I, type HA, and type HB fluid inclusions. D). Homogenization temperature (TH) versus Salinity (wt% NaCl equiv.).
The microthermometric properties of the analyzed fluid inclusions were summarized in table 1.
Table 1 Summary of the descriptive properties and thermometric measurements of type I, type DA and type TIB fluid inclusion populations.
| Microthermometric Data | ||||||||||||
|---|---|---|---|---|---|---|---|---|---|---|---|---|
| Type | Composition | N° Phases | Form | L/V* | Classification | Host | N | Clathrate Melt Γ° | Eutectic Γ ° | Ice Melt Γ° | Homog. Γ° | Salinities |
| I | H2O-CO2-Na-Cl±CH4 | Two | Irregular isolated | 0.93-0.97 | Primary | Quartz | 23 | 5.0 to 9.1°C | -20 to -22.6°C | 238.1 to 297.1°C | 1.5 to 8.3 wt% NaCl equiv. | |
| IIA | H2O-NaCl | Two | Irregular trails | 0.82-0.91 | Secondary | Quartz | 38 | -22.5 to -19.8°C | -7.5 to -5.0°C | 150.8 to 210.6°C | 7.86 to 11.09 wt% NaCl equiv. | |
| IIB | H2O-NaCl | Two | Irregular trails | 0.82-0.92 | Secondary | Calcite | 15 | -21.9° to -20.0°C | -3.5 to -0.9°C | 130.3 to 190.4°C | 1.5 to 5.7 wt% NaCl equiv. | |
*liquid to vapor ratios of the two-phase inclusions at room temperature (20°C)
Secondary aqueous inclusions were trapped in reactivated quartz (type IIA) and cross-cutting calcite veins (type IIB). Both types yielded significant variations in their melting and homogenization temperatures. According to eutectic temperatures measured (-22.5°C and -19.8°C), NaCl is the main salt in solution (see Figure 7B). Homogenization to a liquid phase occurs between 150.8°C and 210.6°C (±1°C) for the type IIA inclusions and between 130.3°C to 190.4°C (±1°C) for type IIB (see Figure 7C). The salinity estimates were deterrnined from ice final melting temperatures, which ranged between -7.5° and -5.0°C for type IIA inclusions and-3.5° and -0.9°C for type IIB. The salinity estimates displayed a positive correlation trend (see Figure 7D) from low salinity, with a media of 3.82 wt% NaCl equiv. (type IIB) to relatively intermediate salinity, with a media of 9.21 wt% NaCl equiv. (type IIA). The density values range between 1.05 to 1.07 g/cc for type DA fluid inclusions and 1.00 to 1.03 g/cc for type IIB fluid inclusions. The molar volume for type IIA inclusions is in a range of 17.40 to 17.70cc/mol and 17.72 to 17.95 cc/mol for type IIB
Discussion
Modelling of the formation conditions of the shear zone hosted lode- gold type deposits at El Bagre was carried out based on the fluid inclusion results, ore minerals present, alteration mineralogy, and the sulfur, oxygen and deuterium isotopes reported by Naranjo et al. (2016) and Naranjo-Sierra and Alvaran-Echeverri (2018).
Pressure Estimates
Pressure were estimated from the salinities and homogenization temperatures of the fluid inclusions (Diamond, 1992 and Haeberlin, 2002). Despite the absence of geothermometric isotopic data to constraint the independent trapping temperature and the lack of conclusive evidence for an immiscibility process, the homogenization temperature is considered the minimum value for the temperature of fluid inclusion trapping (Roedder and Bodnar, 1980; Randive et al, 2014). Homogenization temperatures for primary aqueous-carbonic (type I) have a range between 238°C and 297°C and for the secondary aqueous inclusions (type II) a range between 130°C and 210°C. Due to the phase volume were calculated based on two-dimensional data, there is an inherent error in the calculations (Bakker and Diamond, 2000). However, considering that type I fluid inclusions have L/V ratios of 0.93 to 0.97 (liquid dominant), the effects of error propagation are considered relatively low.
The results obtained in this study, indicate that the stage of massive, low gold-grade quartz veins (stage 1) emplacement seems to be occurred at crustal levels (±18km, assuming near lithostatic regime) (Figure 8). However, as predicted by the variations in salinities and homogenization temperatures, there is a wide range of trapping pressures for the secondary inclusions. Type HA fluid inclusions show trapping pressures of <2.0Kbar, while type IIB fluid inclusions show pressures estimates lower than 0.5Kbar. Therefore, the fluid pressures for main gold mineralization (stage 2) are mostly between 2.0Kbar and 0.5Kbar corresponding to depths of ±7.58km to ±1.8km, assuming a density of 2.7gcm-3 and near lithostatic regime (Figure 8). These results are consistent with orogenic gold deposits type (Moritz, 2000; Ridley and Diamond, 2000; Groves et al., 2003; Goldfarb et al, 2005). This P-T evolution can be explained in terms of: (1) depth changes related to a rapid uplifting of the host unit, although the tectonic regimen in the area to support this rapid uplifting remains unclear, (2) upward migration and cooling and/or (3) the influx of a second and different fluid in the hydrothermal system. These values should be viewed as semi-quantitative, given the difficulties in accurately cxmstraining the fluid system of primary inclusion and the absence of geothermometric data to constraint the trapping temperature.
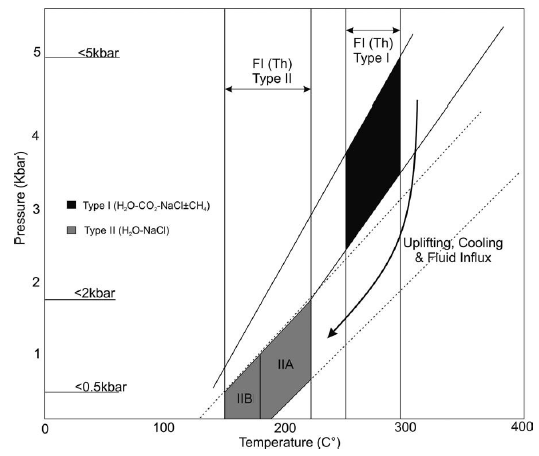
Figure 8 Pressure-Temperature versus pressure diagram showing isochores covering the range of composition and densities of type I (solid lines) and type II (dotted lines) fluid inclusions. Vertical lines limit the homogenization temperature (Th) range for type I and type II fluid inclusions. Schematic trend of different fluid evolution processes (Wilkinson, 2001).
Ore Fluid Evolution
The fluid inclusions data suggest that at least two fluids inputs and circulation systems were involved in the formation of the shear zone hosted lode-gold type deposits at El Bagre. Two fluid types were determined through the ore deposition sequence : (i) an early relatively hot H2O-CO2-NaCl±CH4 fluid broadly coeval with massive quartz (Qvl) formation that is related to dextral shearing during D2 deformation, and (ii) a relatively low temperature H2O-NaCl fluid displaying a positive correlation trend from a low salinity member with 3.82 %wt NaCl (type IIB) to relatively saline one with 9.21 %wt NaCl (type IIA), related to sinistral shearing during D3 deformation. Fluid inclusions described here share common microthermometric properties: (1) composition (Figure 9A), (2) salinity and (3) homogenization temperatures (Figure 9B), with the fluid inclusions reported in a large number of orogenic gold deposits: Pataz-Parcoy, Cachoeira, Charters Towers, Pogo, Bendigo, Linglong, Muruntau, Juneau and Jiadong (Moritz, 2000; Ridley and Diamond, 2000; Groves et al., 2003; Goldfarb et al, 2005; Golbfarb and Groves, 2015). Although some similarity with epithermal deposits (low sulfidation) is discernible in figure 9A and 9B, some key factors preclude this observation: (i) absence of adularia, chalcedony and marcasite-arsenopyrite (ii) depth of formation (iii) absence of crustiform and colloform quartz textures and (iv) structural settings.
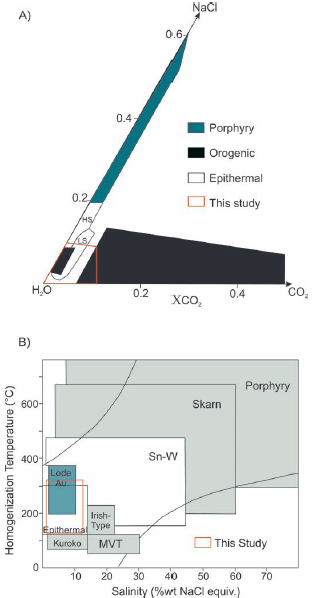
Figure 9 A). Plot showing the general compositions of orogenic gold deposits and other deposits (Ridley and Diamond, 2000) and the results of this study (red square). LS= Low Sulfidarion; HS= High Sulfldation B). Homogenization temperature-salinity diagram illustrating typical ranges for fluid inclusions from different deposits type (Wilkinson, 2001) and the result of this study (red square).
The transition from an aqueous-carbonic fluid, presumably deep-sourced (±18km), to an aqueous-saline CO2-free fluid seems to be related to the beginning of sulfide deposition (Drummond and Ohmoto, 1985; Haeberlin, 2002; Saunders et al., 2014). However, it is unclear whether the CO2 loss and later salt enrichment simply result from the progressive evolution of the early carbonic fluid or reflect the influx of a second and different fluid in the hydrothermal system. Possible explanation for the first scenario of progressive evolution include: (1) loss of volatile phases after pressure drop and (2) fluid-rock interaction with the wall-rocks. There is no evidence of phase separation (Drummond and Ohmoto, 1985; Ridley and Diamond, 2000; Haeberlin, 2002) in the fluid inclusions. This observation precludes the progressive evolution scenario. Therefore, this fluid transition seems to be the result of two different fluids incorporated into the hydrothermal system, and suggest that the conditions for gold precipitation were reached locally during the circulation of CO2-bearing fluid During this early stage (1) C02-bearing fluid bring Au to the system and during stage (2) gold concentration occurred. The aqueous saline inclusions (type 2) represent younger fluid that are synchronous with the main gold stage. The positive correlation discernible in Figure 7D between type IIA and type HB fluid inclusions can be explained by dilution trough the mineral precipitation with calcite and quartz precipitated by different fluids; with quartz derived from a more saline fluid and calcite precipitated just after from the rerriaining lower salinity fluid. The influx of this second fluid seems to coincide with late deformations stage (D3) that opened crack within coarse-grained pyrite (Pyl) and with their filling with the main sulfide-telluride-gold (stage 2).
The source whether magmatic and/or metamorphic (Leal-Mejía, 2011; Naranjo-Sierra et al., 2016; Naranjo-Sierra and Alvaran-Echeverri, 2018) provoked the release of low-salinity aqueous-carbonic fluid from presumably from lower crustal levels, and potentially gold-bearing fluids were able to begin their upward migration. These early fluids deposited significant quartz volumes, carbonates (calcite), sulfides (mainly pyrite) and low contents of gold. As upward migration continues, a second influx of aqueous-saline fluid were incorporated to the system, as a result the ore-related fluid became more dilute and cooler and the sulfur activity in the system dropped allowing gold sulfides and tellurides to precipitate in microfiactures within the massive quartz-sulfide veins.
Transport and deposition of Gold
Fluid inclusion, alteration mineralogy, ore mineral and isotope results provide direct evidence of the pH and redox conditions of ore-forming fluid (Klein et al., 2005). Dominant sericite alteration, the absence of hematite, the coexistence of pyrite and chlorite, and the <534S values (+1.0 to +5.0%o) indicate relatively reduced conditions (Naranjo et al, 2016) for the ore-related fluid at El Bagre. Moreover, the presence of calcite and sericite as the dominant alteration minerals also indicates neutral to slightly alkaline conditions (Klein et al, 2005). The majority of the fluid inclusions presented here, have low-salinity, which under the aforementioned neutral pH conditions, suggest that H2S or HS- ligand species were the predominant sulfur species in ore fluids. In consequence, Au(HS)2- was likely the gold-transporting complex; a dominant transporting mechanism in orogenic gold deposits (Moritz, 2000; Ridley and Diamond, 2000; Groves et al., 2003; Goldfarb et al, 2005; Phillips and Powell, 2010; Seward et al., 2014 and Saunders et al, 2014). At the El Bagre mining district, gold occurs as small inclusions in pyrite (Pyl), as free-milling particles associated to massive quartz (Qvl) and as sealing of fractures with tellurides and base metal sulfides. This might indicate different mechanisms of precipitation. The presence of CO2-bearing inclusions and of calcite shows that the early fluid was rich in C02. Removal CO2 from the fluid to form fluid inclusions and by dissociations to form carbonate minerals would rise the pH of the solution and the activity of the carbonate ion the solution favoring the precipitation of calcite (Rimstidt, 1997). The removal of CO2 from the fluid will cause an increase in pH and will decrease the temperature and activity of the bisulfide complex (Drummond and Ohmoto, 1985; Seward et al, 2014; Seward et al., 2014; Ridley and Diamond, 2000). At the same time, the total S decrease due to the volatilization of H2S and the precipitation of sulfides. The reducing process of the total S has an ultimate effect of approaching the Au super saturation and precipitation. This would effectively destabilize the Au bisulphide complex and lead to Au deposition (Ridley and Diamond, 2000; Phillips and Powell, 2010; Seward et al, 2014; Saunders et al, 2014).
Conclusions
From this study of fluid inclusions of shear zone hosted lode gold type deposits at the El Bagre mining district, we draw the following conclusions: 1 - There were two mineralization stages. Stage ( 1 ) mostly related to massive, low gold-grade quartz veins (Qvl) and stage (2) directly related to gold mineralization, tellurides and base metal sulfides.
2- |The fluid responsible for main gold mineralization are related to H2O-NaCl system, with low to moderate salinity (9.21 %wt NaCl), with a trapping temperature between 150.8°C and 210.6°C and a trapping pressure between 2.0Kbar and 0.5Kbar, corresponding to depths of ±7.5km to ±1.8km. Whereas those of massive low gold-grade quartz veins are characterized by the H2O-CO2-NaCl±CH4 system, with trapping temperature between 238.1°C and 297.1°C and pressure estimates <5Kbar, corresponding to crustal levels (<18km).
3- The El Bagre ore-forming fluids were neutral to slightly alkaline, as indicated by the mineral assemblages and relatively reduced according to the absence of hematite, the coexistence of pyrite and chlorite, and the δ34S values. In consequence, Au(HS)2- was likely the gold-transporting complex.
4-| The characteristics at the El Bagre district share similar characteristics with orogenic deposits type.

