


 Inglês (pdf)
 Artigo em XML
 Referências do artigo
 Enviar este artigo por email
 Citado por SciELO
  Citado por Google
  Similares em
SciELO
Similares em
SciELO  Similares em Google
 Permalink
Introduction
Land subsidence and deformation is a geological phenomenon in which the surface rock and soil subsides downward under the action of natural or man-made factors and forms a subsidence pit on the ground. According to the causes of subsidence deformation, land subsidence and deformation can be divided into natural subsidence deformation and artificial subsidence deformation. Natural subsidence and deformation occur under the influence of natural environmental factors, and the main inducements include earthquakes, rainfall, and so on. Artificial subsidence deformation refers to the surface subsidence deformation caused by overexploitation of groundwater and drainage of mine pits. With the rapid development of the city, the underground space of the city has been continuously developed. The underground of most cities is densely covered with various pipelines, tunnels, and other underground "holes" (Tan et al., 2016). These underground "voids" are prone to collapse and then cause land subsidence and deformation under the action of external factors such as ground load and disturbance of underground engineering construction.
In view of the increasingly serious development trend of land subsidence and deformation, monitoring of vertical land subsidence and deformation has become a new research hotspot, and many scholars at home and abroad have done a lot of research on it. Common monitoring technologies include InSAR, GPS, ground-penetrating radar, and transient electromagnetic methods. However, land subsidence and deformation are a geological hazard phenomenon of vertical compression and horizontal deformation after the coordinated deformation of soil structure. It is difficult for traditional point monitoring technology to fully understand the deformation characteristics of the whole and local layers of the soil-structure system, the compatibility of deformation among different layers, and the law of development. It is also difficult to predict the deformation process of the soil in the ground subsidence. Distributed Fiber Optic Sensing (DFOS), as a new monitoring technology, has the advantages of high spatial resolution, high precision, and high repeatability. It can effectively solve the problems of traditional monitoring technology (Diao et al., 2016). At present, this technology has been widely used in the monitoring of slope, embankment, ground subsidence, and ground fissures. Distributed optical fiber sensing technology can sense and measure one-dimensional deformations along the direction of optical fibers. In practical monitoring, various conversion methods or optical fiber layouts are often needed to achieve the purpose of monitoring the required deformations of the measured objects (Bornyakov et al., 2016). After more than ten years of research and accumulation, the author's research group has developed a variety of technology-based deformation monitoring methods (Sayle et al., 2016). The following mainly introduces the distributed optical fiber sensing monitoring method of soil longitudinal subsidence and deformation.
Distributed optical fiber monitoring technology is based on BOTDA (Brillouin Optical Time-Domain Analysis) monitoring technology. BOTDA is a time-domain analysis technology of Brillouin scattering light based on stimulated Brillouin scattering. Its sensing principle is that a certain frequency of pulsed light is injected into one end of the fiber, and the pulsed light interacts with the acoustic phonon in the fiber, resulting in Brillouin scattering. The light-receiving unit and signal acquisition unit of BOTDA mainly analyze and process the back Brillouin scattering light which returns to the injecting end of the pulsed light along the original optical fiber path. The optical signal is converted into an electrical signal by the photodiode, and the electrical signal is amplified by a broadband amplifier into the heterodyne receiver. The digital signal is averaged and the scattering spectrum of each sampling point along the optical fiber is obtained. Brillouin scattering light is affected by strain and temperature, that is, when the fiber is stretched (compressed) along the axis or the temperature along with the fiber changes, the corresponding changes in the stretching (compressed) or temperature range of the fiber have a good correlation with Brillouin frequency shift (Xu et al., 2018). Therefore, the Brillouin frequency drift can accurately reflect the temperature and strain changes of optical fibers.
In this paper, BOFDA technology is used to conduct a distributed monitoring model test ofvertical land subsidence and deformation in seismic and geological hazards. Using the self-made physical model of land subsidence and deformation (Tehrani et al., 2016), the longitudinal deformation of different types and thicknesses of land in the process of subsidence and deformation is monitored by distributed optical fiber. The experimental results are compared and analyzed to verify the feasibility of distributed optical fiber sensing technology in land subsidence monitoring (Kim et al., 2016). It also provides a reference for further research and application of distributed optical fiber sensing technology.
Materials and Methods
Test Material
(1) Sand
The sand used in this experiment is taken from the Jiangning area (Song et al., 2016), Nanjing. The grain size distribution curve of sand is shown in Figure 1, and its physical and mechanical parameters are shown in Table 1.
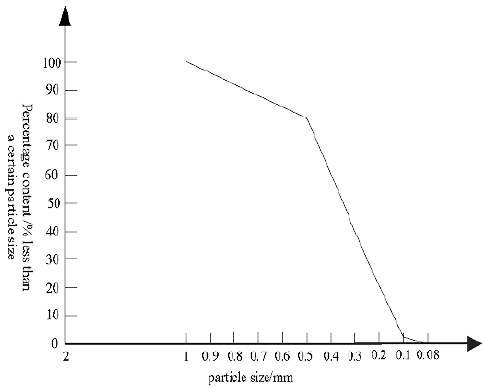
Table 1 The physical parameters of the sand
| Proportion | Maximum dry density/ (g/cm3) | Minimum dry density/ (g/cm3) | Maximum porosity | Minimum porosity | Cohesion/ KPa | internal friction angle/(°) |
|---|---|---|---|---|---|---|
| 2.64 | 1.69 | 1.35 | 0.97 | 0.14 | 0 | 30.12 |
(2) Clay
The clay used in this experiment is Xiashu soil (Li et al., 2016), which is widely distributed in the Nanjing area. The natural state is yellowish-brown, mainly plastic to rigid plastic, with compact structure (Chen et al., 2017). Its physical and mechanical parameters are shown in Table 2.
Table 2 The physical parameters of the caly
| relative density | Bulk density | liquid limit | Plastic limit | Plasticity index | Natural moisture content | Cohesion/ Kpa | internal friction angle/(°) |
|---|---|---|---|---|---|---|---|
| 2.72 | 19.8 | 30.3 | 17.5 | 12.8 | 20-28 | 15.8 | 6.3 |
(3) Gasbag
In this experiment, gasbags are used to simulate seismic and geological hazards. The gasbag is made of black rubber, ellipsoid, with a long axis of 20 cm, a short axis of 15 cm, and a height of 15 cm. It is connected with an air pump and a pressure valve. This kind of gasbag has the characteristics of good air tightness, strong elasticity, high wear resistance, high acid resistance, and aging resistance (Lu et al., 2018). It is flattened after natural ventilation, which meets the test requirements.
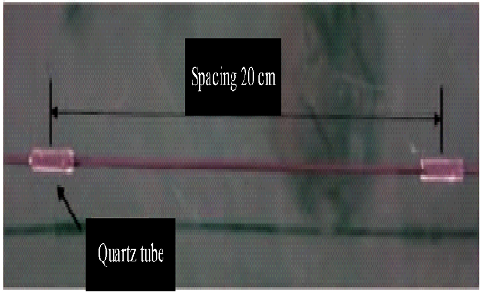
(4) In this experiment, two kinds of sensing optical cables are used: a. polyurethane strain sensing optical cable with a variable diameter (2mm CD), is a polyurethane optical cable with 2mm diameter, and 25 mm length quartz glass tube at 20 cm intervals. A concave-convex variable diameter sensing optical cable (Dyshlyuk et al., 2017) is fabricated, as shown in Figure 2; b. polyurethane strain sensing optical cable (2mm CD for short) is a conventional optical cable with a diameter of 2 mm, that is, a sensing optical cable without a quartz glass tube.
Monitoring Program
The model used in this experiment is a self-made indoor simulation box for longitudinal land subsidence and deformation (Foumelis et al., 2016), which length is 200 cm, width is 50 cm and height is 50 cm. Three air bags are buried in the set position of the box (Deverel et al., 2016), as shown in Figure 3:
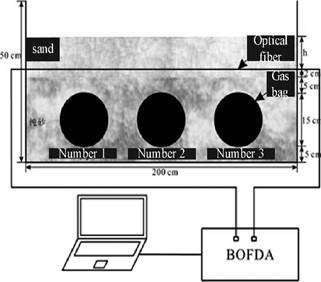
According to the test requirements, layered backfill soil samples are buried with distributed sensing optical fibers in the upper soil of the gasbag during the backfill process. After backfilling is completed, the air pressure inside the gasbag is increased at a certain speed through the external air pressure switch, so that the soil around the gasbag will be deformed due to the excessive support at the lower part, and then land subsidence will occur on the surface of the gasbag (Zhang et al., 2017). By changing different test variables, this experiment can simulate different seismic and geological engineering conditions, and then effectively and comprehensively study the mechanism and impact of ground subsidence. In the experiment, two main parameters are changed: the thickness of the upper soil layer and the content of clay. Filling thickness (h) refers to the thickness of the soil on the top of the optical fiber. The specific parameters are 5 cm and 10 cm. Clay content refers to the content of clay in the upper layer of optical fiber. The specific parameters are 0% and 5%.
The monitoring variables of land subsidence deformation are vertical deformation of soil, including longitudinal compression and rebound. By laying distributed sensing optical fibers vertically in ground subsidence monitoring, appropriate backfilling is selected according to stratum lithology. With the increase of laying depth, the lateral earth pressure will increase continuously, and the deformation coupling between distributed sensing fiber and soil will be stronger (Jiang & Zhang, 2017). Therefore, when the soil is compressed or rebounded, the distributed sensing fiber will co-occur axial compression or tension. The distributed sensing fiber data will be collected regularly to obtain the strain increment of distributed sensing fiber (Shi et al., 2017), and the product will be used. The deformations of distributed sensing optical fibers can be obtained separately, as shown in Formula 1. Longitudinal land subsidence and deformation information can be obtained according to the integral results.
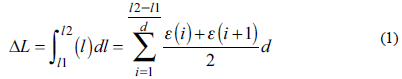
Where ∆L is the longitudinal tension or contraction /m between the sensing cable l1 and l2;ε(l) is the longitudinal strain at the sensing cable lm; and d is the step length /m of data acquisition by sensing cable.
Test steps
(1) Laying cushion: dry sand with a thickness of 5 cm is laid on the bottom of the model box with sand rain normal direction and leveling the surface (Li et al., 2018).
(2) Installation of gasbags: the three full-air gasbags in the model box are placed. From left to right, they are No. 1, No. 2 and No. 3, and the spacing of the gasbags is 40 cm. The air duct connecting the gasbag is led out of the model box to control the air pressure inside the gasbag during the test.
(3) Sand layer landfill: dry sand is laid around the gasbag by sand rain method until it stops 5 cm above the top of the gasbag and the surface is leveled.
(4) Embedding of optical fibers: the optical fibers are passed through the reserved holes and welded with jumpers. The fused optical fiber is connected with BOFDA optical fiber monitoring instrument. Two heat sources are set at both ends of the model box, and the monitoring software is run to determine the specific location of the optical fiber test section. After the fixed point is completed, the optical fibers are fixed and pre-stretched on the outside of both ends of the model box (Zhang et al., 2017).
(5) Test soil layer landfill: the upper test soil is filled into the model box. After the fill reaches the predetermined height, the soil surface is leveled and placed for 12 hours.
(6) Land subsidence simulation test: before the beginning of the test, the pre-stress applied on the optical fiber is removed, the initial data is recorded, the No. 2, No. 1, and No. 3 gasbags are filled in turn, and the filling interval is 30 minutes. The data before each filling is measured, and the last measurement is 30 minutes after the completion of the No. 3 gasbag filling. In the process of aeration and measurement, the change of soil surface is photographed, and the change of soil surface during the test is recorded accurately.
(7) Subsidence information record: after data acquisition, excavates along with the optical fiber until the bottom of the gasbag, obtain the longitudinal profile of the soil after deflation, and observe the shape of the cavern and record and describe it.
Test Conditions
Tests are carried out under the following four working conditions, and the soil conditions under different working conditions are as shown in Table 3. Condition 1: gasbag 2 deflates naturally and collects data after 30 minutes.
Table 3 Detailed contents of different working conditions
| working condition | thickness | Sand content/% | Clay content/% |
|---|---|---|---|
| 1 | 5 | 100 | 0 |
| 2 | 10 | 100 | 0 |
| 3 | 5 | 95 | 5 |
| 4 | 10 | 95 | 5 |
Condition 2: gasbag 1 deflates naturally and collects data 30 minutes later. Condition 3: gasbag 3 deflates naturally and collects data after 30 minutes. Conditions 4: gasbag 1-3 deflates naturally and collects data after 60 minutes.
Data Correction Method for Sensing Optical Fiber
According to the indoor test results, when the sensing fiber is embedded in a certain depth of soil, the confining pressure of the soil will affect the testing effect of the sensing fiber. Therefore, when analyzing the sensing optical fiber data in deep soil, it is necessary to introduce correction coefficient to modify the monitoring data of sensing optical fiber under different confining pressures (Tao et al., 2019), as shown in Formula 2 and 3:

Where, ∆L is the longitudinal tension or contraction of sensing optical fibers in soil/m, and k s is the correction factor of coupling between sensing optical fibers and soil deformation.
k i . is the drawing efficiency of sensing fiber and soil when confining pressure is iMPa.
The modified coefficient k is introduced to modify the monitoring data of sensing optical fiber, and the corrected monitoring data are accurate monitoring results of vertical land subsidence and deformation.
Results
In the course of the test, the changes in the soil surface in the model box at each stage are fully recorded. It is found that the upper soil has a great influence on the surface morphology of the ground subsidence, and different test phenomena will appear. The vertical subsidence and deformation of the soil surface under four working conditions are described by Figure 4 (a), Figure 4(b), Figure 4(c) and Figure 4(d), respectively. It can be seen that different seismic actions have different effects on the vertical subsidence and deformation of the soil surface. The longitudinal subsidence and deformation of soils under different working conditions will be monitored by the proposed method as shown in Table 4 (Yang et al., 2020).
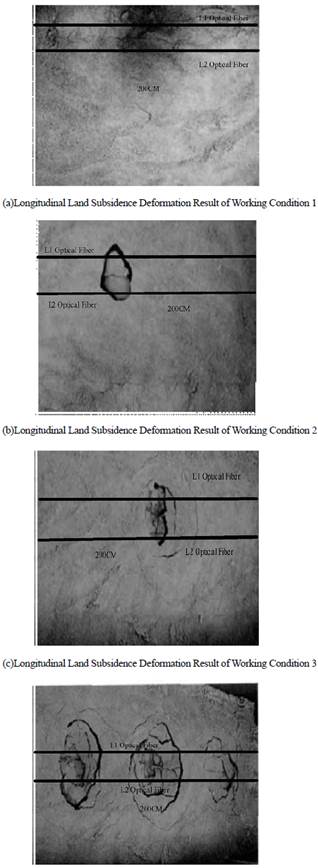
Table 4 shows the changes in soil longitudinal subsidence and deformation under different working conditions monitored by the proposed method. Among them, the results of soil subsidence and deformation measured under working conditions 2 and 3 have less valid data. In order to verify the correctness of the results of the proposed method in monitoring the vertical land subsidence and deformation in seismic and geological hazards, the results of soil subsidence and deformation monitored by the proposed method under working conditions 1 and 4 are compared with the actually measured soil subsidence. The results of deformation are compared and described in Figure 5 and Figure 6 respectively. The average vertical subsidence of soil under working conditions 1 and 2 measured by two optical fibers in this paper is described in Table 5. From the data in Table 5, it can be seen that the method can accurately monitor the vertical subsidence and deformation of soil structure at different locations under different seismic and geological hazards (Wu et al., 2020).
Table 4 Longitudinal Subsidence and Deformation of Soil under Different Conditions
| working condition | 1 | 2 | 3 | 4 | ||||
|---|---|---|---|---|---|---|---|---|
| L1 Optical Fiber Mean Subsidence Deformation/mm | L2 Optical Fiber Mean Subsidence Deformation/mm | L1 Optical FiberMean Subsidence Deformation/mm | L2 Optical FiberMean Subsidence Deformation/mm | L1 Optical FiberMean Subsidence Deformation/mm | L2 Optical FiberMean Subsidence Deformation/mm | L1 Optical FiberMean Subsidence Deformation/mm | L2 Optical FiberMean Subsidence Deformation/mm | |
| 0 cm -20cm | 5.6 | 3.4 | 0 | 0 | 0 | 0 | 4.5 | 5.6 |
| 21 cm -40 cm | 6.6 | 4.6 | 0 | 0 | 0 | 0 | 23.4 | 27.6 |
| 41 cm -60 cm | 4.8 | 3.4 | 18.8 | 6.7 | 0 | 0 | 8.9 | 7.7 |
| 61 cm -80 cm | 15.7 | 10.3 | 0 | 0 | 0 | 0 | 7.8 | 5.7 |
| 81 cm -100 cm | 20.7 | 14.7 | 0 | 0 | 8.8 | 6.5 | 32.7 | 34.7 |
| 101 cm -120 cm | 11.5 | 12.5 | 0 | 0 | 11.7 | 12.9 | 10.2 | 8.7 |
| 121 cm -140 cm | 8.7 | 4.5 | 0 | 0 | 0 | 0 | 5.8 | 6.7 |
| 141 cm -160 cm | 4.3 | 3.4 | 0 | 0 | 0 | 0 | 21.8 | 23.8 |
| 161 cm -180 cm | 0 | 0 | 0 | 0 | 0 | 0 | 11.3 | 13.8 |
| 181 cm -200 cm | 0 | 0 | 0 | 0 | 0 | 0 | 6.7 | 5.8 |
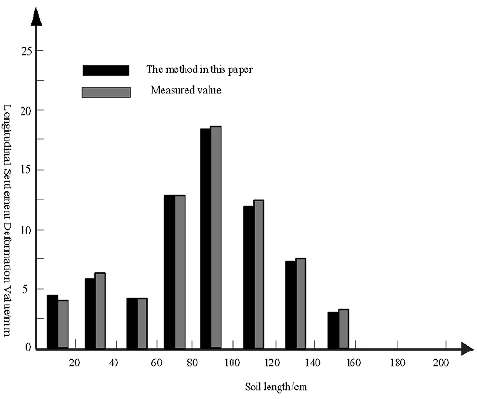
Figure 5 The method presented in this paper and the actual measured subsidence and deformation results of the soil under working condition 1
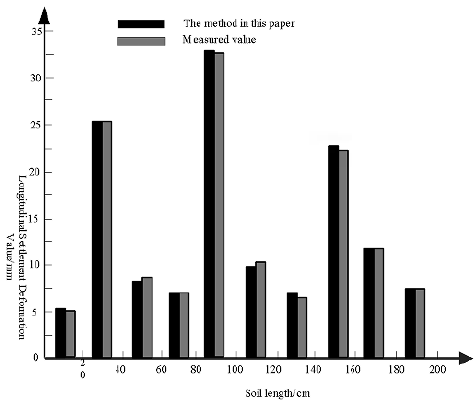
Figure 6 The method presented in this paper and the actual measured subsidence and deformation results of the soil under working condition 4
Table 5 Average Longitudinal Subsidence Deformation of Soil Layer Measured by this Method/mm
| Working condition | working condition 1 | working condition 4 |
|---|---|---|
| 0 cm -20cm | 4.5 | 5.05 |
| 21 cm -40 cm | 5.6 | 25.5 |
| 41 cm -60 cm | 4.1 | 8.3 |
| 61 cm -80 cm | 13 | 6.75 |
| 81 cm -100 cm | 17.7 | 33.7 |
| 101 cm -120 cm | 12 | 9.45 |
| 121 cm -140 cm | 6.6 | 6.25 |
| 141 cm -160 cm | 3.85 | 22.8 |
| 161 cm -180 cm | 0 | 12.55 |
| 181 cm -200 cm | 0 | 6.25 |
From the curves of Figure 5 and Figure 6, it can be seen that the results of longitudinal land subsidence and deformation monitored by the proposed method are almost identical with those measured in practice, which indicates that the method has high accuracy in actual subsidence and deformation monitoring, and can be widely used in areas with a high incidence of seismic and geological hazards, so as to warn the displacement of vertical land subsidence and to take timely measures to reduce personnel and property losses (Gao et al., 2018). Based on the accuracy of monitoring the vertical land subsidence deformation in seismic geological hazards by the proposed method, the monitoring efficiency and economy need to be verified. A qualified monitoring method for vertical land subsidence deformation in seismic geological hazards needs both high precision and high-efficiency deformation monitoring results and low monitoring cost. The experiment is based on GPS technology to monitor the vertical ground subsidence deformation in seismic geological hazards (Cheng et al., 2020). As an experimental reference, the methods of vertical land subsidence and deformation monitoring based on inertial technology for seismic and geological hazards are compared in terms of time and cost of precise vertical land subsidence and deformation monitoring for seismic and geological hazards under work conditions 1 and 4. The results are shown in Table 6.
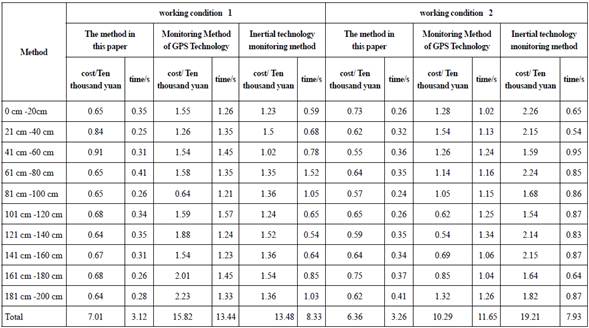
From the data in Table 6, it can be seen that the time and cost of the proposed method for monitoring vertical land subsidence and deformation of seismic and geological hazards at different distances are lower than those of the other two methods. The time and cost of the proposed method for monitoring subsidence and deformation at different distances of working conditions 1 and 4 are respectively 0.91 million yuan and 0.41 s and 0.75 million yuan and 0.41 s. The time and cost of GPS technology for monitoring subsidence and deformation at different distances of working conditions 1 and 4 are 0.91 million yuan and 0.41 s, respectively. The maximum time and cost of inertial technology monitoring for subsidence and deformation in working conditions 1 and 4 are 12.3 million yuan and 15.7 million and 15.4 million yuan and 1.34 s, respectively. The maximum time and cost of inertial technology monitoring for subsidence and deformation in working conditions 1 and 4 are 15.4 million yuan and 1.52 s and 22.4 million yuan and 0.95 s, respectively. The time and cost of three methods for monitoring subsidence and deformation in working conditions 1 and 4 are summarized as: the proposed method<inertial technology monitoring method < GPS technology monitoring method. It has strong economic benefits and monitoring speed, high practical value, and can be widely used in seismic and geological hazard monitoring, with a strong economy.
Discussion
In this paper, BOTDA is used to monitor the longitudinal ground subsidence and deformation of the simulated seismic and geological hazards. The soil model box is used to simulate the surface environment. Three air-filled gasbags are installed in the soil of the model box to simulate the seismic and geological hazards with different intensities. Distributed sensing optical fibers are installed in the soil to obtain the longitudinal ground subsidence and deformation. The results of longitudinal land subsidence and deformation under four different working conditions show that the proposed method can monitor the subsidence and deformation at different locations of monitoring objects. The results are compared with the measured values. From Figure 5 and Figure 6, it can be seen that the average longitudinal land subsidence and deformation of soil at different distances from working condition 1 and 4 are almost identical with the measured values, which shows that the proposed method can monitor the subsidence and deformation of soil at different distances from working condition 1 and 4. In addition, by comparing the proposed method with inertial technology monitoring method and GPS technology monitoring method in terms of the monitoring efficiency and cost, it can be seen that the proposed method can not only obtain high-precision subsidence deformation results but also improve monitoring efficiency, reduce the cost of the monitoring process and enhance economic benefits.
The results of subsidence and deformation monitoring of indoor model box simulation tests show that reasonable monitoring methods can accurately detect soil deformation by sensing optical cable, and the monitoring accuracy is better than the existing conventional monitoring technology. How to apply distributed optical fiber sensing technology to the monitoring of geological hazards such as land subsidence and ground fissures more reasonably and efficiently and develop it into a mature and popular monitoring method is the main content of the next research. According to the monitoring situation in this paper, the development direction of optical fiber sensing monitoring technology for vertical land subsidence and ground fissures is summarized as follows:
(1) Introducing fiber bragg grating sensing technology
Fiber Bragg Grating (FBG) sensing technology has very high accuracy, but also has the unique advantages of anti-interference and corrosion resistance.
In the monitoring of geological hazards such as land subsidence, the distributed optical fiber sensing technology, and fiber Bragg grating sensing technology are combined to achieve the complementary advantages of the two technologies and achieve the purpose of efficient monitoring.
(2) Developing vertical buried monitoring methods
The vertical buried monitoring method can realize the distributed monitoring of soil compression and deformation. How to solve the problem of shallow surface temperature compensation is the focus of the next step of the proposed method. If the target monitoring layer is deeply buried, the temperature compensation can be avoided. The construction technology of this monitoring method is basically mature. The next step is to select the location with subsidence monitoring significance for drilling construction, lay the sensing cable through the main subsidence compression layer, and realize the vertically distributed monitoring of soil compression deformation. At the same time, the monitoring data are combined with the geological environment information to carry out the research on the mechanism and development law of land subsidence based on the vertical deformation distributed measured data.
(3) Improving and optimizing the fixed-point monitoring party
The fixed-point monitoring method can realize the monitoring of soil micro-deformation in-ground fissure area. In terms of the effective monitoring length of monitoring points, the dislocation deformation of soil mass on both sides of the crack area can be accurately detected, and the monitoring accuracy can reach the fixed point distance. The monitoring effect is better than the direct buried and pipe-type monitoring methods used at the same time. Therefore, in the next step of distributed optical fiber ground fissure monitoring, we should focus on the fixed-point monitoring method, and further optimize and improve the monitoring method. The research on the proposed method can be carried out from indoor tests and field monitoring. The main work can be carried out around the following points:
The monitoring effect of this method under different modes of dislocation deformation of ground fissures is studied through laboratory tests, and the design and laying methods of anchorage components are improved to realize directional and quantitative monitoring of soil movement.
The monitoring accuracy of this method is further improved by testing various sensing optical cables and fixing modes.
Suitable monitoring sites are chosen to conduct a wide range of distributed monitoring of ground fissures with different spacing. On the basis of monitoring existing fissures, pre-warning, and monitoring of safety in fractured areas are carried out.
Conclusions
Ground, as the main transportation place, plays an important role in the development of the national economy and society. Ground safety is more directly related to people's lives and property security. The ground is usually used for a long time, often affected by various loads and external seismic and geological disasters. The structure has different degrees of deformation. The vertical land subsidence deformation in the early stage of seismic and geological disasters is very weak, and the location is relatively hidden. The traditional detection methods are difficult to achieve the task of precise monitoring of the vertical land subsidence deformation under seismic and geological disasters. Distributed optical fiber sensing technology based on Brillouin optical frequency domain analysis can make up for the shortcomings of traditional methods, and can accurately measure the average vertical subsidence deformation in different distances of the ground to be monitored. It has good application prospects in the monitoring of vertical land subsidence deformation and improves the accuracy of vertical land subsidence deformation. Compared with GPS technology and inertial technology, the proposed method is more effective in monitoring vertical land subsidence deformation. The rate is higher and the cost of monitoring is lower.

