


 Inglês (pdf)
 Artigo em XML
 Referências do artigo
 Enviar este artigo por email
 Citado por SciELO
  Citado por Google
  Similares em
SciELO
Similares em
SciELO  Similares em Google
 Permalink
Introduction
With the continuous development of human society and the economy, various environmental problems have been paid attention to all over the world. In particular, soil erosion has become one of the most serious environmental problems in the world (Cheke et al., 2016). Since the soil erosion was recognized by people, it has been widely concerned by all walks of life, and it has seriously affected the environment on which people live (Li et al., 2016). However, due to its complex formation mechanism and process, people can hardly find a single research method to reveal its process. This makes it necessary for people to seek a fast, scientific and economic investigation and research method, to dynamically reflect the current situation and development trend of soil and water loss, and to develop into a cutting-edge topic in the research of soil erosion (Archer et al., 2016). In recent years, many ecological projects have been implemented, such as natural forest protection projects, conversion of farmland to forest, conversion of farmland to grass, etc., many of which are related to soil and water conservation. The serious situation of soil and water loss in the water source area of the middle line project has begun to get better. However, due to the development of the regional economy and the development of the resettlement projects in the reservoir area, the situation of soil and water loss has gradually changed, mainly reflected in two aspects. There are two aspects: first, the area and intensity of soil and water loss have been gradually reduced since the comprehensive treatment of soil and water loss was carried out on a large scale in more than ten years, and remarkable benefits have been achieved in ecological, economic and social aspects; second, with the continuous construction of the middle route project of South-to-North Water Transfer, the land cover has been formed in the construction process of the urban and other infrastructure of the reservoir resettlement project. The structure and industrial structure have been adjusted to create man-made soil erosion (Shevchenko et al., 2018). Therefore, it is of great theoretical and practical significance to monitor the evolution of topographic and hydrological characteristics of small watersheds. At present, there are some problems in the monitoring method of the evolution of topographic and hydrological characteristics of small watersheds, such as low edge retention ability, poor denoising effect, and low monitoring accuracy. Therefore, it is necessary to study the monitoring method of the evolution of topographic and hydrological characteristics of small watersheds (Faiz et al., 2018).
Zhu et al. (2017) used the image analysis method to segment the terrain of small watersheds, taking the branch point of the valley as seed point and the curvature characteristic of the surface profile as growth criterion, and realized the automatic segmentation of the area between the ditches, the ditch slope, and the ditch bottom. On the basis of the automatic segmentation of the ditch slope terrain, the object-oriented target classification and recognition idea was used, combined with the object. In order to monitor the evolution of topographic and hydrological characteristics of small watersheds, the edge-preserving index of this method is low, and there is a problem of low image edge-preserving ability (Zhu et al., 2017). Cao et al. (2018) spliced the DEM of each sample area standard map into a data unit, and extracted the slope length with the standard map of the medium basin and buffer zone as the unit, and compared and analyzed the graph, statistical characteristics, and work efficiency of the extraction results, so as to realize the monitoring of the evolution of topographic and hydrological characteristics of the small watershed. This method cannot remove the remote sensing image, there is a problem of poor denoising effect (Cao et al., 2018). Xiao (2018) analyzed the topographic and hydrological characteristics of the small watershed based on the hydrological and sediment measurement and remote sensing image data. Different coastal sediment transport formulas were used to compare and calculate the coastal sediment transport volume of waves. The evolution law of hydrological characteristics of the small watershed was studied by using the measured topographic data for many years. The monitoring results obtained by this method were inconsistent with the actual situation, and the monitoring accuracy was low (Xiao, 2018). Zhao et al. (2016) and others summarized and classified the common simulation methods of middle-class runoff in hydrological cycle simulation according to the principle of middle-class runoff in hydrological cycle simulation. On this basis, the main methods of precipitation runoff correlation coefficient method, full storage runoff, and super permeability runoff in runoff generation simulation were analyzed. In the simulation method, the parameterization methods of topography, land use cover, and soil type are analyzed and discussed to realize the monitoring of the evolution of topographic and hydrological characteristics of small watersheds. The remote sensing image obtained by this method has a low signal-to-noise ratio and poor denoising effect (Zhao et al., 2016).
In order to solve the problems in the above-mentioned methods, a monitoring method based on remote sensing and GIS for the evolution of topographic and hydrological characteristics of small watersheds is proposed.
(1) Denoising and edge detection of remote sensing data.
(2) Based on the preprocessed remote sensing image, a binary pixel model is constructed.
(3) Vegetation index and terrain factors are extracted on the basis of pixel binary models to detect the evolution of topographic and hydrological characteristics of small watersheds.
(4) Experiments and discussions verify the overall effectiveness of the monitoring method based on remote sensing and GIS in three aspects: edge detection ability, denoising ability, and monitoring accuracy.
(5) Conclusion.
Materials and methods
Image denoising
Based on the advantages of spectral dimension transformation and dictionary learning, the evolution monitoring method of topographic and hydrological characteristics of small watersheds based on remote sensing and GIS solves the problem of remote sensing image denoising. Combined with the classic principal component analysis and the image denoising model based on the K-SVD algorithm, a new remote sensing image denoising method is proposed. The specific process is as follows:
(1) Spectral dimension PCA transformation. Assuming that the spatial dimension of the noisy remote sensing image is MXN and the number of wavebands is P, it is expressed as the matrix XX of P row MXN column, where X =[x1, x2,… xp]T ,p=1,2,…P is the column vector of MNX1 dimension that rearranges the image of the i waveband in the order of column first and row second; the transformed data Y is obtained by PCA transformation of X.
(2) Spatial dimension denoising in the PCA domain. The first k principal components are retained, and the remaining principal components are denoised as follows: the principal components are transformed into a 2D image with MX N size; the standard deviation of the noise is estimated by robust median estimation; the noise in the principal component image is removed by K-SVD denoising model (Su et al., 2016).
(3) PCA domain spectral dimension denoising. In the PCA domain, each pixel after transformation is denoised in the following way: the first k components of the transformed spectral dimension remain unchanged, and the remaining components of P-k dimensions are denoised.
(4) Data reconstruction. All the principal components processed by the above method are inverted by PCA, and the obtained data are rearranged into a matrix of mm size, i.e. the remote sensing data after denoising (Zhao et al., 2017).
The principal componentanalysis is one of the mostbasic data dimensionality reduction methods, mainly through the eigenvalue decomposition of the covariance matrix of the data. After the eigenvalue decomposition, the eigenvector corresponds to the principal component of the data, and the eigenvalue corresponds to the weight of the data on each principal component (Lv et al., 2016). On the basis of principal component analysis, the K-SVD model is used to denoise remote sensing images. The denoising principle is as follows:
Suppose f = u+v, where the size of noise component image f is M row N column, u is the image to be restored, v is the Gaussian white noise with a mean value of 0 and standard deviation of a. The corresponding energy form of image denoising model based on the K-SVD dictionary learning algorithm is as follows:
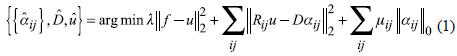
Among them, Ru is the binary operator that extracts √n x-√n size image block from the top left corner of the image u with the j,ij = 1,2,...,IJ element arranged in the order of column first and row second and converts it into nX1 size column vector, IJ = (M -
 ) (N -
) is the number of image blocks; D is the dictionary, n is the number of pixel points in the image block, K is the number of dictionary atoms, α
ij
is the sparse coefficient vector of R
ij
u on the dictionary D.{
) (N -
) is the number of image blocks; D is the dictionary, n is the number of pixel points in the image block, K is the number of dictionary atoms, α
ij
is the sparse coefficient vector of R
ij
u on the dictionary D.{
 }
}
 dand û respectively represent the sparse representation coefficient vector group, the dictionary to be learned and the denoised image corresponding to all image blocks; λ is the weight of fidelity between the estimated image and the noisy image, which is related to the noise intensity. When the noise is large, X should take a smaller value; μ
ij
, is the weight of sparse representation coefficient
dand û respectively represent the sparse representation coefficient vector group, the dictionary to be learned and the denoised image corresponding to all image blocks; λ is the weight of fidelity between the estimated image and the noisy image, which is related to the noise intensity. When the noise is large, X should take a smaller value; μ
ij
, is the weight of sparse representation coefficient
 is the number of non-zero elements in vector α.
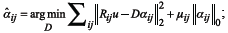
After proper initialization, the variables to be solved in the above optimization problem can be solved by the method of alternating iteration as follows:
(1) Sparse coding: fixed
 solution:
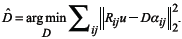
(2) Dictionary update: fixed
 solution:
After proper conversion, sparse coding can be solved by orthogonal match tracking algorithms (Naik et al., 2016).
According to the property
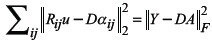 norm, where A = [α, α
2,… α
IJ]. The dictionary atoms are updated one by one. The energy functional corresponding to step (2) can be converted into:
norm, where A = [α, α
2,… α
IJ]. The dictionary atoms are updated one by one. The energy functional corresponding to step (2) can be converted into:
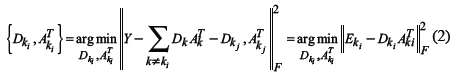
Where A T ki represents line K i . of matrix A.
In the above formula, since D ki and A T ki are column vectors and row vectors respectively, E ki . can be regarded as the product of matrix D ki and A T ki of two ranks 1. According to the singular value decomposition E ki = U∆V T of the error matrix, the new dictionary atom D ki = U and corresponding coefficient A T ki =∆ [1,1] x V 1 are obtained by rank 1 approximation of E ki .
Step 1 and step 2 iterate alternately until the stop condition is met.
After the sparse coding and dictionary are obtained according to the above steps, the terms related to u in formula (1) are taken and the derivative of u is obtained easily.
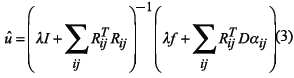
Where I is the unit matrix. The above formula actually indicates that the value at each pixel point of û is obtained by the weighted average of the pixel values of the corresponding pixel points of all image blocks including the pixel point in the noisy image and the denoised image (Cutter et al., 2016).
Edge detection
Firstly, the gradient operator is used to filter the image, extract the edge pixels, and form the edge image (Yan et al., 2016). Take the edge pixel as the candidate edge pixel point.
The length of the edge chain is obtained by linear connection of the edge points.
Using the Canny operator to detect edge points, let the neighborhood of pixel (i, j) be R, let l ij and g ij represent the edge chain length and gradient amplitude passing through (i,j) respectively, and g ij represent the maximum gradient amplitude in the neighborhood, then define a measurable parameter of an effective edge in the neighborhood as μ:
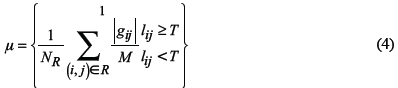
Where N R represents the number of pixels in the neighborhood and T is the threshold. It can be seen from the above formula that 0 ≤μ≤ 1. The meaning of the parameter a is: when μ = 1, because the length of the edge chain exceeds T, it indicates that (i, j) is the edge point; when (i, j) is in the smooth region, a is very small. With the increase of a value, the possibility that point (i, j) is the edge increases.
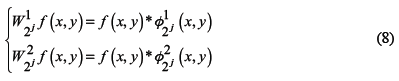
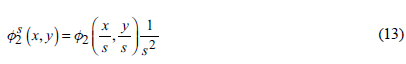
Edge detection of images is carried out by a multi-scale wavelet transform. (1) If the gray level of any point (x, y) in the image is f (x , y), its wavelet transform can be simplified as follows:

Where ф(x, y) is the wavelet generating function if ф(x, y) is the first partial derivative of the smoothing function θ (x, y).
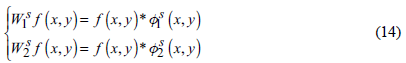
(2) Firstly, two wavelets are defined, which are the partial derivatives of two-dimensional continuous smoothing function θ (x, y) along the direction of x and y.
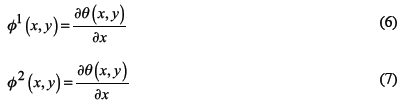
Then the binary wavelet decomposition algorithm of the two-dimensional image is used to obtain the wavelet transform in x direction and y direction.
According to the above formula:
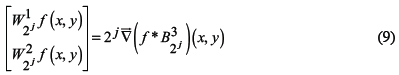
(3) Calculate the local maxima of wavelet in x and y directions. The edge pixel is defined as the local maxima in x and y directions.
According to the Canny edge detection method, if the modulus of the gradient vector at (x0, y0) point along the gradient vector directionf(x, y) is local maximum, then (x0, y0) point is called edge point (Yuan et al., 2019). Therefore, the multiscale edge of a two-dimensional image signal can be characterized by the horizontal and vertical components of the wavelet transform. If the modulus and amplitude of the two-dimensional wavelet transform are respectively:
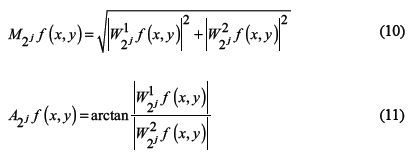
The modulus of the gradient vector
 (x, y) is proportional to the modulus M
2j
f(x, y) of the wavelet transform, and the modulus maximum of the wavelet transform corresponds to the edge point. When the image is translated, the modulus maximum of the wavelet transform also changes with the translation (Yang et al., 2020).
(x, y) is proportional to the modulus M
2j
f(x, y) of the wavelet transform, and the modulus maximum of the wavelet transform corresponds to the edge point. When the image is translated, the modulus maximum of the wavelet transform also changes with the translation (Yang et al., 2020).
(4) In order to overcome the sensitivity to noise and avoid detecting too many small edges or non-edge points, according to the multi-scale idea of wavelet and considering the singularity of edge points, the multi-scale wavelet generating function is selected.
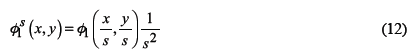
Where s is the scale coefficient, then:
If the right scale is chosen, the location of the edge can be accurately determined.
Results
(I) Binary model of pixel
It is assumed that in remote sensing images, the spectral information of each pixel is linearly combined by the spectral information of two-component factors, namely, the surface factor with vegetation coverage and the surface factor without vegetation coverage. The proportion of each component in the corresponding ground area of each pixel is the information weight of the component factor. The vegetation coverage of this pixel is the proportion of the vegetation coverage in the image (Wu et al., 2020).
From the above model, it can be concluded that the sum of the information S s contributed by the soil component and the information S v contributed by vegetation component is the information S observed by remote sensing sensor, namely:

If the vegetation coverage of a pixel is f c , the ratio of bare soil coverage is 1 - f c . When the surface is completely covered by vegetation, assuming that the remote sensing information is S veg , the product of S veg and f is the vegetation part of the mixed pixel, as shown in the following formula:

Similarly, it can be concluded that when the ground is completely composed of soil, the covered pixel is a pure pixel, and the remote sensing information obtained is S soil (Huang et al. 2017), then the information S s contributed by the soil part of the mixed pixel can be expressed as the product of S soil and 1 - f c :

Bring formula (16) and formula (17) into formula (15):

The above formula is transformed to obtain the calculation formula of vegetation coverage:
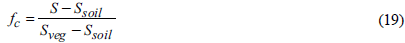
Using remote sensing information to estimate vegetation coverage only needs to know the parameters of the binary model of S soil ., and S veg , which can be obtained according to formula (19).
(II) Vegetation index
Vegetation index refers to the multispectral data obtained by remote sensing sensors, which is composed of linear and non-linear combinations and has a certain significance for vegetation. It is an indirect index that is calculated from the spectral characteristics of vegetation reflection and reflects the growth, coverage, biomass, and characteristics of vegetation on the surface. The results show that the vegetation index has a good correlation with vegetation coverage, and it is suitable to calculate vegetation coverage (Cheng et al., 2020).
In order to monitor vegetation coverage, ratio vegetation index (RVI) was first proposed. The ratio vegetation index (RVI) is very sensitive to the atmospheric conditions, and the atmospheric effect reduces its sensitivity to vegetation detection. In order to eliminate the influence of the atmosphere on the different nonlinear attenuation of the two bands, it is often calculated after the atmospheric correction data or the gray value is converted to the reflectivity. When the vegetation coverage is high, RVI is very sensitive to vegetation, when the vegetation coverage is less than 50%, this sensitivity is significantly reduced (Gao et al., 2018).
The normalized vegetation index NDVI is the result of the non-linear normalization of RVI. The calculation formula of NDVI is:
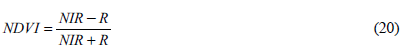
Among them, NIR is the reflectivity of the near-infrared band, R is the reflectivity of the red band. NDVI is a comprehensive reflection of vegetation information in unit pixel, and its value is determined by vegetation coverage f c and leaf area index, so it can be used to estimate both. NDVI is widely used because of its wide range of vegetation coverage detection, good temporal and spatial adaptability.
According to the binary model theory, the NDVI value of a pixel can be divided into two parts: the green vegetation part NDVI veg and the bare soil part NDVI soil . Bring NDVI into Formula (19):
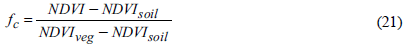
Where NDVI so¡l is the NDVI value of the area completely covered by bare soil or vegetation. NDVI veg represents the NDVI value of the pixel when it is completely covered by vegetation, that is, the NDVI value of the pure vegetation pixel. NDVI is the best indicator of vegetation growth and vegetation coverage. The ratio in the formula is used to partially eliminate the influence of changes in irradiance conditions related to satellite observation angle, topography, solar altitude angle, cloud/shadow, and atmospheric conditions. NDVI is more sensitive to the change of soil background. Because the reflection of cloud, water and snow is higher in the visible band than in the near-infrared band, its NDVI value is negative; while the reflection of rock and bare soil is close in the two bands, so its NDVI value is close to 0; while the reflection of vegetation in the near-infrared band is greater than that in the visible band, its value is positive, and it has a positive correlation with the vegetation coverage (Gao et al., 2019).
(III) Terrain factor
The topographic factors affecting soil erosion include slope, slope direction, and gully density. Topographic factors have a great influence on soil erosion, and the same cultivation conditions have great differences in soil erosion intensity due to different topography.
There are two ways to express the slope, degree, and percentage. The degree value refers to the angle between the slope and the horizontal plane, and the percentage refers to the ratio of the vertical height to the horizontal length. In ArcGIS, window differential analysis is used to calculate the slope. The slope is calculated in 3X3 DEM grid windows. The calculation equation for determining the slope value θ i of the central pixel is as follows:
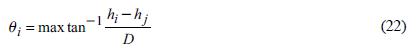
In the formula, θ i is the slope of the pixel to be calculated, expressed in degrees; h i is the elevation of the pixel; h j is the elevation value of the eight pixels (j) around it; D is the center distance of the two adjacent pixels, when j = 2,3,6,8 D is the side length of the pixel, when j = 1,3,5,7, D is the diagonal length ofthe pixel. Slope direction is defined as the angle between the projection of slope normal on the horizontal plane and the true north direction, that is, from the true north direction, clockwise rotation to the angle between the normal on the horizontal projection line.
Gully density refers to the total length of a gully in a specific area, and its mathematical expression is as follows:
Study on the Evolution Monitoring of Topographic and Hydrological Characteristics of Small Watershed Based on Remote Sensing and GIS
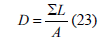
In the formula, D refers to gully density; ΣL refers to the total length of gully within a specific area of A; A refers to a specific area within the study area.
Gully density is a term used to describe the degree to which the ground is cut and broken. On the other hand, it is easy to form surface runoff. The higher the gully density, the faster the surface runoff and soil erosion. Gully density is an important characteristic value of terrain development stage, precipitation or elevation difference, soil permeability, and surface erosion resistance. Therefore, gully density is a basic index reflecting the local climate, geology, and landform, which is of great significance to the monitoring of soil and water conservation ecological construction.
(IV) Feature evolution monitoring
Because of the influence of many factors such as surface humidity, roughness, soil type, and color, the NDVI so¡l value of most bare land surfaces is kept between 0.1 and 0.2. NDVI veg represents the maximum value of vegetation coverage pixel, and its value will change with different space and time. NDVI stands for vegetation index, expressed by fraction, which can be calculated by original digital data, atmospheric reflection, radiation or surface reflection. The size of NDVI veg will be affected by the type of data used. Even for the same image, the NDVI value is not fixed when calculating vegetation coverage.
For any two pixels a 1 and a 2 in an area A, the known vegetation coverage is f c1 and f c2 , and the application of these two pixels has the following formula:
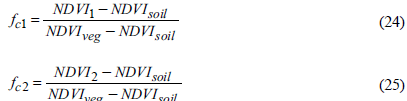
The following formula can be obtained by combining the above two formulas:
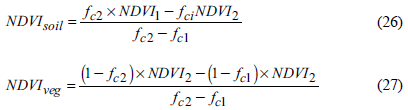
In principle, the pixels α 1 and α 2 can be any pixel, but it can be seen from formula (26) that if the value of f c2 -f c1 is larger, the error between NDVI so¡l and NDVI veg will be smaller. When fc 1 =0 and fc 2 =1, then the pixel α1 is vegetation-free and the pixel α 2 is completely vegetation covered.
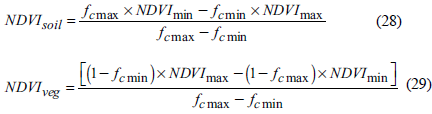
Take NDVI 1 , as NDVI min ., NDVI 2 as NDVI max ; fc 1 as f c min ., fc 2 as f , and substitute into formula (26) and formula (27) get:
Discussion
In order to verify the overall effectiveness of the monitoring method based on remote sensing and GIS, it is necessary to test the monitoring method based on remote sensing and GIS. This test is completed in the Simulink platform, and the operating system is Windows.
Let I ES represent the edge keeping index. The higher the value of edge keeping index is, the higher the image edge keeping ability is. The calculation formula is as follows:
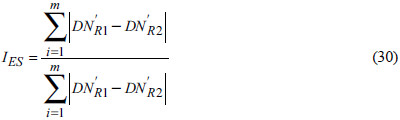
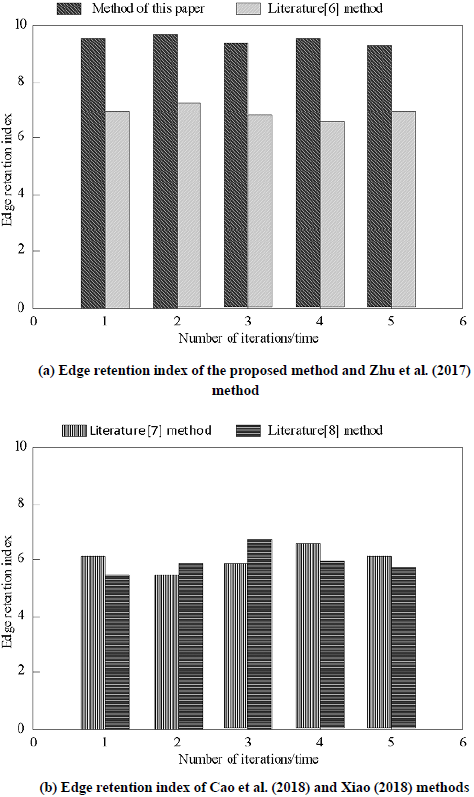
In the formula, m represents the number of image pixels; DNr 1 and DNr 2 represent the gray value of left and right or upper and lower adjacent pixels at the edge junction after filtering; DNr1 and DNr2 represent the gray value of left and right or upper and lower adjacent pixels at the edge junction of the filtering front. Based on remote sensing and GIS, the evolution monitoring method of topographic and hydrological characteristics of the small watershed, Zhu et al. (2017), Cao et al. (2018), and Xiao (2018) were used to test, and the edge retention index of four different methods were compared. The test results are as follows:
According to the analysis of Figure 1, in many iterations, the edge keeping index of the monitoring method based on remote sensing and GIS is higher than that of Zhu et al. (2017), Cao et al. (2018) and Xiao (2018), the higher the edge keeping index is, the higher the image edge keeping ability is, and the image edge of the monitoring method based on remote sensing and GIS is verified. It has a high conservation capacity, which provides a basis for monitoring the evolution of soil and water characteristics in small watersheds.
An important parameter to measure image quality is the signal-to-noise ratio (SNR), which is defined as follows:
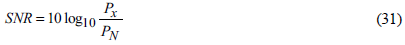
Where, P x is the energy of pure signal x ¡, k j ; P N is the energy corresponding to the noise in signal x ¡, k j containing noise.
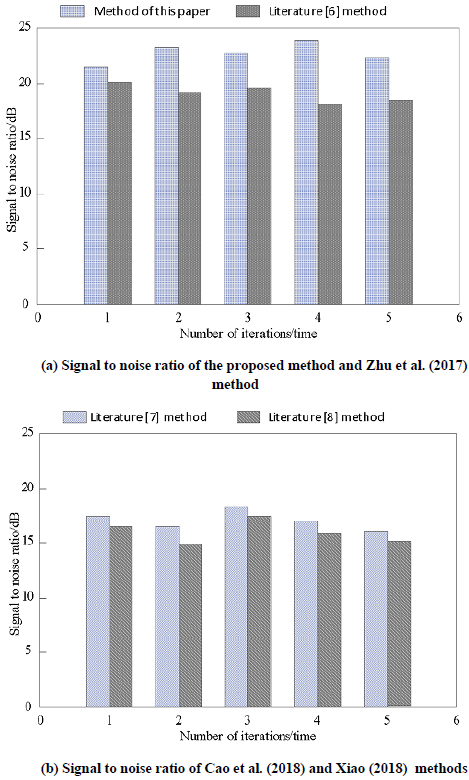
Based on remote sensing and GIS, the methods of evolution monitoring, Zhu et al. (2017), Cao et al. (2018) and Xiao (2018) are used to test the signal-to-noise ratio of four different methods. The test results are as follows:
It can be seen from the analysis of Figure 2 that the signal-to-noise ratio of the proposed method in multiple iterations is higher than that of Zhu et al. (2017), Cao et al. (2018), and Xiao (2018), and the higher the signal-to-noise ratio is, the better the denoising effect of the method is. Combining the classic principal component analysis and K-SVD algorithm to denoise the image, it improves the signal-to-noise ratio of the image and verifies the denoising effect of the method based on remote sensing and GIS.
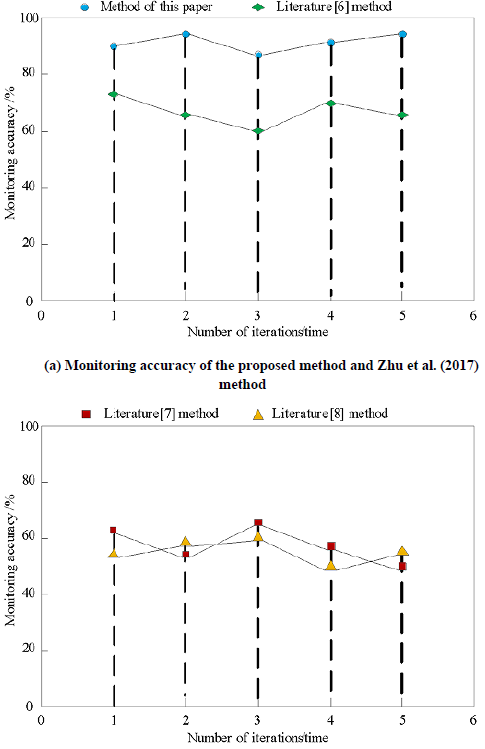
Taking the monitoring accuracy as the test index, the validity of the monitoring method, Zhu et al. (2017), Cao et al. (2018), and Xiao (2018) methods based on remote sensing and GIS is further verified. The test results are as follows:
It can be seen from Figure 3 that the monitoring accuracy of the evolution monitoring method of topographic and hydrological characteristics of small watershed based on remote sensing and GIS in multiple iterations is higher than that of Cao et al. (2018) and Xiao (2018), because the method extracts vegetation index and terrain factor based on the binary model of pixel, improves the accuracy of monitoring results, and verifies the topography of small watershed based on remote sensing and GIS. The monitoring accuracy of the hydrological characteristics evolution method is high.
Conclusions
Soil and water loss is the main ecological environment problem in China. With the development of society and economy, the regional land cover situation changes, this has an impact on the generation and development of soil and water loss. It is necessary to monitor the evolution of the topography and hydrological characteristics of small watersheds. At present, there are some problems in the monitoring method of the evolution of topographic and hydrological characteristics of the small watersheds, such as the low ability of edge keeping, the poor effect of noise removal, and the low accuracy of monitoring. Based on remote sensing and GIS, this paper puts forward a monitoring method for the evolution of topographic and hydrological characteristics of small watershed, which can accurately monitor the evolution of topographic and hydrological characteristics of the small watershed, solve the existing problems in the current method, and provide a basis for promoting the good development of ecological environment.

