


 Inglés (pdf)
 Articulo en XML
 Referencias del artículo
 Enviar articulo por email
 Citado por SciELO
  Citado por Google
  Similares en
SciELO
Similares en
SciELO  Similares en Google
 Permalink
Introduction
Efforts to understand the impacts of climate change at a regional or even local scale, in this case a river basin, has acquired greater importance during the last few decades due to its increased adverse effects on hydrological, agricultural, industrial as well as economic sectors. The effects of the Earth's changing climate are demonstrated through varying hydrometeorological characteristics at a spatial and temporal level (Frich et al., 2002). Spatial and temporal variability of the impacts of climate change are not only limited to the amount of rain falland an increase in temperature but also include increased rates of rainfall in some regions, frequent flash floods, continuous droughts (meteorological as well as agriculture), decreasing groundwater levels, cyclones, melting of glaciers and so on (Raziei et al., 2005; IPCC, 2007; Sharad & Vijay 2012; Zafor et al., 2016a). All these phenomena have been well studied during the last three decades in an effort to reduce the crumbling effects of climate change (Crisci et al., 2002; Walther et al., 2002; Benestad, 2013; Paparrizos & Matzarakis, 2017; Sobral et al., 2019; Parry et al., 2020). This data collection has been improved due to the development of sophisticated climatic parameter measuring and monitoring instruments as well as the increased availability of satellite-based observations and measurements (Schloss et al., 1996; Rodell et al., 2004; Crétauxet et al., 2011; Rhee & Im, 2017; Asfaw et al., 2018). Along with this increased availability of higher resolution gridded climate data sets increased the ease of regional scale statistical analysis of climatic parameters (Abatzoglou, 2013; Cecil et al., 2014; Dumitrescu & Birsan, 2015; Akinsanola et al., 2017; Serrano-Notivoli et al., 2018; Simpson & McCarthy, 2019; Singh & Xiaosheng, 2019; Hassan et al., 2020; Xu et al., 2020; Yao et al., 2020). Among the observations and research carried out to understand the effects of climate change, statistical analysis of rainfall trends has attained wider importance at a global as well as local scale (Yue & Wang, 2004; Shadmani et al., 2012; Ambuan et al.,2013; Nyatuame et al., 2014; Ahmad et al.,2015; Zhang et al., 2015; Teodoro et al., 2016; Gavrilov et al., 2018; Sayyad et al., 2019; Sobral et al., 2020; Wang et al., 2020). Along with rainfall trend analysis, the climatic parameters such as air temperature, evaporation and humidity have also been analyzed at various scales through statistical measurements (Santhe et al.,2012; Mikkonen, et al., 2015; Gebremicael et al., 2017; Livada et al., 2019; Behzadi et al., 2020). Global scale studies on the effect of climate change in rainfall indicate an increase of 0.5 - 1% in decadal rainfall and a 2% increase in annual average regional rainfall during the 20thcentury (Mosmann et al., 2004; Xu et al., 2003; 2005; Yu et al., 2006; IPCC, 2007).
Global-scale studies will help to improve a broader understanding of the effects of climate change for the planet in general but to better understand and develop management strategies, more detailed local as well as regional studies are necessary. In order to estimate the effects of climate change, most researchers have studied trends in monthly, seasonal and annual rainfall using historical datasets and by applying a range of scientific methods irrespective of climatic conditions (Lau & Wu, 2007; Allan et al., 2010; Uduak et al., 2012; Zafor et al., 2016b; Asfaw et al., 2018; Sa'adi et al., 2019; Wang et al., 2020). Most recent studies have revealed increasing, decreasing or no trend in rainfall amounts indicating the influence of climate change over rainfall (in the case of regions showing increasing or decreasing trends) or no influence (regions showing no trends). A few studies have also reported statistical trends in rainy days, evaporation rates, air temperature and extreme rainfall events correlated with climate change scenarios (Xu et al., 2006; Burn & Hesch, 2007; Bandyopadhya et al., 2009; Fu et al., 2009; Kumar & Jain, 2010, 2011; Abtew et al., 2011; Jhajharia et al., 2012; Soltani et al., 2012; Kumar et al., 2012; Madhu et al., 2015;Soro et al., 2016; Djaman et al., 2017; Oliveira et al., 2017; Toride et al., 2018; Yang et al., 2019; Behzadi et al., 2020). The statistical trend results provide evidence for climate change effects on parameters analyzed and its contribution to regional climatic changes.
Numerous studies have been reported from Malaysia related to determining statistical rainfall trends using Mann Kendall, Spearman's Rho, Sen's slope and linear regression techniques and have been concentrated in river basins in West Malaysia (Suhaila et al., 2008, 2010; Deni et al., 2010; Zin et al., 2010; Suhaila & Jemain, 2012; Palizdan et al., 2014, 2015, 2017; CheRos et al., 2016; Suhaila & Yusop, 2018;Yatim et al., 2019; Pour et al., 2020). When looking at the East Malaysian region, especially Sarawak, very few local or regional reports are available regarding the statistical trend determination of rainfall (Manton et al., 2001; Hua et al., 2013; Krishnan et al., 2018, 2019a,b; Sa'adi et al., 2017a, 2019). Further regional scale climatic model for the southeast Asian region (including the study area) indicates an increasing trend in rainfall along with temperature and also suggesting extreme rainfall in very localized nature and increase in dry areas in upper river basins in East Malaysia (Christensen et al., 2007; Chotamonsak et al., 2011; Sa'adi et al., 2017b; Tahir et al., 2018). Though these studies reported a significant increase in rainfall in the region, no attempts have been made to assess the characteristics of distribution and trend patterns of annual rainy or non-rainy days and evaporation from the region. Therefore, the present study has been framed with the objective of analyzing statistical trends in annual rainy days, non-rainy days and monthly evaporation rates at a pre-determined region in northern Borneo. The Limbang River Basin (LRB), which possesses the unique characteristics of an equatorial tropical river basin, was selected for a pilot study to determine trends in rainy as well as non-rainy days and evaporation by applying well-defined and widely used statistical techniques. The findings of the present study will help researchers to detect the impacts of climate change by applying various hydro-meteorological parameters, especially those from tropical regions. This is why these regions are significantly influenced by regional as well as local climate conditions and which often result in low agricultural productivity, forest deterioration and loss of biodiversity (Thomas et al., 2004; Thompson et al., 2009; Piao et al., 2010; Bálint et al., 2011). Currently, most researchers have concentrated on determining trends in rainfall and temperature (Krishnan et al., 2019a, b; Sa'adi et al., 2019). However, information related to trends in evaporation rates as well as rainy and non-rainy days is a basic pre-requisite for the planning and development of major hydroelectric projects and large-scale agricultural schemes (Jana et al., 2016; Eymen & Köylü, 2019; Liu et al., 2019; Mandale et al., 2019; Ruiz-Alvarez et al., 2019; Ghumman et al., 2020).
Study area
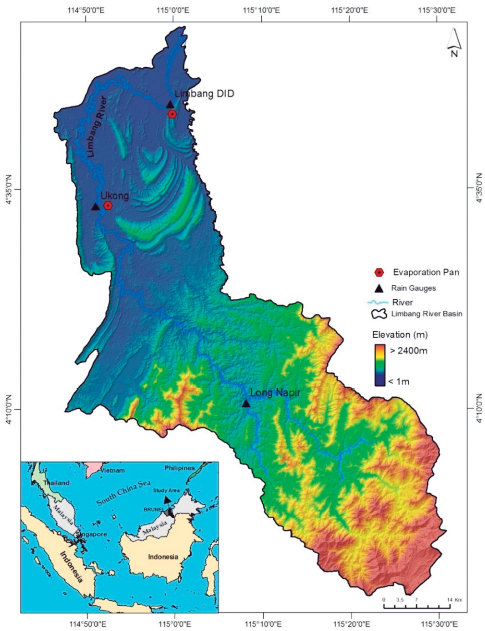
Borneo, the third largest island in the world with a tropical equatorial rainfall regime is located in South East Asia. The Limbang River Basin (LRB) is one of the largest river basins in the state of Sarawak, Malaysia and covers a total area of 3,687 km2 , located between N latitudes 030 47' 7" to 040 54' and E longitudes 1140 46' 7" to 1150 31' 30" (Figure 1). The Limbang River flows a distance of 196 km before it discharges into the South China Sea, at Brunei Bay. The LRB exhibits varied terrain characteristics and a highly undulating nature with an elevation ranging from sea level to 2,400 m above mean sea level. The majority of the LRB is covered with primary and secondary forests (more than 90%) but also includes oil palm plantations and mixed agriculture. Sarawak receives rainfall of various amounts throughout the year in two monsoon seasons, which determine the climatic conditions ofthe study area. The monsoon seasons in this region last from May to September (Southwest Monsoon) and from November to March (Northeast Monsoon) but these are separated with two short inter-monsoon months i.e. April and October. The Northeast monsoon is the wettest period and the Southwest monsoon comparatively drier (DID, 2015). The study area (LRB) receives an annual average rainfall of 3,851 mm with monthly mean rainfall exceeding 250 mm. Due to the high amount of rainfall and the peculiar relief characteristics of the research site, lower areas in the LRB experience repeated severe flash flooding during the peak monsoon seasons. The average daily temperature ranges from 25°C to 35°C during the day and 18°C to 21°C at night with the humidity varying from 70 to 90 percent (Tuh et al., 2013).The major human development activity in the study region is timber harvesting, which alters the terrain conditions and induces severe soil erosion during heavy rainfall as well as affecting the climatic conditions of this region (Vijith et al., 2018).
Materials and methods
Before collecting the necessary hydrometeorological information, the available data were obtained from the Department of Irrigation and Drainage (DID), Sarawak, Malaysia. It was noted that, though a number of rain gauging stations had been installed in the LRB, only three rain gauge stations, the Limbang DID, Ukong and Long Napir possessed long-term measurements, which is essential for statistical trend determination. The DID measured rainfall using manual as well as automated weather stations and the rate of evaporation was measured from a pan by assessing the change in the level of its free water from the evaporation pan with a height of 254 mm and a diameter of 1,206 mm (DID, 2017). These stations represent different terrain (physiographic) and conditions (coastal, midland and highland). Daily rainfall and evaporation data were collected from the DID and processed. The general characteristics of the rain gauge stations and the data sets collected are given in Table 1 and the locations of the rain gauges as well as the evaporation measuring stations are shown in Figure 1. The time span of the meteorological data collected ranged from 35 to 46 years (1970 to 2015) and the percentage of the missing data ranged from 4 to 17%. The elevation of the rain gauge stations varied from 7 m (Limbang DID), 22 m (Ukong) and 147 m (Long Napir). Among the rain gauge stations, only Limbang DID and Ukong had evaporation measurements (Figure 1 and Table 2). Before proceeding to the calculation of the missing data and the statistical trend determination, a lag-1 autocorrelation test was performed to determine the method of preprocessing and to test for homogeneity and correlation (Tabari et al., 2012; Zhaoet al., 2015). This test classified data as homogenous but non-correlated and suggests the suitability of the collected data for statistical analysis without applying any pre-whitening technique to determine the trend. Then the missing data in the daily evaporation were filled through a normal ratio method. Three different statistical methods, the linear regression model (parametric), Mann Kendall and Sen's slope (non-parametric) methods were implemented to determine the trends in rainy and non-rainy days and evaporation in the LRB. Statistical techniques used in the present study are discussed in the following sections.
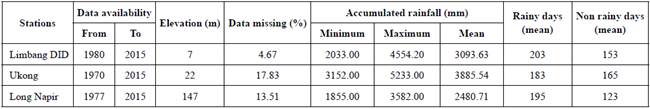
Table 1 Details of rainfall, rainy days and non-rainy days at the rain gauging stations considered in the present study.
Linear regression model
Linear regression model is one of the simplest method to calculate the trend of time series data. Linear regression model considers normally distributed data and analyzes the linear relationship between time and variables, which are temporally and spatially independent (Helsel & Hirsch, 1992; Wang & Zhou, 2005; Soro et al., 2016). The linear regression equation is:

where, Y is the dependent variable, X is the explanatory variable, b is the slope and α is the intercept. The slope of regression can describe the positive and negative nature of the time series data. An assumption of normal distribution is necessary for linear regression model. The null hypothesis is that the slope of the line is zero or no trend in the data. The probability value shows the significance of the slope. A positive value indicates an increasing linear trend and a negative value a decreasing linear trend (Brito et al., 2017).
Mann Kendall Test
The Mann Kendall test is the non-parametric test used to statistically assess the trend in a series of monotonic variables such as hydrological, climatic and environmental data which may be serially independent (Mann, 1945; Kendall, 1948). Mann Kendall test statistics are widely used to detect the trend characteristics of stream flow, rainfall and temperature in connection with the assessment for the impact of climate change on these variables (Partal & Kahya, 2006; Dindang et al., 2013; Diop et al.,2016).
Mann Kendall statistics for time series data of X1 X2 X3… Xn. can be determined as:
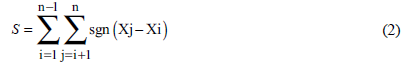
where, Xi and Xj are ith and jth value of data, n is the number of observations and sgn(Xj - Xi) is the sign function calculated as :
If the number of observation n> 10, the mean (μ(S)) and the variance (σ2 (S)) are calculated using the following equation:
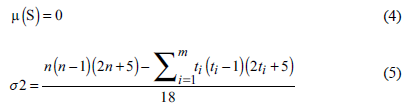
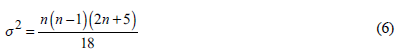
where, ti is the number of observations in the ith tied group and m is the number tied groups. If the number of ties are absent in the observation then the variance is calculated as:
The normalised standard test statistics is calculated as:
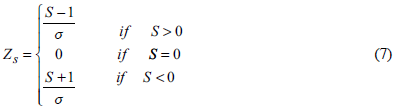
The Zs value will determine whether the observed data possess a statistically significant trend. If the Zs value is greater than zero this indicates a positive trend and a value, less than zero signifies a negative trend. To test the monotonic trend, either positive or negative, at a level of significance, the null hypothesis H0 (absence of monotonic trend/ identical distribution) is rejected if the absolute value of Zs is greater than Zs (1-α/2;), and the alternative hypothesis H1 (follows a monotonic trend) is accepted (Turgay & Ercan, 2006; Karpouzos et al., 2010; Tabari et al., 2015).
Sen's slope
The Sen's slope method helps to predict the magnitude of the trend of the variable under consideration by estimating the slope of the trend (Yue et al., 2002). The Sen's slope estimator is considered an alternative to the parametric least-squares regression line, which estimates the slope using a weighted mean, whereas the Sen's method uses median values to estimate the true slope of the existing trend (Sen, 1968; Gilbert, 1987). The slope Ti can be calculated as:
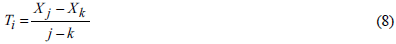
where, Xi and Xk are the data values at the time j and k (j>k) and with i varies 1, 2, 3, ...,N. The Sen's estimator of slope is the median of N values of T and can be calculated as:
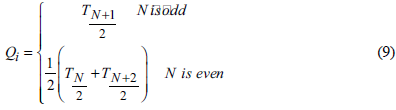
A two-sided non-parametric test at 100 (1- α) % confidence interval is used to compute the value of Qmed. A positive value if Q i . represents an upward trend, a negative value demonstrates a downward trend and no trend is represented by zero.
The annual distribution of rainy days and non-rainy days were used to identify trends in rainy and non-rainy days whereas monthly evaporation rates were used to calculate evaporation trends. Results of the trend patterns of rainy, non-rainy days and evaporation are given in Tables 3 and 4 and are discussed in detail below.
Results and Discussion
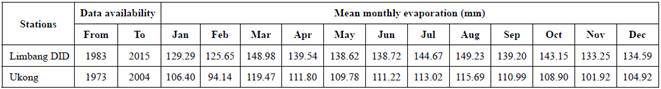
General characteristics of rain and evaporation gauging stations
The rainfall analyzed at three rain gauge stations in the LRB showed a range of characteristics (Table 1). The monthly mean evaporation rate measured by the two stations also showed fluctuation during each month and varied widely between the stations (Table 2). The rain gauge station Limbang DID, located in the lower alluvial plains and peat land of the LRB showed an annual rainfall in the range of 2,033 mm to 4,554 mm with a mean of 3,093 mm. In the case of rainy and non-rainy days, the Limbang DID station recorded a mean total of 203 and 153 rainy and non-rainy days, respectively. The mean monthly evaporation rate measured varied between 125 mm (February) to 149 mm (August). Regarding the Ukong station, which is located in the center of the LRB, the annual rainfall ranged from 3,152 mm to 5,233 mm with a mean rainfall of 3,885 mm. This station recorded 183 mean rainy days and 165 mean non-rainy days and the mean monthly evaporation varied between 94 mm (February) to 115 mm (August) during the period of analysis. At the Long Napir station, the annual rainfall amount ranged from 1,833 mm to 3,582 mm with a mean rainfall of 2,480 mm and indicated 195 mean rainy and 123 non-rainy days. Evaporation measurements were not present at this station. Comparing the three rain gauge stations, the Ukong station exhibited the longest rainfall record (45 years) and recorded the highest annual rainfall and mean rainfall of all three stations. However, when analyzing the mean rainy days, the Limbang DID station recorded the maximum rainy days followed by the Long Napir station, whereas the Ukong station logged more non-rainy days. The mean monthly evaporation rate was comparatively higher at the Limbang DID station than at the Ukong station. These results indicate the ideal location of the Ukong station (located in the central catchment region of the Limbang River Basin) which received the maximum rainfall recorded during the least number of days and where less water evaporated despite the daily temperature range being more or less similar throughout the region.
Rainy day and non-rainy day trend
Trend of rainy days and non-rainy days recorded at gauging stations in the LRB indicate an increasing trend in rainy days and decreasing trend in non-rainy days with varying statistical significance.The results of the trend analysis are given in Table 3 and the linear relationship of rainy and non-rainy days during assessed periods are shown in Figure 2. Results show an increasing trend in rainy days at 99% confidence at all three stations. The linear regression model shows an increase of 2.08 rainy days/year at the Limbang DID station (Figure 2A) whereas the Mann Kendall and the Sen's slope estimates show the increase of rainy days as 4.16 and 2.27 days/year, respectively. Regarding the rain gauge station at Ukong, the data showed the rainy days increased by 2.03 days/year using linear regression (Figure 2B), 3.53 days/year by means of Mann Kendall and 2.75 via Sen's slope methods oftrend estimation. Among the stations, Long Napir showed the maximum increase in rainy days i.e. 4.91 days /year employing the Mann Kendall test, 3.8 utilizing the Sen's slope estimation and 2.89 days/year applying linear regression (Figure 2C) methods.
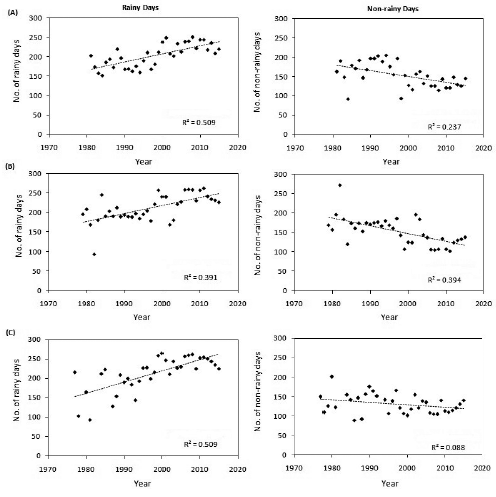
Figure 2 Linear trends in rainy days (A) Limbang DID (B) Ukong and (C) Long Napir and non-rainy days (D) Limbang DID (E) Ukong and (F) Long Napir.
The data for non-rainy days' showed a direct correlation with the rainy days data as seen in the linear trend graphs. In the present analysis, the representative rain gauge stations selected in the LRB showed significant and a non-significant decreasing trend in non-rainy days (Table 3 and Figure 2D-F). Non-rainy days recorded at the Limbang DID station showed a statistically significant (99% confidence) decreasing trend in all three methods (Figure 2D), used at -1.48 days/year in linear regression, Mann Kendall (-2.92 days/year) and Sen's slope (-1.7 days/year). The Ukong station showed the maximum decreasing trend of -3.49 days/year using the Mann Kendall followed by Sen's slope with -2.76 and -2.03 days/year in the linear regression test (Figure 2E). The Long Napir station showed a non-significant decreasing trend in non-rainy days except for the linear regression model which showed a decreasing trend with a value of -0.65 days/year (Figure 2F), whereas the Mann Kendall and Sen's slope methods showed -0.69 days/year and -0.15 days/year, respectively.
Table 3 Statistical trend characteristics of rainy days and non-rainy days in LRB.
| Variables | Analysis Methods | Rain gauging stations | ||
|---|---|---|---|---|
| Limbang DID | Ukong | Long Napir | ||
| Rainy days | Linear regression model | 208*** | 2.03*** | 2 89*** |
| MannKendall | 416*** | 3.53*** | 4 9i*** | |
| Sen's slope | 2.27 | 2.75 | 3.8 | |
| Non-rainy days | Linear regression model | 1 48*** | -2.03*** | -0.65 |
| MannKendall | - 2 92*** | 349*** | -0.69 | |
| Sen's slope | -1.7 | -2.76 | -0.15 | |
Note: bold values indicate statistically significant trends; *** 99% confidence level.
Overall, the results point towards increasing trend characteristics of rainy days. At the same time, regional spatial differences in the trend patterns were also found in the LRB. This is clearly demonstrated by the trend characteristics of the Long Napir and Ukong stations, which show a comparatively higher increasing trend in rainy days and a decreasing trend in non-rainy days compared to the Limbang DID station. These results may be influenced by the geographical location of the rain gauging stations. The Long Napir and Ukong stations are located in comparatively higher elevations and are surrounded by mountains of varying elevation, whereas the Limbang DID station is situated near the coastal area and will experience the direct influence of wind blowing from the South China Sea. The increasing trend characteristics of rainy days can be correlated with the amount of annual rainfall received in the region during the last few decades. Studies on rainfall trend characteristics carried out in Sarawak suggest an increasing trend in rainfall in the region, which supports the results of the present study (Tuh et al., 2013, Sa'adi et al.,2017a). Moreover, a recent study conducted by Krishnan et al., (2019 a,b) on the monthly and annual rainfall trend characteristics of the Limbang River Basin identified a statistically significant increase in monthly rainfall in the river basin.
Monthly evaporation trends
The results of monthly evaporation trend characteristics analyzed through linear regression, Mann Kendall and Sen's slope statistics are given in table 4 and the monthly linear trend characteristics are shown in Figures 3 and 4. During the month of January, the Limbang DID station showed a nonsignificant increasing trend in evaporation (0.55 mm/year, 1.02 mm/year and 0.75mm/year, respectively for linear regression model, Mann Kendall and Sen's slope methods). The Ukong station also showed an increasing trend in evaporation with a 95% confidence level in the Mann Kendall test (1.75 mm/year) compared to the other two methods, which showed a non-significant increase (0.53 mm/year and 1.02 mm/year, respectively for linear regression and Sen's slope methods). In the month of February the Limbang DID station showed a statistically significant increasing trend (95% confidence) in the linear regression (0.74 mm/year) Mann Kendall' (2.04 mm/year) and Sen's slope (0.98) tests. The Ukong station continued to show non-significant increasing trends in the linear regression and Sen's slope methods, whereas in the Mann Kendall test, it showed a statistically significant (90% confidence) increasing trend of 1.8mm/year. In the months of March and April, the Limbang DID and Ukong stations showed a non-significant increasing trend in evaporation.
Table 4 statistical trend characteristics of monthly evaporation in LRB.
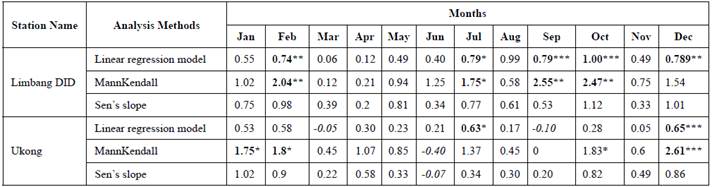
Note: bold values: statistically significant trends; italics - decreasing trends; *** Confidence level 99%; ** Confidence level 95%; * Confidence level 90%.
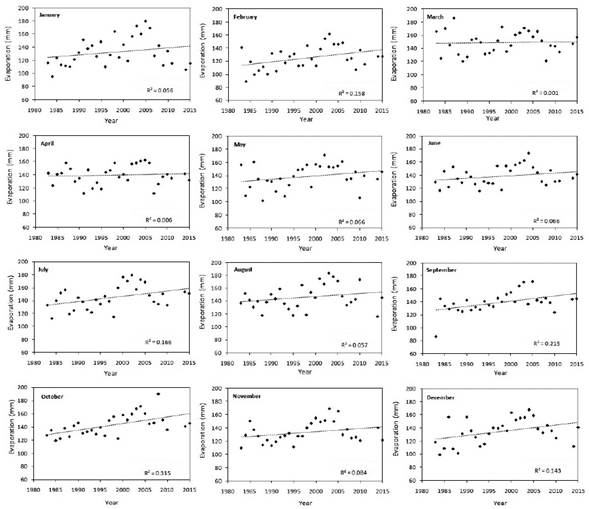
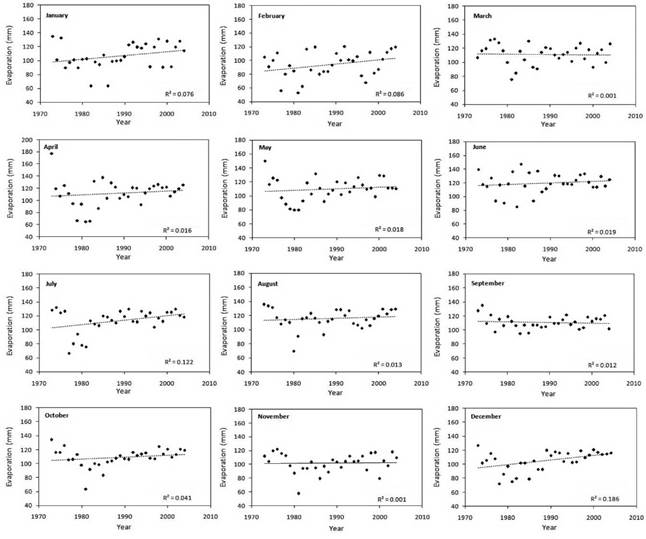
The Limbang DID and Ukong stations continued to show a nonsignificant increasing trend in evaporation during the month of May while a maximum increasing trend was shown using the Mann Kendall test at 0.94 mm/ year and 0.85 mm/year for the Limbang DID and Ukong stations, respectively. In June, the Limbang DID station continued to show a nonsignificant increasing trend in evaporation with a maximum of 1.25 mm/year. A change in trend characteristics was observed at the Ukong station, which showed a non-significant decreasing trend in the monthly evaporation rate in the Mann Kendall and Sen's slope tests (-0.40 mm/year and -0.07 mm/year, respectively) whereas in linear regression tests it showed a slight increasing trend (0.21 mm/year). In the month of July, evaporation measured at both stations showed significant as well as non-significant increasing trends. The Limbang DID station showed an increase of 1.75 mm/year in the Mann Kendall test and 0.79 mm/year in the linear regression with 90% confidence. The Sen's slope method also showed an increasing trend (0.77). During the same month, the Ukong station showed a maximum increase (non-significant) of 1.37 mm/ year by means of the Mann Kendall test, whereas the linear regression method showed a statistically significant (90% confidence) increase of 0.63 mm/year. The Sen's slope method also showed an increasing trend (0.34) during this month. In August, both stations showed a non-significant increasing trend. The Limbang DID station showed a maximum increase of 0.99 mm/year using a linear regression, whereas the Ukong station showed an increase of 0.45 mm/ year (Mann Kendall test).
During September, both stations showed distinct characteristics of a trend in evaporation rates. The Limbang DID station showed a statistically significant trend whereas, the Ukong station showed a non-significant decreasing trend as well as no trend. The Limbang DID station data using the Mann Kendall and linear regression tests, revealed an increase in evaporation rates of 2.55 mm/year (95% confidence) and 0.79 mm/year (99% confidence), respectively. The Sen's slope trend method also showed an increasing nature (0.53). While the Ukong station under the linear regression method showed a non-significant decreasing trend (-0.10 mm/year), the Mann Kendall test showed no trend (0) and the Sen's slope showed a slightly increasing trend (0.20). In the month of October, both stations showed increasing trends. The Limbang DID station showed an increasing trend in the evaporation rate by means of the linear regression (1.00 mm/year at 99% confidence), the Mann Kendall test (2.55 mm/year at 95%) and a comparatively higher increase of 1.12 for the Sen's slope test. The Ukong station showed a maximum increase of 1.83 mm/year (90% confidence) using the Mann Kendall test and a non-significant increase of 0.28 mm/year via a linear regression and 0.82 mm/year via a Sen's slope test. During the months of November and December, both stations showed an increasing trend in monthly evaporation rates, but a statistically significant increase was noted during the month of December only. During November, the Limbang DID station showed a maximum increase of 0.75 mm/year in the Mann Kendall test, whereas the Ukong station showed a maximum of 0.60 mm/year. During the month of December, the Limbang DID station showed a statistically significant (95% confidence) increasing trend in linear regression (0.78 mm/year) and a non-significant increasing trend in Mann Kendall (1.54 mm/year) test. The Ukong station showed a statistically significant (99% confidence) increasing trend in the linear regression (0.65 mm/year) and Mann Kendall (2.61 mm/year) tests. The Sen's slope method also showed increasing trends for the Limbang DID and Ukong stations (1.01 and 0.86, respectively).
Overall, the monthly evaporation rate in selected rain gauge stations in the LRB showed an increasing trend with varying statistical significance. In the Limbang DID station, statistically significant increasing trends were associated with the months of February, July, September, October and December. At the Ukong station a significant increase in the evaporation rate was observed during the months of January, February, July, October and December and a nonsignificant decreasing trend during June and September. Being located in an equatorial tropical rainforest region with very dynamic climatic characteristics and varying terrain characteristics likely contributed to comparatively higher evaporation rates. Daily variation in temperature, wind speed, relative humidity and rainfall is the major factors controlling the rate of evaporation for this region. Further, it was also noted that all the regional scale climate models suggest the presence of extreme rainfall with increasing trend in temperature in these regions (Christensen et al., 2007; Chotamonsak et al., 2011). Comparing the results of evaporation trends (present research) with monthly rainfall trend pattern in the region carried out by Krishnan et al., (2019a), both shows very correlating characteristics. It was noted that monthly rainfall shows increasing trend characteristics in most months similar to the evaporation trends particularly for Limbang DID and Ukong station. Both the stations record maximum monthly rainfall higher than 750mm and average annual rainfall > 3000mm. This suggests the increased rate of evaporation associated with heavy rainfall in the region. If the rate of rainfall is lower, then the evaporation rate less and vice versa and also indicate the close relationship between local rainfall and evaporation rate (Yang et al., 2016).This might be due to the increase in difference of maximum and minimum temperatures over these regions and also due to sunshine duration, wind speed and saturation demand of the atmosphere (Mondal et al., 2013; Madhu et al., 2015; Hounguè et al., 2019).
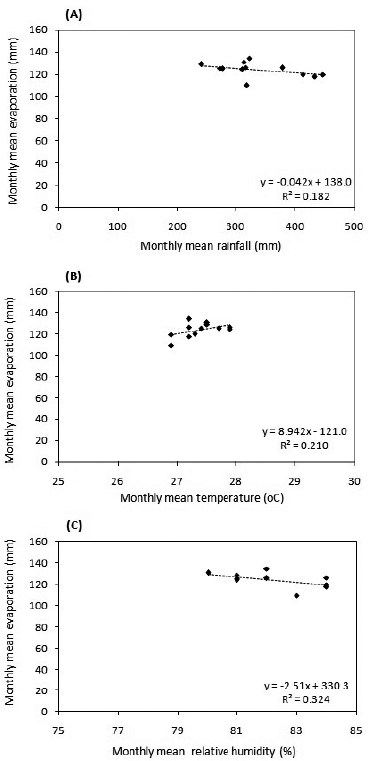
In order to make a comprehensive analysis of the relationship between mean evaporation rates with rainfall, temperature and relative humidity, linear regression and correlation analyses were performed (Figure 5). It was noted that, there was a negative correlation between the monthly mean rainfall and the monthly mean evaporation (r = -0.43 and R2 = 0.18), whereas a positive correlation was observed between the monthly mean temperature and the mean evaporation (r = 0.46 and R2 = 0.21). Though the monthly mean rainfall and evaporation shown a negative correlation, as mentioned earlier, the evaporation rate is highly depends on the local rainfall characteristics. However, relative humidity and evaporation showed a comparatively higher negative correlation (r = -0.57 and R2 = 0.32). Though the correlation and linear regression was moderate, the combined effects of these parameters likely influenced the higher rate of evaporation in the LRB. In order to establish and understand the exact co-existence of hydro-meteorological variables more detailed measurements of rainfall, daily temperature, humidity and wind speed along with evaporation is necessary.
Conclusion
Statistical trend analysis for annual rainy days, non-rainy days and evaporation data from the Limbang River Basin analyzed through linear regression model, Mann Kendall and Sen's slope methods indicates significant increasing trends in annual rainy days and evaporation rates and a decreasing trend in non-rainy days. All the three stations showed an increasing trend in annual rainy days with highest increase in Long Napir (4.91 days/year). Similarly in the case of non-rainy days trend, the Ukong station showed the maximum decrease (-3.49 days/year). Increase in the number of rainy days in the study area suggests a positive impact on the rainfall amount in the region. Monthly evaporation trends showed an increasing trend throughout the year at the Limbang DID station whereas Ukong station showed varying trend characteristics with a maximum increase in December and a decreasing trend in June and September. Correlation analysis between the mean evaporation rate with the monthly mean rainfall, monthly mean temperature and relative humidity suggests a combined influence on increased evaporation rates. Further, the increased evaporation rate in the region is linked to the local precipitation characteristics, diurnal variation in temperature, wind characteristics and humidity. Moreover, the LRB suffers from a lack of detailed observation records of evaporation from different locations, which are critical for deriving more comprehensive evaporation characteristics of the region. Overall, the Limbang River Basin is now experiencing a greater number of rainy days with an increasing evaporation rate. The present research provided a new applied theory in the field of statistical trend determination of hydro-meteorological parameters, especially for those who are working on hydroelectric projects and the impacts of climate change at a local/regional level.

