


 Inglés (pdf)
 Articulo en XML
 Referencias del artículo
 Enviar articulo por email
 Citado por SciELO
  Citado por Google
  Similares en
SciELO
Similares en
SciELO  Similares en Google
 Permalink
Introduction
In recent decades, the simulation of the seismic behavior of saturated sand layers has been vastly extended through different methodologies based on analytical, empirical, experimental, and numerical studies. Among the different approaches, numerical simulation has the advantages of investigating the influence of individual parameters independently. Following the pioneering numerical study of liquefaction by Zienkiewicz et al. (1978), the behavior of saturated sand layer under seismic loading has been investigated in a number of studies using numerical models (Prevost (1981), Finn et al. (1986, Hamada (1999), Byrne et al. (2004), Taiebat et al. (2007), Valsamis et al. (2010), Shahir et al. (2012), Pak et al. (2013), Karimi and Dashti (2015), Dobry et al. (2018, and Yang et al. (2020))). The majority of the previous studies have focused on a specific geometrical condition. Only in a small number of numerical studies have both level and gently sloping ground been considered (Elgamal et al. (2002)) and Andrianopoulos et al. (2007))). Elgamal et al. (2002) used an elastic-plastic model for simulating the essential response characteristics of pressure-sensitive geo-materials under general loading conditions. They applied this elastoplastic model to simulate Experiments No. 1 and No. 2 from the Verification of Liquefaction Analysis by Centrifuge Studies (VELACS) project. The VELACS project is a well-known dynamic centrifuge testing program consisting of nine geotechnical models constructed from or founded on liquefiable soil deposits. This project offers an effective opportunity to verify the accuracy of the different analytical procedures for the simulation of saturated sand response to cyclic loading. Andrianopoulos et al. (2007) presented a numerical methodology for the simulation of non-cohesive soil response under small, medium, and large cyclic shear strains using an elastoplastic bounding surface model implemented in a finite difference code. Their model was validated by simulating centrifuge model tests from the VELACS project. Although the results of such studies demonstrate the capacity of numerical modeling in the simulation of the seismic response of saturated sand layers, the accurate estimation of the liquefaction-induced settlement remains a challenge. This can be attributed to the unrealistic modeling of the water discharge from the soil mass as a consequence of not considering the variation of the soil permeability during the seismic loading in the numerical modeling (Shahir et al. (2012) and, to a large extent, Shahir et al. (2014)). The variation of saturated soil permeability during cyclic loading has been observed in several experimental studies (Arulanandan and Sybico (1992), Jafarzadeh and Yanagisawa (1996), Su et al. (2009), and Ueng et al. (2015)). Shahir et al. (2012) proposed a general function relating the soil permeability to the excess pore pressure ratio (which is defined as the ratio of excess pore pressure to initial vertical effective stress of the soil). Shahir et al. (2014) used the variable permeability model to simulate several centrifuge tests conducted on a level-ground sand layer. They compared the settlement and excess pore pressure obtained from the numerical model with the results of the centrifuge tests to suggest proper values for the constants of the variable permeability function.
In this study, a fully coupled dynamic finite element model adopting a two-surface plasticity constitutive law was employed to investigate the response of level and gently sloping saturated sand layers to cyclic loading. The variable permeability function first proposed by Shahir et al. (2012) and later modified by Shahir et al. (2014) was implemented in this model to incorporate the variation of the soil permeability during liquefaction. The numerical model equipped with the proposed variable permeability function was validated by the numerical simulation of a number of well-documented geotechnical centrifuge tests to investigate the capability of the model for simulation of saturated soil response to cycling loading under different ground surface conditions.
Modeling framework
In this study, a fully coupled u - p formulation was applied for modeling the two-phase porous medium of saturated sand. The primary unknowns in this formulation were the displacement of the solid phase (u) and pore fluid pressure (p). The fully coupled effective stress u - p formulation is a simplified case of the general set of equations governing the behavior of saturated porous media. This formulation is applicable for dynamic problems where high-frequency oscillations are not important, such as a soil deposit under earthquake loading. Using the finite element method for spatial discretization, the u - p formulation is as follows (Zienkiewicz and Shiomi (1984):
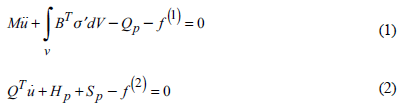
where M is the mass matrix, u is the solid displacement vector, B is the strain-displacement matrix, σ' is the effective stress tensor, Q indicates the discrete gradient operator coupling the motion and flow equations, p is the pore pressure vector, S is the compressibility matrix, and H is the permeability matrix. The vectors f (1) and f (2) include the effects of body forces and external loads, and fluid flux, respectively.
In Equation (1), which is the equation of continuity of motion, the first term represents the inertia force of the mixture, followed by the internal force due to soil skeleton deformation, and then by the internal force due to pore-fluid pressure. In Equation (2), which is the equation for continuity of fluid flow, the first and third terms represent the rate of volume change for the soil skeleton and fluid phase, respectively; the second term is the rate of pore fluid seepage.
Constitutive law
A critical state two-surface plasticity model was employed for modeling of the sand behavior. This model was originally developed by Manzari and Dafalias (1997) and refined later by Dafalias and Manzari (2004). The formulation of the model is based on the bounding surface plasticity theory (Dafalias (1986)) within the critical state soil mechanics framework to yield a comprehensive multi-axial constitutive model for simulating the monotonic and cyclic behavior of sand. The Dafalias and Manzari constitutive model is well-known and adequately verified in simulating the monotonic and cyclic behavior of sands (Taiebat et al. (2007), Jeremic et al. (2008), Shahir et al. (2012), and Rahmani et al. (2012)).
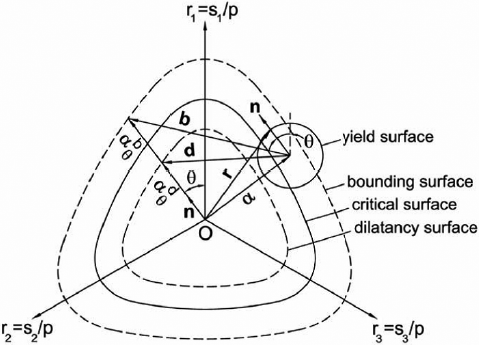
The formulation of the model is defined by introducing bounding, dilatancy, and critical surfaces in stress space. A schematic representation of these surfaces in the stress ratio n-plane is illustrated in Fig. 1. In this model, the isotropic hypoelasticity assumption is adopted with the elastic moduli as functions of the current pressure and void ratio. The yield surface is a circular cone with its apex at the origin. The size of yield surface is normally considered a constant (no isotropic hardening) and is rather small value in majority of the applications. The critical surface is in direct correspondence to the critical stress ratio in the triaxial space. The critical state of a soil is attained when the stress ratio η = q/p equals the critical stress ratio (M), which is a material constant. In a similar manner, the bounding and dilatancy surfaces are introduced by defining the peak (bounding) and dilatancy stress ratios, M b and M d . In the current model, the bounding and dilatancy stress ratios are related to the critical stress ratio via the "state parameter" as follows:

where n b and n d are positive material constants. ψ = e-e is the "state parameter" proposed by Been and Jefferies (1985), where e is the current void ratio of the soil element and e c is the critical void ratio corresponding to the existing confining stress. In the current model, the power relation was used for defining the critical void ratio as follows:
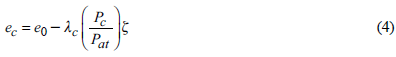
where e 0 λc , and ζ are the critical state constants.
In Fig. 1, the bounding and dilatancy surfaces are specified by dashed lines indicating their change with ψ, and the critical surface by a solid line. All surfaces are fully determined by the value of the state parameter ψ, increasing the numerical efficiency of the model. Moreover, the state parameter includes the combined effect of the density (void ratio) and confining stress. Thus, the current constitutive model can be employed to simulate the cyclic behavior of sand with different densities and confining pressures using a single (sand-specific) set of material constants.
The plastic modulus (K p ) and dilatancy coefficient (D) are related to the distance from the bounding and dilatancy surfaces as follows:
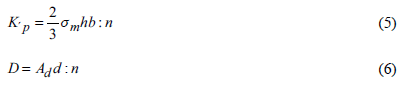
The vectors b and d displayed in Fig. 1 are defined as the vectors connecting the current stress state to its image on the bounding and dilatancy surfaces, respectively. a is the mean effective stress and h is a positive scalar-valued function. A d is a function including the effects of the "fabric change phenomenon" arising during stress increment reversal after a dilative plastic volumetric strain occurrence.
The "distance dependent plastic modulus" is the main feature of the classical bounding surface model (Dafalias (1986)). In the current model, the dilatancy coefficient is also defined based on the basic idea of "distance dependency" in the bounding surface model.
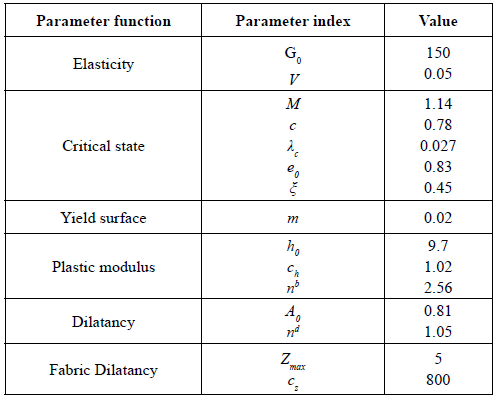
In this constitutive model, 17 model parameters were divided into 6 categories based on their functions (elasticity, critical state, yield surface, plastic modulus, dilatancy, and fabric-dilatancy tensor parameters). Dafalias and Manzari (2004) presented the proper values of these constants for Toyoura sand by comparison with laboratory data over an extremely wide range of pressures and densities. Shahir and Pak (2010) calibrated the model constants for Nevada sand using the monotonic and cyclic triaxial test data performed by Arulmoli et al. (1992). The parameter values of the model for Nevada sand are shown in Table 1.
Variable permeability model
Changes in the effective (interconnected) porosity of the soil mass and tortuosity of the flow paths through the porous medium have the main roles in altering the permeability of the saturated sand during earthquake loading. As the rate of these changes directly depends on the contact between the soil particles (macroscopically, on the effective stress state), relating the permeability coefficient to the excess pore pressure ratio can represent the realities of microscopic events in macroscopic analyses.
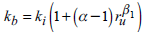
Shahir et al. (2012) suggested a general variable permeability function with respect to excess pore pressure ratio (r u ). Their equation shows a gradual increase in permeability up to the onset of liquefaction when the permeability coefficient becomes equal to "a" times the initial permeability (ki):
 during pore water pressure build up phase (r
u
< 1), k1 = σk
i
during liquefaction state (r
u
= 1), (7)
during pore water pressure build up phase (r
u
< 1), k1 = σk
i
during liquefaction state (r
u
= 1), (7)
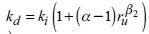 during pore water pressure dissipation phase (r
u
< 1), where ki is the initial (static) coefficient of permeability and α, β
1 and β
2 are constants.
during pore water pressure dissipation phase (r
u
< 1), where ki is the initial (static) coefficient of permeability and α, β
1 and β
2 are constants.
Several experimental studies can be found in the literature where the increase of saturated soil permeability during cyclic loading has been evaluated quantitatively. For example, Arulanandan and Sybico (1992) studied the variation of the permeability coefficient by measuring the changes in the electrical resistance of the saturated sand deposit during centrifuge tests. They attempted to introduce pore shape factor and tortuosity as the mainspring causes of the growth in the permeability coefficient during liquefaction regarding the Kozeny-Carman equation. According to their study, the average value of the increased permeability coefficient of the sand was approximately 6-7 times its initial value. Jafarzadeh and Yanagisawa (1996) conducted a number of shaking table tests to examine the settlement of saturated sand columns under cyclic loading. Assuming a laminar flow through the soil mass during the application of the input motion, they employed Darcy's law to calculate the increased permeability coefficient by measuring the cumulative water flowing upward through the sand column. They determined that the average increased permeability coefficient was 5-6 times greater than what had been measured in the static condition. Su et al. (2009) attempted to estimate the increase of the permeability coefficient of saturated sand subjected to earthquake loading using the results of a centrifuge test. Based on the law of conservation of mass, they obtained the average discharge velocity from the rate of the surface settlement. By introducing the obtained discharge velocity and hydraulic gradient of the flow calculated from the recorded excess pore pressures into Darcy's law, the increased permeability coefficient was back-calculated; it was found that its value could be as large as six times its static value. Recently, a laboratory experiment system was developed by Ueng et al. (2015) to conduct tests for evaluating the water movements and permeability in a sand column before, during, and after liquefaction. Their results indicated that the permeability of fine Vietnam sand during liquefaction was approximately four times the initial value before liquefaction, and reduced to 0.9 times the initial value after full dissipation of the excess pore pressures.
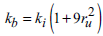
The abovementioned experimental studies indicate that the "average" increase of the permeability coefficient during the experiments was in the range of 4-7 times of its initial value. During each experiment, the permeability coefficient gradually increased from its initial (static) value to a maximum value (in-flight permeability), which corresponded to the liquefaction condition. At the end of the shaking, the dissipation of the excess pore pressure commenced and simultaneously, the decrease of the permeability coefficient continued until it returned to its initial value. Therefore, it is clear that the value of "in-flight" permeability is significantly greater than the value of "average" permeability. Based on selected ideal assumptions (e.g., triangular variation of permeability coefficient against time), Shahir et al. (2014) proposed the value of the permeability coefficient during a complete liquefaction state (r u = 1) to be ten times the initial (static) permeability coefficient (i.e., a = 10). An appropriate value of constant J is critical for the accurate simulation of the settlement and rate of excess pore pressure buildup; /32 is a key parameter for the accurate simulation of excess pore pressure variation during the dissipation period. In their study, parameters J and /32 were calibrated such that the results of the numerical simulations provided an acceptable match to the experimental records of the centrifuge tests including a leveled saturated sand layer subjected to seismic loading. Using the obtained values in the general variable permeability function, Shahir et al. (2014) proposed the following form of equation to be applied for numerical simulations:
 during pore water pressure build up phase (r
u
< 1),
during pore water pressure build up phase (r
u
< 1),
k l = 10k; during liquefaction state (r u = 1), (8)
kd = ki (1 + 9ru 10) during pore water pressure dissipation phase (r u <1).
Herein, the above variable permeability function is applied in the numerical model to simulate the behavior of a saturated sand layer with either level ground or gently sloping surface conditions.
Numerical Simulation of Centrifuge tests
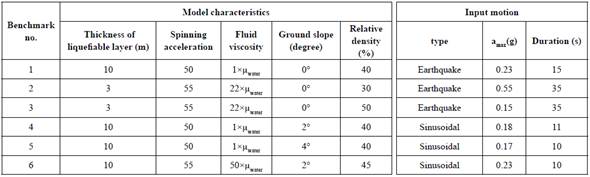
In this study, six well-documented centrifuge experiments (Experiments No. 1 to No. 6) were considered for simulation using the previously described numerical model. The selected benchmark tests addressed different settings of the important influencing factors such as relative density (30-55%), maximum base acceleration (0.15-0.55 g), slope angle (0-4°), height of sand layer (3-24 m), and duration of cyclic loading (11-35 s).
Centrifuge Experiments
Benchmark Experiment No. 1: The centrifuge model test No. 1 from the VELACS project was conducted by Taboada and Dobry (1993) at Rensselaer Polytechnic Institute (RPI). In this test, a laminar box containing a uniform leveled layer of Nevada sand with a relative density of approximately 40%, which had been fully saturated with water, was subjected to a centrifugal acceleration of 50 g. This centrifugal acceleration led to a prototype soil permeability 50 times greater than the permeability of the soil. The height of the sand layer was 10 m in the prototype scale. The laminar box was excited horizontally at the base using the target prototype accelerogram with a peak acceleration of 0.2 g.
Benchmark Experiments No. 2 and No. 3: A series of four centrifuge experiments involving buildings situated atop a liquefiable layer were performed using the large centrifuge facility at the Center for Geotechnical Modeling (CGM) at the University of California at Davis by Dashti et al. (2010). Free field results related to two of these four models were used in this study to validate the numerical model (herein called Experiments No. 2 and No. 3). Experiment No. 2 included a liquefiable soil layer (Nevada sand with relative density of 30%) with a prototype thickness of 3 m located beneath a 2 m thick Monterey sand layer that was located there to minimize capillary rise during liquefaction. The models were saturated with a fluid having a viscosity 22 times greater than the viscosity of water. The actual earthquake ground motion, recorded at the Kobe port island station during the 1995 Kobe earthquake with peak base accelerations of approximately 0.55 g (large Kobe) was applied to the base of the model. The water level was 1.1 m below the surface. In Experiment No. 3, the thickness of liquefiable layer was the same as the previous model; however, the relative density of the sand was 50% and the specimen was subjected to a moderate Port Island event with a peak acceleration 0.15 g.
Benchmark Experiments No. 4 and No. 5:Taboada and Dobry (1998) reported a series of centrifuge tests including two categories corresponding to horizontal and sloping ground. In all tests, a 10 m prototype Nevada sand deposit submerged in water was simulated (D10 = 0.08, em¡n = 0.887, G s = 2.67).Twoof these tests were used in this study to validate the numerical model (Experiments No. 4 and No. 5). Both experiments were conducted on a sloping sand layer with relative density of approximately 40% subjected to 50 g centrifugal acceleration. The slope of the ground surface was 2° and 4° in Experiments No. 4 and No. 5, respectively. The consequence of using water as the pore fluid was that the actual prototype permeability was 50 times greater, corresponding to coarser sand. The base of the laminar box was excited horizontally by a sinusoidal acceleration with prototype frequency of 2 Hz and peak acceleration of 0.18 g and 0.17 g for Experiments No. 4 and No. 5, respectively.
Benchmark Experiment No. 6:Sharp et al. (2003) presented a series of conducted centrifuge tests at RPI utilizing the same sand, laminar box, shaker, and centrifuge as used by Taboada and Dobry. However, they used a viscous pore fluid instead of water, and different relative densities and seismic loading characteristics. All tests were conducted at 50 g centrifugal acceleration. In this study, one of these centrifuge tests considered a laminar box containing a soil thickness of 20 cm (simulating a 10 m thick prototype soil deposit) tilted at an angle of 2°. During this test, the base of the box was excited by 22 cycles of a sinusoidal acceleration with prototype frequency of 2 Hz and horizontal peak acceleration of 0.23 g.
A brief description of these experiments is presented in Table 2.
Model description
In all benchmark experiments considered in this study, a uniform sand column placed in a laminar box either with a level or gently sloped surface was subjected to a one-directional earthquake excitation. In the numerical model, a column of 8-noded cubic elements with u - p formulation was applied. Each node had three displacement and one pore-water pressure degree of freedom. The mesh base nodes were fixed in all directions. Nodes at equal depths were tied together in the direction of the excitation, and were fixed perpendicular to the direction of the excitation. All features of the numerical analyses were the same for level ground and gently sloping ground models, excluding the inclination of the soil layer. The water level was located at the ground surface for Experiments No. 1, No. 4, No. 5, and No. 6, and 1.1 m below the ground surface for Experiments No. 2 and No. 3. In the finite element model, pore water pressure was maintained at zero for nodes located on the water level. For nodes under water level, the pore water pressures were free to change.
Because Nevada sand was used in all the considered benchmark tests, the constants of the employed constitutive model were selected as proposed in Table 1.
Results and Discussion
Level-ground sand layer
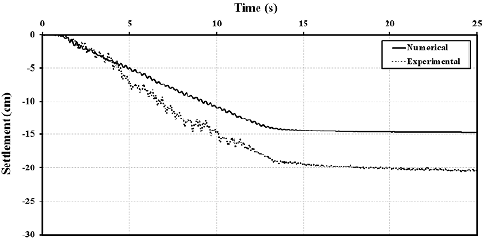
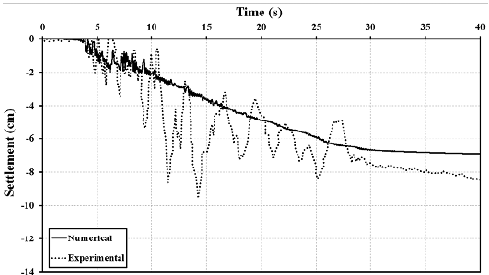
The results of the numerical analysis conducted to simulate Experiment No. 1 are displayed in Figures 2 and 3. Figure 2 indicates the variation of generated excess pore pressure with time at two different depths. For both considered depths, the maximum excess pore pressure was marginally under-predicted by the numerical model. In Fig. 3, the time history of the surface settlement obtained from the numerical simulation is compared with the experimental time history. The results indicate that the predicted settlement was approximately 15 cm, which was less than the recorded value (approximately 20 cm). Although the results indicated that the numerical ultimate settlement was less than the recorded value, the numerical model significantly improved the results of the conventional numerical modeling using the constant permeability coefficient (Shahir et al. (2014)). Furthermore, the obtained settlement was noticeably superior to the small number of available studies involving numerical simulation of both VELACS Experiments No. 1 and No. 2 with the same set of modeling constants. For example, the reported settlement by Elgamal et al. (2002) was approximately 5 cm, and the numerical estimate of the settlement reported by Pak et al. (2013) was approximately 12.5 cm. An unrealistic modeling of the water discharge from the soil mass during earthquake loading, which is responsible for the reduction in saturated mass volume, is one of the main reasons for the under-prediction of the settlement by the mentioned numerical models (Shahir et al. (2012)).
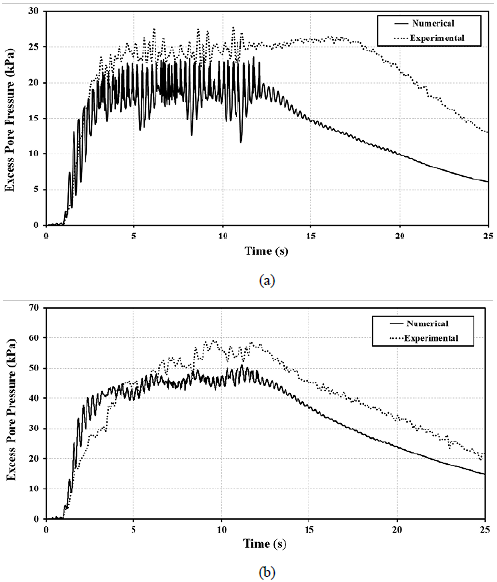
Figure 2 Evolution of excess pore pressure with time at depths: (a) 2.5 m, (b) 7.5 m (benchmark Experiment No. 1)
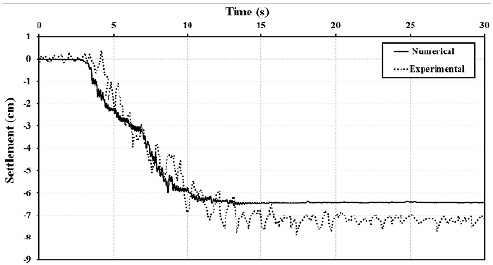
The results of the numerical simulation of benchmark Experiment No. 2 are depicted in Figs. 4 and 5 in terms of variation of excess pore pressure and settlement with time, respectively. Although the numerical simulation did not represent the abnormal fluctuations of the settlement measured in the centrifuge test, the surface settlement at the end of the excitation was admissibly predicted by the numerical model. Moreover, the numerically obtained maximum excess pore pressure at the middle of the liquefiable sand layer was in acceptable agreement with the experimental record.
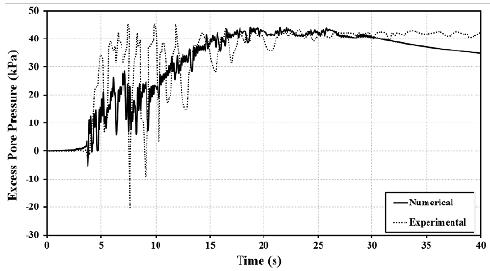
Figure 4 Evolution of excess pore pressure with time at middle of liquefiable sand layer (benchmark Experiment No. 2)
Similar results for benchmark Experiment No. 3 are presented in Figs. 6 and 7. For this model, the rate of settlement was identical for the numerical and experimental results. The predicted final settlement and maximum excess pore pressure by the developed model was approximately 10% less than that measured in the experiment.
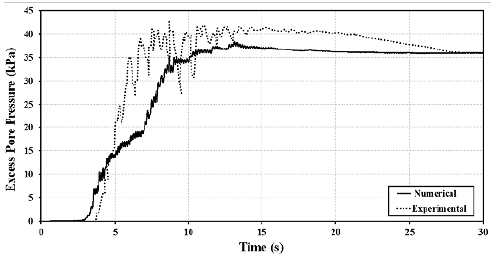
Figure 6 Evolution of excess pore pressure with time at middle of liquefiable sand layer (benchmark Experiment No. 3)
Gently sloping sand layer
Figure 8 displays the evolution of the excess pore pressure with time at different depths for Experiment No. 4. Both the numerical and experimental results indicated that initial liquefaction (r u = 1) was more probable at lower depths. The results also indicated that the trend of the generation and dissipation of the excess pore pressure at the middle and deepest depths (5.0 and 7.5 m) obtained from the numerical simulation was in a better agreement with the experimental observations compared to the depth of 2.5 m. At this depth, the numerical results indicated an increase in the excess pore pressure commenced immediately after the beginning of the cyclic loading. However, the experimental excess pore water pressure began to increase after approximately two seconds from the beginning of the loading, with a higher rate compared to the numerical results.
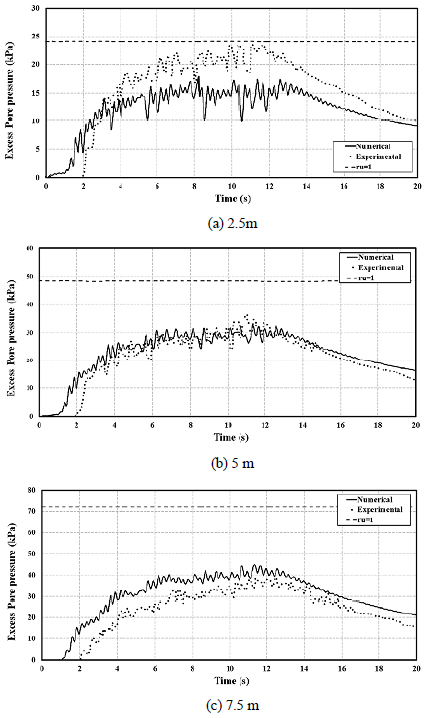
Figure 8 Evolution of excess pore pressure with time: (a) 2.5 m, (b) 5.0 m, (c) 7.5 m (benchmark Experiment No. 4)
Variations in soil displacements over time at the surface of the gently sloping layer are displayed in Figure 9. A comparison of the predicted and measured settlement versus time indicates that the discrepancy between the predicted and measured settlement increased after 8 s; hence, the final amount of the numerical settlement was approximately 3 cm higher than the experimental settlement. Conversely, the lateral displacement of the surface was under-predicted by the numerical model at the end of the seismic loading.
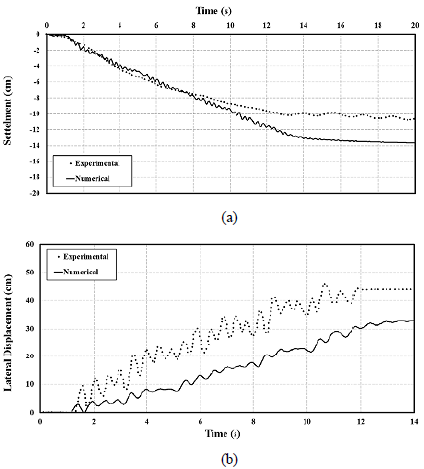
Figure 9 Variation of soil displacements at surface of gently sloping layer: (a) settlement, (b) lateral displacement (benchmark Experiment No. 4)
In Figure 10, a comparison is made between the buildup of excess pore pressure observed in Experiment No. 5 with the results of the numerical simulation. The figure indicates that the numerical curves obtained from the numerical model followed the trend of the experimental time history at all considered depths. Similar to Experiment No. 4, the largest discrepancy between the numerical and experimental results occurred at the shallower depth of 2.5 m. Moreover, the predicted excess pore pressure curve indicates reduced oscillation amplitude compared to the measured values.
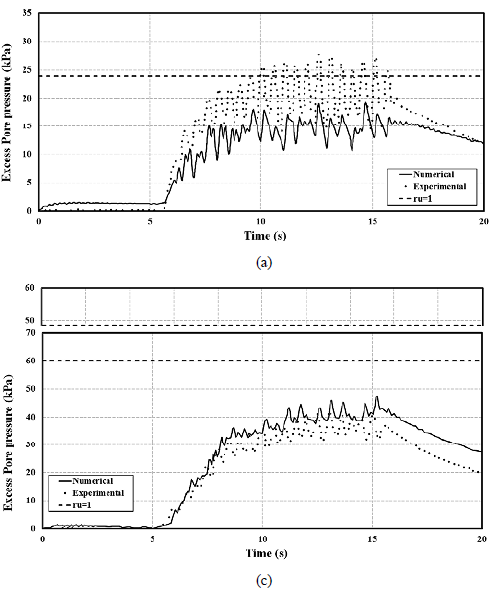
Figure 10 Evolution of excess pore pressure with time: (a) 2.5 m, (b) 5.0 m, (c) 7.5 m (benchmark Experiment No. 5)
Figure 11 presents the variation of the vertical and lateral displacement of the soil layer at the ground surface. Figure 11a indicates an excellent agreement between the numerical and experimental results. However, the numerical model predicted a lateral spreading of the layer surface with less than a 15% error at the end of shaking.
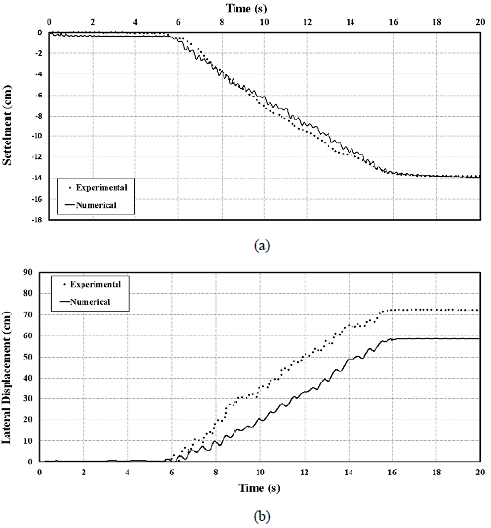
Figure 11 Variation of soil displacements at surface of gently sloping layer: (a) settlement, (b) lateral displacement (benchmark Experiment No. 5)
The results of the variations in the excess pore pressure and lateral displacement versus time at different depths of Experiment No. 6 are displayed in Figures 12 and 13. Similar to two other gently sloping experiments (No. 4 and No. 5), the numerical model under-predicted the values of the maximum excess pore pressure with a maximum error of approximately 10% and 20% at depths 2.5 and 7.5 m, respectively. Fig. 13 indicates that the difference between final lateral displacement of the layer obtained by the numerical model and measured in the experiment was less than 5% for the depth of 1.25 m, with the discrepancy increasing to approximately 15% for the depths of 2.5 m and 5 m.
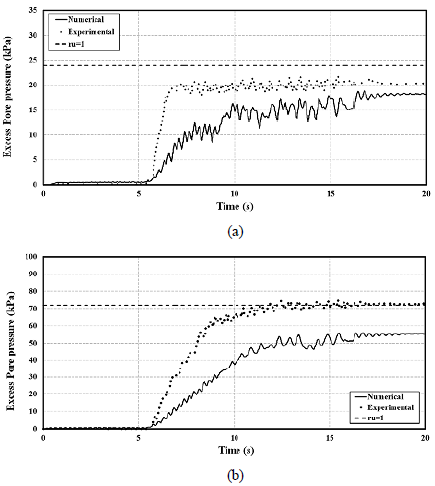
Figure 12 Evolution of excess pore pressure with time: (a) 2.5 m, (b) 7.5 m(benchmark Experiment No. 6)
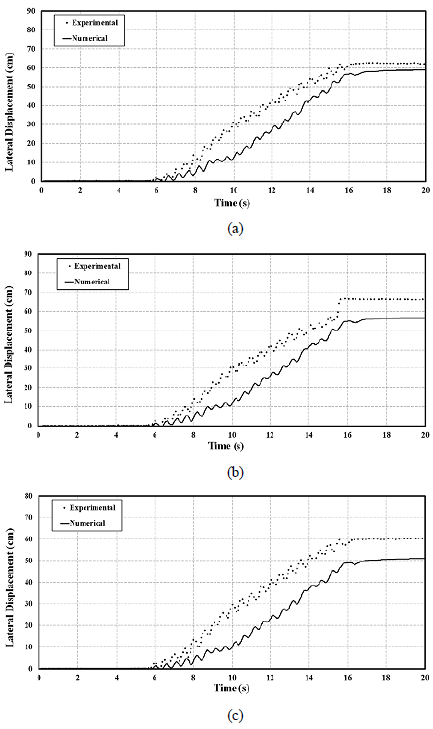
Figure 13 Variation of lateral soil displacements with time at different depths: (a) 1.25 m, (b) 2.5 m, (c) 5.0 m (benchmark Experiment No. 6)
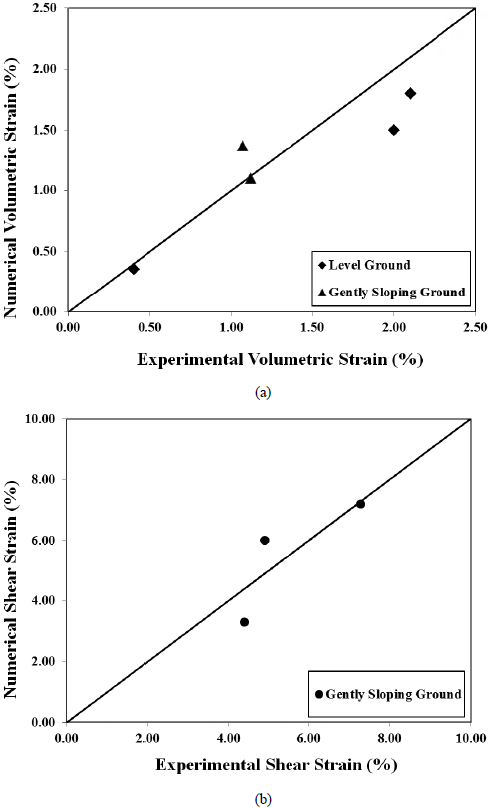
Figure 14 represents a comparison between the average volumetric and shear strain predicted by the numerical model and experimental results. Figure 14a indicates a relatively acceptable agreement between the numerical and experimental average volumetric strains for both cases of level and gently sloping ground. For the majority of the considered cases, the numerical simulations marginally under-predicted the average volumetric strains (consequently the settlements). Figure 14b implies that the average shear strain of the soil layer obtained by the numerical model for one of the studied cases was in excellent agreement with the experimental records. However, for the other two cases, the difference between the numerical and experimental results was approximately 20%. There are several reasons that can be considered for the deviation of the numerical results from those observed in the experiments. Because no vertical acceleration input was applied in the numerical models in this study, a part of the difference between the numerical and experimental results can be attributed to the assumption made in the numerical model, which did not completely correspond to the real condition of the tests (e.g., the measured vertical accelerations in benchmark Experiment No. 1 is approximately 0.04g). Moreover, employing the same set of constitutive model constants for the different Nevada sands used in the considered experiments could possibly not be in complete accordance with the real physics of the problem. Finally, the values of the actual modeling parameters such as fluid compressibility coefficient, which were not measured in the experiments, could have had a significant effect on the obtained results.
Conclusion
In this study, a fully coupled finite element model was applied to investigate the response of a saturated sand layer, either level or with a gently sloping ground, subjected to seismic loading. For this purpose, a well-known critical state two-surface plasticity constitutive law adequately verified in simulating cyclic behavior of sands was employed in the numerical analyses. Furthermore, applying a recently proposed variable permeability function, which relates the permeability coefficient to the excess pore pressure ratio, was used to enhance the model to simulate the gradual variation of saturated soil permeability during seismic loading. In this function, the maximum permeability coefficient occurring during the liquefaction of the sand was considered to be ten times the initial (static) permeability coefficient, which is in agreement with several experimental observations and can be justified by theoretical evidence.
The focus of the study was to validate the applicability of the proposed variable permeability function in numerical simulations of different geometrical condition of ground surface by comparing the results of the numerical modeling with measurements of other creditable centrifuge experiments. For this purpose, six centrifuge experiments involving three tests on a uniform leveled sand layer and three tests on a uniform sloping layer with different conditions of relative density, base acceleration time history, and slope angle were simulated using the developed numerical model. In general, the results of the numerical simulations, including excess pore pressure time histories at different depths, settlement of ground surface, and lateral displacement of soil layer at different depths were in agreement with the experimental measurements. Although in specific cases, the predictions by the numerical model indicated relatively considerable discrepancy from the experimental records, up to 20%, the more realistic modeling of the water discharge from the soil mass during earthquake loading using the variable permeability function significantly improved the simulation results compared to the previous numerical models using a constant permeability coefficient. The deviation of the numerical results from the experimental data could be attributed to the assumptions made in the numerical model that do not completely correspond to the condition of the experiments. For example, the vertical acceleration and fluid compressibility coefficients that were not measured or reported in the experiments could influence the obtained results significantly. Moreover, using the same set of constants for the constitutive model and variable permeability functions for the different conditions could possibly not be in complete accordance with real physics of the problem.

