


 Inglês (pdf)
 Artigo em XML
 Referências do artigo
 Enviar este artigo por email
 Citado por SciELO
  Citado por Google
  Similares em
SciELO
Similares em
SciELO  Similares em Google
 Permalink
Introduction
Ningdong Coalfield is one of the largest coal production bases in China. The large-scale ground damage in Ningdong Coalfield will profoundly influence the ecological environment of the Loess Plateau of China. Therefore, investigating the status of ground damage and analyzing the trend of ground deformation in Ningdong Coalfield are important for revealing the evolution process and helpful to the early warning of the mine disaster. Experience in previous work, mining engineers always analyze ground deformation through monitoring points using level measurements, global navigation satellite system measurements, or geodesy. The following shortcomings were exhibited in these approaches. (1) They are low spatial resolution, they can only monitor the value of control points but not in other unknown regions; (2) They are long work cycle and costly but low efficiency, the survey crew have to spend a long time to monitor the deformation points, and it is difficult to monitor the deformation in bad condition zones. (3) Limited to the spatial resolution, they cannot monitor the unknown subsidence in the mining area; they are inapplicable to monitor the deformation in large-scale coalfield fleetly and accurately. (4)Because of the limited theoretical analysis, it is difficult to identify the mining subsidence regularity using within-data observation of discrete points, and also it cannot satisfy the actual requirements of disaster prevention and prediction in the mining area (Chen et al., 2010; Wang et al., 2014).
Interferometric synthetic aperture radar (InSAR) offers an approach to observation Earth using active electromagnetic signals. Graham's findings indicated that InSAR can measure ground topography; InSAR has the advantages of all-weather, all-day, and cloud influence free monitoring (Mukul et al., 2016). Graber et al. discovered differential InSAR (D-InSAR) technology, and it can monitor centimeter-level or smaller ground deformation along the line of sight (LOS) of a radar satellite (Graber et al., 1996). After that, scholars research landslides (Huang et al., 2017; Cigna et al., 2014), mining subsidence (Mroz & Perski, 2003; Fan et al., 2015), urban water-loss settlement (Bai et al., 2016; Liu et al., 2016) volcanic activities (Rosen et al., 1996; Schaefer et al., 2016), glacial shift (Muskett et al., 2008; Necsoiu et al., 2016), earthquake deformation (Massonnet et al., 1993; Chao & XinJian, 2006) using this approach. However, D-InSAR technology's monitoring gradients are limited (Wang et al., 2014), mining subsidence with immense deformation in a short time will cause decorrelation in the interferogram. Moreover, it is difficult to remove phase errors, including such as atmospheric delay and orbit residue error for the traditional D-InSAR. Nonetheless, many scholars reported that traditional D-InSAR technology has been experimented in many areas successfully. Wherein, some scholars have acquired a lot of research findings in selected mining areas using D-InSAR technology, and some of them proposed some new ideas. Wegmuller et al. surveyed surface subsidence caused by underground mining using D-InSAR successfully (Wegmuller et al., 1999; Normand & Heggy, 2015; Huang et al., 2019; Raucoules et al., 2018; Ng et al., 2009; Yufeng et al., 2014). Daqing Ge et al. have outlined deals largely with mining subsidence monitoring experiments using D-InSAR, and they confirmed the feasibility of using D-InSAR in large-scale mining subsidence monitoring (Wu et al., 2005; Daqing et al., 2007; Jingfa et al., 2008; Dong & Tang, 2018; Yang et al., 2018; Yang et al., 2010; Zhu et al., 2011; Wang et al., 2015). Therefore, the significant features of the traditional D-InSAR technology are low costs and observation efficiency, a couple of SAR images with an appropriate interferometric strategy can recognize surface deformation associated with past-mining activities (Temporim et al., 2018). Usai et al. present a least-squares (LS) database approach for SAR interferometric data, they computed the deformation velocity of highly coherent target points via LS estimation, and successfully overcame the shortcomings of D-InSAR and acquired accurate subsidence data (Usai, 2003). After that, the small baseline subset (SBAS) InSAR technology developed from the traditional D-InSAR technology. Berardino et al. proposed the small baseline subset (SBAS) algorithm based on the LS model, and then Bateson et al. applied the SBAS-InSAR method to the South Wales Coalfield successfully. They selected InSAR data pairs with small spatial baselines and short temporal baselines; put forward the singular value decomposition (SVD) method to combine multiple small baseline subsets (Berardino et al., 2002; Samsonov et al., 2013; Bateson et al., 2015). Therefore, SBAS-InSAR technology does not only have the advantages of all-weather, all-day, and cloud influence free monitoring but can also enlarge monitoring gradients effectively, solve the spatial and temporal decorrelation among SAR data sets, acquire deformation values in high coherence targets during different time periods. Bateson et al. developed the three-dimensional phase unwrapping algorithms; Yin et al. put forward extraction algorithms of coherent target points and error elimination algorithms, and Lanari et al. improved the time-series deformation model, these algorithms and improvement optimized SBAS-InSAR technology and improved monitoring accuracy (Yin et al., 2011; Zhou et al., 2013; Zhao et al., 2013; Lanari et al., 2006; Lanari et al., 2007).
Coal is one of the most important energy resources, it represents the largest proportion of Chinese petrochemical energy, and therefore mining area subsidence hazard caused by coal mining has attracted much more attention. Mining industries are mainly distributed in northern, and north-western China. Many Chinese scholars have used SBAS-InSAR technology to monitor surface subsidence in coalfields. For instance, Fan et al. monitored the Huaibei mining area and the Yulin mining area using SBAS-InSAR technology, found the deformation areas (Fan et al., 2014; Fan et al., 2017). Zhao et al. (2018) combined the probability integral method and time-series InSAR technology to predict the deformation area in the Fengfeng mining area (Diao et al., 2016). But there are few pieces of research on the Loess Plateau in the west of China. There are several challenges to monitoring mining deformation in the Loess Plateau of China using SBAS-InSAR technology: (1) There is loose soil, plateau beam broken, gully aspect, it is difficult to find high coherent target points. (2) Due to the loose soil on the surface, mining activities underground will trigger landslides which are difficult to monitor. (3) Mining subsidence in plateau beam broken reveals unique characteristics, such as non-linearity and sudden collapse, which results in phase unwrapping errors.
In this paper, Ningdong coalfield is selected as the research area, deformations in the mining region are presented with C-band data, which were gathered in descending paths of Sentinel-1A images, and SBAS-InSAR method is introduced to study the ground subsidence caused by the exploitation of mineral resources in this area. The time-series deformation information is obtained, the spatial and temporal development of the subsidence centers in the mining area is analyzed. SBAS-InSAR technology provides an opportunity to determine the temporal evolution of land subsidence phenomenon with the InSAR time series in the Loess Plateau of China.
Materials and Methods
Site selection
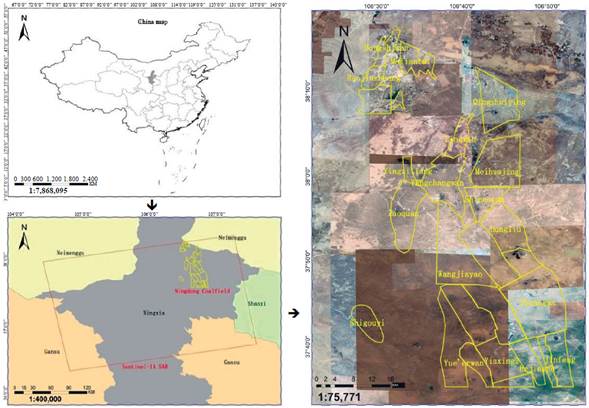
Ningdong coalfield is located in the east of Yinchuan, the capital city of Ningxia province, as shown in Figure 1. Its geographical coordinates are 37°07'15"-38°17'17" N and 106°18'49"-106°57'44" E. The mine area consists of a series of folds (NNW or nearly SN) and faults, and it extends eastward to the Erdos Syncline and stretches westward to tectonic zone in Liupan mount. Its north-south length is approximately 210 km and its east-west width is approximately 23-35 km, thereby covering an area of approximately 5900 km2. The proven reserves are 273.14Gt. Ningdong Coalfield covers a cluster of the mines of 1-million-tons annual production that comprise more than 10 underground coal mines, including Hongshiwan(HSW) mining area, Renjiazhuang(RJZ) mining area, Yangchangwan(YCW) mining area, Meihua(MH) mining area, Qingshuiying(QSY) mining area, Lingxin(LX) mining area, Shigouyi(SGY) mining area, Jinfeng(JF) mining area and Zaoquan(ZQ) mining area, etc. Among them, the RJZ mining area, YCW mining area, QSY mining area, SGY mining area, and JF mining area are being exploited and more than 5-million-tons annual production. Ningdong coalfield is suffering from a large-scale, centralized distribution of mining subsidence and ground damage because it is located on the Loess Plateau. The geological structure above mineable coal beds is fragile.
Data Selection
In this paper, 19 SAR images(C-band) for a fifteen months period between 09 March 2015 and 07 June 2016 were processed, which were acquired by the ascending orbits on-board ESA's Sentinel-1A satellite. The image stack covers an area of 250 km by 250 km, and the slant range and azimuth pixel spacing of the scenes are 5m and 20m, the repeat cycle of Sentinel-1A SAR sensors is 24 days. Ningdong coalfield is contained in the image stack, considering the computational efficiency, the Sentinel-1A SAR image stack covered Ningdong coalfield was extracted to estimate vertical average surface subsidence velocity and time-series deformation maps. Specific parameters of Sentinel-1A data are illustrated in Table 1.
Table 1 Sentinel-1A data covering Ningdong coalfield used in this work
| No. | Acquisition Date (yyyymmdd) | Track | Product type | Mode | Polarization | Orbit direction |
|---|---|---|---|---|---|---|
| 1 | 20150309 | 157 | SLC | IW | VV | ascending |
| 2 | 20150402 | 157 | SLC | IW | VV | ascending |
| 3 | 20150426 | 157 | SLC | IW | VV | ascending |
| 4 | 20150520 | 157 | SLC | IW | VV | ascending |
| 5 | 20150613 | 157 | SLC | IW | VV | ascending |
| 6 | 20150707 | 157 | SLC | IW | VV | ascending |
| 7 | 20150731 | 157 | SLC | IW | VV | ascending |
| 8 | 20150824 | 157 | SLC | IW | VV | ascending |
| 9 | 20150917 | 157 | SLC | IW | VV | ascending |
| 10 | 20151011 | 157 | SLC | IW | VV | ascending |
| 11 | 20151104 | 157 | SLC | IW | VV | ascending |
| 12 | 20151222 | 157 | SLC | IW | VV | ascending |
| 13 | 20160115 | 157 | SLC | IW | VV | ascending |
| 14 | 20160208 | 157 | SLC | IW | VV | ascending |
| 15 | 20160303 | 157 | SLC | IW | VV | ascending |
| 16 | 20160327 | 157 | SLC | IW | VV | ascending |
| 17 | 20160420 | 157 | SLC | IW | VV | ascending |
| 18 | 20160514 | 157 | SLC | IW | VV | ascending |
| 19 | 20160607 | 157 | SLC | IW | VV | ascending |
Orbit state vectors for the 19 Single Look Complex scenes were released by the European Space Agency (ESA) who improved and minimized orbital errors firstly. The orbit state vectors were named as Precise Orbit Ephemerides (POD) data, which were available for the orbital refinement and phase re-flattening.
The three arc-second Shuttle Radar Topography Mission (SRTM) DEM provided by the National Aeronautics and Space Administration (NASA) was adopted to remove topographic phases.
Fundamental Principle of SBAS-InSAR Technique
The SBAS-InSAR technique processing is divided into two stages: D-InSAR processing and time series processing. D-InSAR processing generates differential interferograms produced by SAR image pairs based on baseline threshold (including flat-earth phase removal, topographic phase removal, interferogram filtering, phase unwrapping, and baseline refinement). Time series processing estimates deformation information of every single differential interferogram and regards them as measured values. The deformation rate and time series can be solved by the least square (LS) method; the measured values are solved by singular value decomposition (SVD) [34,37,40]. Processing steps are as follows:
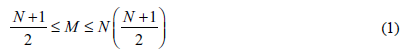
Assuming that a set of N + 1 SAR images acquired at ordered times (t0, … , tN) covering Ningdong coalfield, M interference fringe images are generated based on the baseline threshold. The number of interference fringe images satisfies the following inequality:
Considering two interference fringe images acquisition at times tA and tB (tB > tA), any interferogram j is generated between time tA and tB. The unwrapped phase can be expressed as follows:
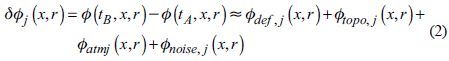
In formula (2), ф j (x,r ) is the j image and the interference phase in pixels of azimuth and range coordinates (x,r). ф(t B ,x,r) and ф(t A ,x,r) are phase values of SAR images at two different times. ф def , j (x, r), ф topo , j ( x,r ), ' ф atmj (x,r), ф noise , j (x,r) represent deformation phase, residual phase due to inaccuracies in reference DEM, depicts atmospheric phase error random noise phases between times tB and tA respectively. To achieve deformation information ф def , j (x, r ) ф topo , j (x, r) ф atmj (x, r ),and ф noise , j (x, r ) should be separated from ф j (x, r). There are M equations in equation (2) after removing the ф topo , ф atmj , and ф no¡se , written in matrix forms:

In formula (3), A is an M × N coefficient matrix, M is the number of interference phase images, and N represents the numbers of SAR images.
ф T =[ф (t 1),…,ф (t N)] represents the vector of the phase of the high-coherence pixel. δф T =[δф 1 ,...,фn] are unwrapped phase values of differential interference images.
The deformation rates of high-coherence pixels were integrated into the time interval between master and slave images. The matrix form can be written as follows:

In formula (4), B represents an MX N coefficient matrix, it can be solved by using the least-squares (LS) or singular value decomposition (SVD) algorithm (Lanari et al., 2004), and v T can be represented as follows:
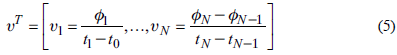
Then the minimum norm solution of the data vector can be acquired. Finally, Deformation rate and deformation time series can be achieved and derived according to the time interval between SAR images.
Data processing
In this study, there are two steps for data processing as the above-mentioned: generating differential interferogram, retrieval deformation rate, and time series. The specific steps are as follows:
Generate Differential Interferogram
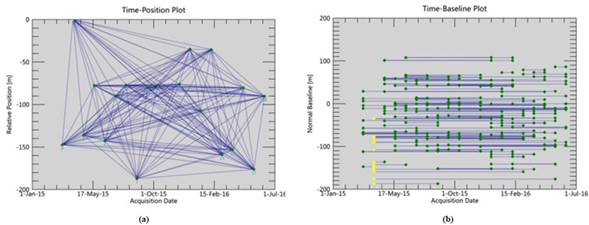
The proper SAR pairs are selected within the thresholds of the perpendicular and temporal baseline; only small baseline interferometric images will be generated. Then the SAR data pair connection diagram is generated in Figure 2. In this experiment, considering the C-band Sentinel-1A data with small perpendicular baselines are coherent. The maximum spatial baseline was set at 300 m. The maximum temporal baseline was set as 200 days. The system selected the super master image automatically which was acquired on 2 April 2015. All the other 18 scenes SAR images were selected as slave images which were co-registered and resampled to the super master image. Interferometric pairs with high coherence and fine unwrapping were screened, 78 differential interference images remained.
Remove Topographic Phases and Flat-Earth Phases.
The topographic phase was eliminated using the SRTM DEM which was provided by NASA. And the flat-earth phase was removed using POD data released by the ESA.
Subsidence Rate and Time Series Retrieval
Subsidence rates can be estimated by the LS method because the combination of differential interferogram was integrated into the time interval between master and slave images (Goldstein & Werner, 1998). The estimated linear subsidence was subtracted first from raw subsidence time series. Then eliminated atmospheric phase, random noise phases, and only nonlinear subsidence remained, it can be separated through temporal and spatial bandpass filtering (Hooper, 2008). Finally, adding up nonlinear subsidence and linear subsidence we could retrieve subsidence time series.
Results
Subsidence Rate Map
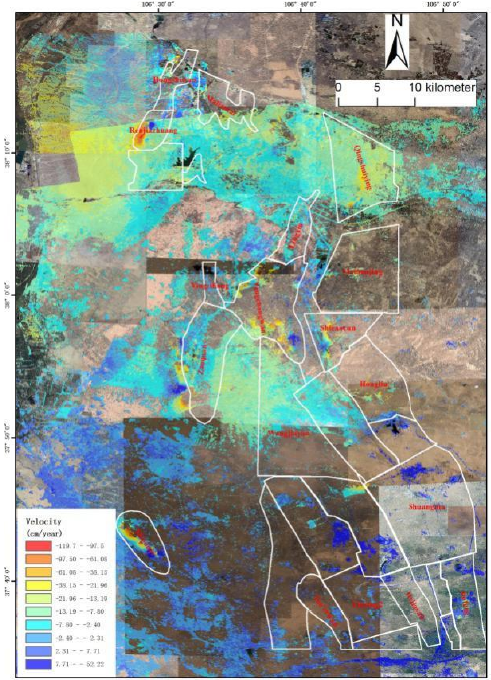
Figure 3 shows the subsidence rate map derived using SBAS InSAR; the map is superimposed on the optical imagery of Ningdong coalfield acquired in 2016. Positive values of rate map indicate that the surface is uplifting in the vertical direction, whereas negative values denote surface subsidence in the vertical direction. SBAS InSAR-derived results in Figure 3 reveal that annual average subsidence rates in Ningdong coalfield from -117 cm/year to 18 cm/ year, and the largest subsidence rate was detected in RJZ mining area.
Subsidence Time Series
Figure 4 shows the surface cumulative subsidence time series in Ningdong coalfield from 09 March 2015 to 07 June 2016. The Sentinel-1A TOPS SAR image acquired on 09 March 2015 was considered a reference time of the time series in the SBAS InSAR method. The maximum cumulative subsidence in this period is -178 cm, and it was located in RJZ. Southern parts of Ningdong coalfield are relatively stable, and most of the cumulative subsidence in these areas range from -10 cm to 10 cm. The magnitude of subsidence in major subsidence areas (i.e., RJZ mining area, QSY mining area, SGY mining area) gradually increased with time. Size of these subsidence areas also gradually expanded.
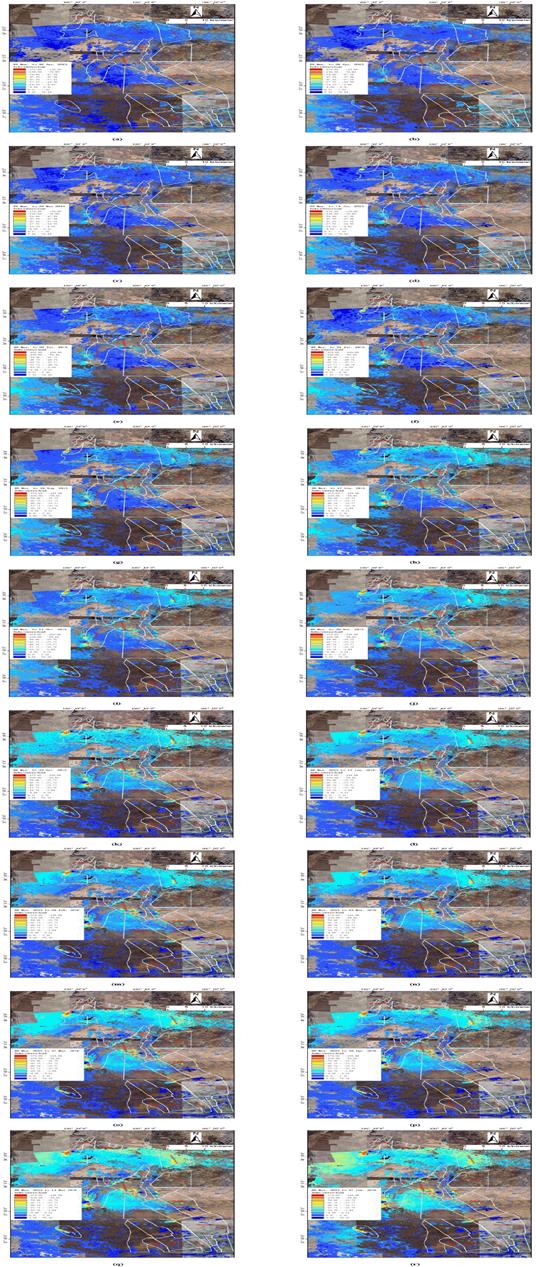
Figure 4 Cumulative subsidence maps time series from 09 Mar. 2015 to 07 Jun. 2016. The background is optical imagery of Ningdong coalfield acquired in 2016. (a)-(r) are Cumulative subsidence maps of 15 months in Ningdong coalfield. (a) 09 Mar. 2015 to 02 Apr. 2015; (b) 09 Mar. 2015 to 26 Apr. 2015; (c) 09 Mar. 2015 to 20 May 2015; (d) 09 Mar. 2015 to 13 Jun. 2015; (e) 09 Mar. 2015 to 07 Jul. 2015; (f) 09 Mar. 2015 to 31 Jul. 2015; (g) 09 Mar. 2015 to 24 Aug. 2015; (h) 09 Mar. 2015 to 17 Sep. 2015; (i) 09 Mar. 2015 to 11 Oct. 2015; (j) 09 Mar. 2015 to 04 Nov. 2015; (k) 09 Mar. 2015 to 22 Dec. 2015; (l) 09 Mar. 2015 to 15 Jan. 2016; (m) 09 Mar. 2015 to 08 Feb. 2016; (n) 09 Mar. 2015 to 03 Mar. 2016; (o) 09 Mar. 2015 to 27 Mar. 2016; (p) 09 Mar. 2015 to 20 Apr. 2016; (q) 09 Mar. 2015 to 14 May 2016; (r) 09 Mar. 2015 to 07 Jun. 2016.
Discussion
Mining Subsidence Status in Ningdong Coalfield
As shown in Figure 4, several deformation areas were identified in Ningdong coalfield whose characteristics were prominent uneven subsidence patterns. The major subsidence areas include RJZ mining area, QSY mining area, YCW mining area, SGY mining area, JF mining area. We detected six deformation centers which subsidence rates greater than -48cm/year (Table 2).
Table 2 Characterization of Deformation pits in Ningdong Coalfield.
| NO. | Geographic Coordinates (WGS84) | Mining area Location | Subsidence rates (cm/year) | Characterization |
|---|---|---|---|---|
| 1 | Longitude:106.479502 Latitude:38.185305 | Renjiazhuang | -117.66 | Formed a "bowl" with a diameter of 12 meters in the farmland |
| 2 | Longitude:106.739867 Latitude:38.136653 | Qingshuiying | -53.05 | Formed landslide in farmland |
| 3 | Longitude:106.622403 Latitude:38.027403 | Yangchangwan | -80.67 | Formed ground fissure with 3 meters width and collapse in farmland |
| 4 | Longitude:106.633408 Latitude:37.966727 | Yangchangwan | -73.97 | Formed ground fissure with 28 meters width and collapse in foul land |
| 5 | Longitude:106.469058 Latitude:37.721456 | Shigouyi | -82. 88 | Formed deformation basin with 18 meters width in the wasteland |
| 6 | Longitude:106.860975 Latitude:37.642009 | Jinfeng | -48.04 | Formed ground fissure with 0.5 meters width in farmland |
Among the above-mentioned six regions, RJZ, QSY, SGY, and JF mining areas feature subsidence bowls, and most of the serious subsidence bowl is distributed in the RJZ mining area. JF mining area features the smallest subsidence bowls, but its subsidence range is gradually expanding. Excessive deformation gradient changes the ground surface echoing characteristics in the center of the YCW mining area, resulting in decorrelation in the center area as well as the missing of large gradient deformation information. Additionally, these subsidence areas are mainly distributed in the 5-million-tons annual production mining area. In addition to the above-mentioned regions, other areas present small surface subsidence, and most subsidence rates are less than -20 cm/year. After inquiring about the construction history data, it was found that other mining areas were under construction in 2016, the intensity of underground activities is small.
From Figure 4, it can be seen that the SBAS technique can well monitor the range of influence and the trend in the development of mining subsidence. Figure 4(r) represents that the center areas of coal mining subsidence distribute in RJZ mining area, YCW mining area, QSY mining area, SGY mining area and JF mining area.
Because of the past mining subsidence and lack of field data, the reliability of interferometric measurements needs to be verified and validated. We visited these six mining areas, and only collected Global Position System (GPS) observation stations' data in SGY mining area. According to the geographic coordinates of deformation pits, we found six deformation pits using hand-held GPS receivers in RJZ mining area, YCW mining area, QSY mining area, SGY mining area, and JF mining area.
There are different deformation features in different mining areas. For instance, underground mining activities caused a large-scale basin on the ground in the RJZ mining area and formed a bowl with a diameter of 12 meters in the center of the mining area. Coal mining caused large-scale ground damage in the YCW mining area; it formed ground fissures with 3 meters width in the south and 28 meters north of the YCW mining area. And little-mode landslides occurred continually during mining in the QSY mining area. A long deformation basin formed in the SGY mining area, a collapse pit generated in the center of the deformation basin. The narrow ground fissure is the main deformation feature in the JF mining area.
Comparative analysis of SBAS and GPS data in SGY mining area
To verify the accuracy and reliability of the experiment results, we collected the GPS data and SBAS data in SGY mining area for analysis and comparison. In figure 6, they are a time series of deformation maps from March 2015 to June 2016 in SGY mining area, the green circles are GPS observation stations, the red rectangles are the working panels.
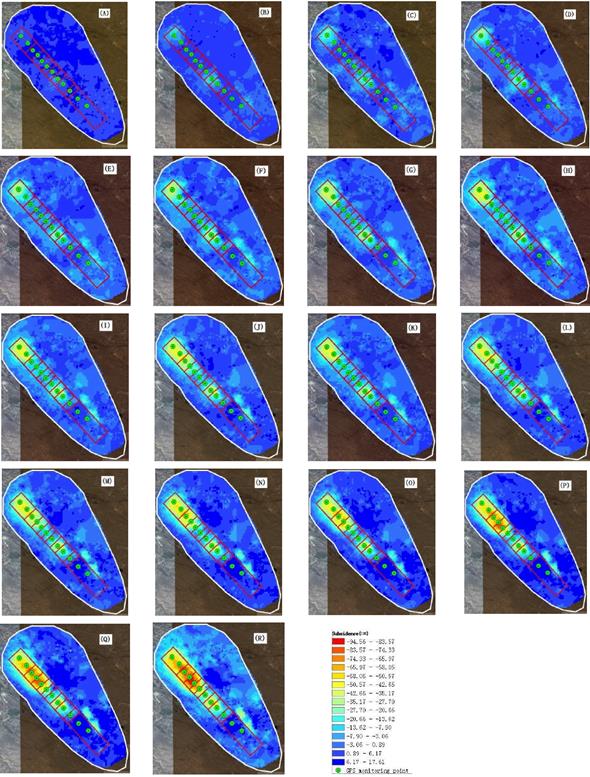
It can be known that the main deformation basin appeared in the research area for the continuous mine exploitation since March 2015, the maximum deformation in SGY mining area reached -94cm. This movement is a representative class of the settlement basin commonly involving digging and mining in the mining area. Especially, the observed displacements at the top of the mining area are consistent with the downward movement usually observed in rotary sliding: as continuous digging and mining in the mining area, the subsidence center moves from northwest to southeast, and the settlement area is obviously enlarged, and the settlement range extends southward.
There are twelve automatic real-time GPS observation stations above the tunnel in the SGY mining area. Thirteen GPS receivers were used simultaneously to carry out surveys in triangulation mode (keeping one at the base station). GPS data processing was done by GAMIT/GLOBK software in triangulation mode with respect to a reference station which is located in a relatively unaffected place in the neighborhood. The coordinate of the reference point was computed with respect to an existing control point of Survey. Along northwest to southeast direction, GPS observation stations were named GPS1 to GPS12 in sequence.
The time series of SAR data and GPS data covered the ranges from March 2015 to June 2016. Comparison results are seen in Figure 7. The x-axis represents the date of data acquisition, ranging from 09 Mar. 2015 to 07 Jun. 2016, and the y-axis expresses the deformation values in the vertical direction. GPS data are the high precision real-time observation data; we considered them to be the truth values to verify the accuracy of SBAS data.
From Figure 7, it can be seen that the subsidence curve of SBAS data is consistent with the subsidence curve of GPS observation station data. In particular, SBAS data agree well with GPS data in GPS1-GPS6, GPS8, and GPS9. The GPS data have the same trend as SBAS data in GPS7 and GPS10-12. Nonetheless, it was found that some uplifts occur in GPS7 and GPS10-12 observation stations which may be caused systematically by orbit error, or by an inappropriate selection of the reference points, we will try to understand this phenomenon and deal with it in our future work.
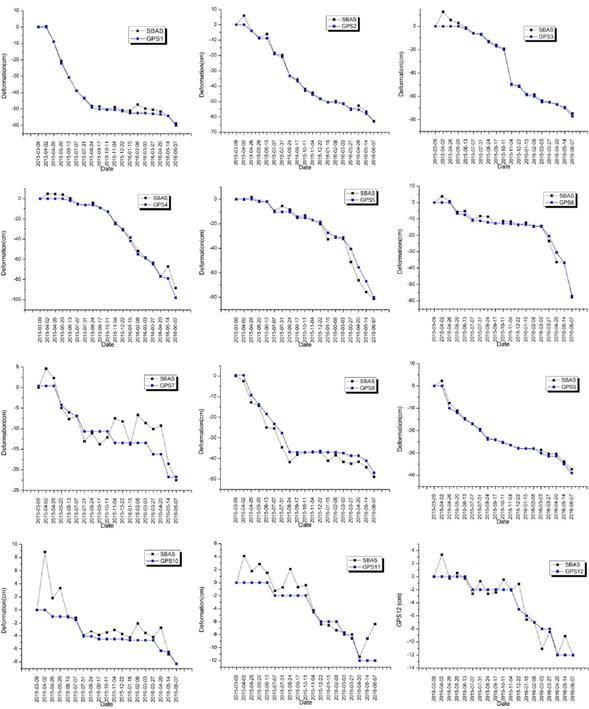
Figure 7 Comparison curves between SBAS-measured and GPS-measured deformation, the black curves show time-series deformation in GPS monitoring points using SBAS-InSAR technology, and the blue curves show time-series deformation in GPS monitoring points using GPS technology, curves(a)-(l) denote GPS monitoring points from GPS1 to GPS12.
Conclusions
In this study, SBAS-InSAR techniques allow us to understands the annual growing characteristics of subsidence in Ningdong coalfield. Surface deformation in the SGY mining area extracted from SAR images is discussed, and validation was conducted between SBAS data and GPS data.
1. From time-series image analysis results, the subsidence basins in the coal mine are found, the subsidence development trend in space and time are analyzed, and the mining subsidence rate is revealed, and the analysis of SBAS data indicates that the maximum rate is about -117cm/year in Ningdong coalfield.
2. The time-series analysis of SBAS-InSAR achieves more reliable results and more accurately reflects the mining subsidence characteristics of Ningdong coalfield. Five deformation centers that were distributed in the 5-million-tons annual production mining area are found.
3. The comparisons between the deformation obtained by the SBAS techniques and GPS results in the SGY mining area have been performed. The experimental results indicate that the settlement variation obtained by two different types of technology is consistent.
4. In addition, some factors, such as the inaccuracy of phase estimation error and DEM accuracy, will also affect the measurement results of SBAS; the large gradient deformation information in the center area is likely to be missing. How to estimate and separate effectively these errors, and obtain more reliable absolute deformation results in a large gradient deformation area, which will need to be done in the next step.

