


 English (pdf)
 Article in xml format
 Article references
 Send this article by e-mail
 Cited by SciELO
  Cited by Google
  Similars in
SciELO
Similars in
SciELO  Similars in Google
 Permalink
Introduction
The Hatay area is located in a seismically active region at the western end of the 1000-km long border formed by Arabic and Turkish plates. The tectonic activity of the region shows a complex tectonic behavior under the influence of faults extending to the Dead Sea, Eastern Anatolia, and Cyprus (Beyen et al., 2003). More than ten of the most disastrous earthquakes during the past century (1937-2015) occurred in this area, indicating that local site conditions have a major effect on ground shaking. It was reported that the tsunamis that occurred during the1822 and 1872 earthquakes in Hatay caused the death of 20 thousand people (Tari et al., 2013). These devastating earthquakes from the past have shown that local ground condition is a major influence on ground amplification which can be calculated by a S-wave velocity structure and microtremor studies. There have been several site effect studies in the forms of a microtremor survey, earthquake observations, a surface-wave survey, and borehole data for various regions in Turkey such as Bayülke (1982), Erdik (1984), Ambraseys et al. (1993), Inan et al. (1996), Aydan & Hasgör (1997), Durukal et al. (1998), Zare & Bard (2002), Ozalaybey et al. (2002), Rathje et al. (2003), Ergin et al. (2004), Kalafat et al. (2007), Sandikkaya (2008), Sandikkaya et al. (2010), Kalkan & Gürkan (2004), Ulusay et al. (2004), and Yilmaz et al. (2008). Zare & Bard (2002) used a (H/V) spectral ratio to estimate Turkey's strong motion site conditions, and Rathje et al. (2003) and Gulkan et al. (2007) used geophysical and geotechnical studies to determine the site classification of Turkish strong-motion sites. Many local site investigations have been conducted by many researchers in Turkey (Kurtulus et al., 2016; Ongun, 2010; Alcik et al., 1995; Dikmen & Mirzaoglu, 2005). However, only a few studies about site effect were performed in the Hatay region. Büyüksaraç et al. (2014) conducted a site response analysis, compiling data such as density, seismic wave velocity, and soil cross-sections from previous seismic microzonation studies and acceleration data from four free-field strong-motion stations of the SERAMAR project. They determined three different layers for the ranges 0-5 m, 5-15 m, and 15-25 m. The seismic velocities of these layers vary between 380 and 470 m/s for 0-5 m, 320 and 480 m/s for 5-15m, and 470 and 750m/s for 15-25m. Over et al. (2011) analyzed the microtremor data for Antakya and proposed a preliminary microzonation map for the province of Antakya based on dominant periods ranging from 0.2 to 0.8 sec and shear wave velocities of the sediments covering the area. Korkmaz (2006) studied the relationship between ground conditions and earthquake effect in Antakya. Horoz (2008) studied the seismicity of the region between Adana-Antakya-Kahramanmaraj with the parameter "b" and risk analysis. Ceken & Polat, (2014) tried to investigate local site effects with MATNet installed near the Hatay-Kahramanmaraj areas, consisting of 55 triaxial force-balance accelerometers and capable of recording explosions and evaluating them as a part of an early warning and preliminary damage estimate system. Ozmen et al., (2017) conducted a microtremor array exploration of shallow S-wave velocity profiles at 28 sites in the provinces of Hatay and Kahramanmaraj. They determined fundamental frequencies from 0.8 to 10 Hz in Hatay and peak amplitude values of more than 5 in Kahramanmaraj. There is also site predominant based seismic site classifications regarding sediment thickness carried out by researchers which promising reliable preliminary results (Livaoglu H., & Irmak T.S., 2017; Livaoglu, H., & F. Sertcelik, 2017). They have used the strong ground motion data and evaluated the site predominant periods of the installed stations via response spectra of H/V.
In this study of seismic refraction, Multichannel Analysis of Surface Waves (MASW), a refraction microtremor (ReMi) and single station microtremor studies were conducted at 26 strong-motion stations of AFAD located in the province of Hatay to investigate S-wave velocity distribution in shallow soil which is important in the design of seismic hazards.
Geology and tectonics of the region
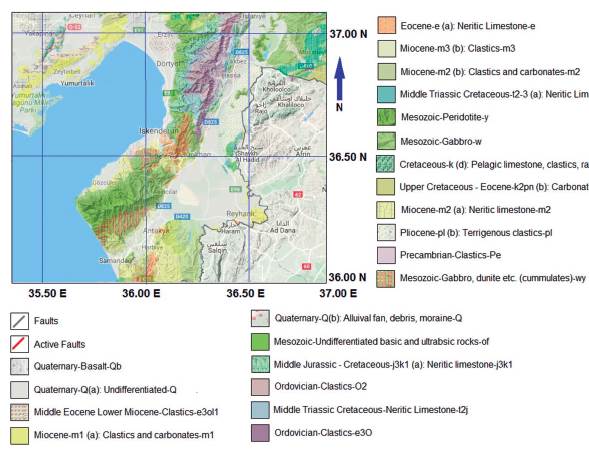
Hatay and its surrounding are located to the south of the Antakya-Kahramanmaraj graben, which developed under the influence of the Dead Sea and Eastern Anatolian Faults and the Cyprus Spring. The south of the graben is shaped by the Dead Sea Fault. However, Arabian and African plates move northward under the influence of convective currents in the mantle over the weakly resistant (fluid) upper asthenosphere. The slip vectors of earthquakes in the region, the fault systems, the global kinematic models based on the oceanic spread, indicate that the Arabian plate moves north-northwest to Eurasia at an average speed of 25 mm per year. The African plate is moving northward at about 10 mm per year in relation to Eurasia (Reilinger, et al.1997). Although many destructive depressions have been exposed in the historical period, there has not been an earthquake in the area for 135 years. This situation increases the risk of destructive earthquakes every day (Fig. 1). The Otokton Arabian platform rocks with the main lines of the geology of the Amanos Mountains covering the vast majority of the region; Ophiolite nappes; Neo-autoclaved sediments covering nappes and autochthonous units are defined. The Amanos Mountains located at the southern tip of the Eastern Taurus Mountains and the Kizildag ophiolite massif in the vicinity of them also have an important place in the geology of the region (Fig. 2).
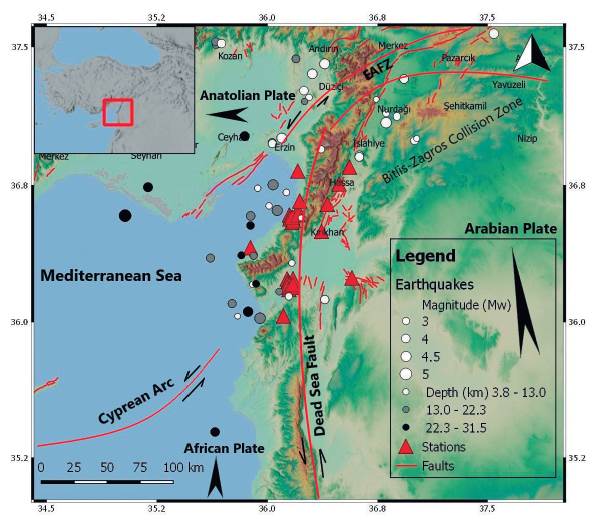
Figure 1 Tectonics of the study area, location of stations and epicenter of the earthquakes that have taken place in the last 10 years. Thick black dash arrows shows the plate's movements. Red triangles shows the stations. The colored circle points shows the earthquakes according to their magnitudes and depths
Data acquisition and analysis
Seismic refraction, MASW, REMI, and single station microtremor data were collected at AFAD's 26 strong motion stations in the province of Hatay in southern Turkey. The seismic refraction data were recorded for 2.0 sec with a sampling rate of 1.0 msec using a 50 kg weight-dropping energy source with a hydraulic weight-lifting unit operated by a battery powered electric motor. Number of 48 P- wave geophones with 4.5 Hz were fixed in line form at 2.0 m intervals (Fig. 3).
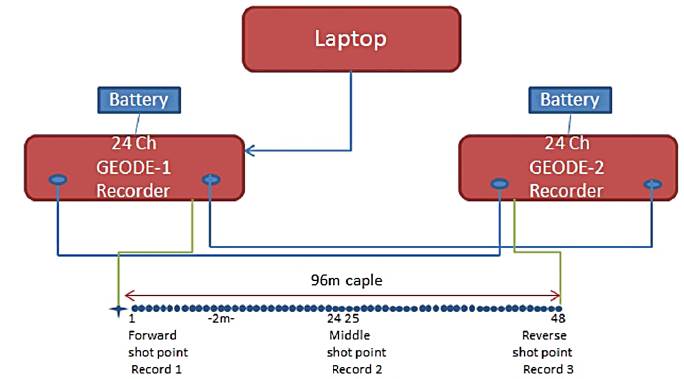
Data were collected from forward, midpoint, and reverse shootings with two m offsets; transferred to 48 channels GEODE recording units; and converted from analog to digital form. The midpoint of the geophone spread was placed as close as possible to the strong motion station on a flat area so that the static corrections of the shot and geophone points were neglected. An example of the shot records obtained at Station 3112 is shown in Figure 4a. The first arrival times of the refracted P-waves were picked from the field record, and the corresponding travel time-distance curves of the profile were determined (Figure 4b). The initial P-wave velocity-depth model was then obtained from the first arrival times. Then, this initial model was processed iteratively by nonlinear travel time tomography (Zhang & Toksoz, 1998) to obtain the final P-wave velocity-depth model. Iteration was stopped when the differences between the first arrival times and the modeled were reduced to an acceptable minimum value as 8. The P-wave velocity-depth cross-section of the site was determined laterally averaging the P-wave velocity-depth model (Fig. 4c).
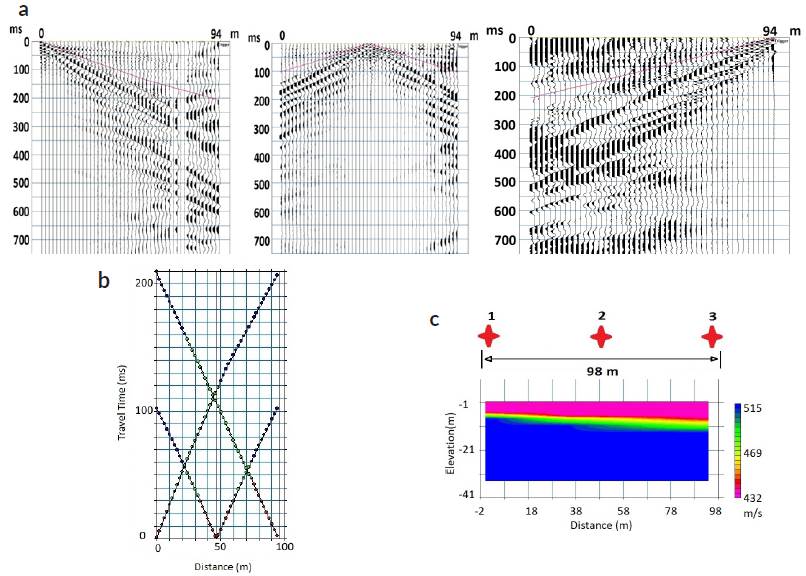
Figure 4 Sample seismic refraction record taken at the station coded 3112. (a) seismic refraction records with picked first arrival times showing as a red line, (b) observed and calculated travel time curves, (c) P-wave velocity-depth model along the profile
Shot records on both sides were used in the analysis of Multichannel Analysis of Surface Waves (MASW) to estimate the Vs profiles of the top 30 m. It was observed that layers varying in thickness from 5m to 18m up to 30m. The shot record was isolated from the refracted by muting before and after. Low and high frequency noises were filtered through a bandpass filter with frequencies (2, 4, 36, 48) Hz (Figure 5a). Thereafter, plane wave decomposition was applied to convert the data from the offset time to the phase velocity versus the frequency domain (Park et al., 1999; Xia et al., 1999). The dispersive curve related to a fundamental mode of surface waves was picked from this domain. The S-wave velocity was determined as a function of depth by inverting the dispersion curve. It has been observed that each frequency component of Rayleigh waves propagates at different phase velocities; in other words, these waves have scattering properties on the ground. The greatest share of the energy of the Rayleigh waves belongs to the fundamental mode, although not for every case. For this mode, dispersion curve representing the change of the phase velocity relative to the frequency is determined. This dispersion curve was used to determine the S-wave velocity-depth profile of the stationary region by inversion method (Fig. 5b). The dispersion curve for the basic mode showing the change of the frequency and the phase velocity is shown in Figure 5c.
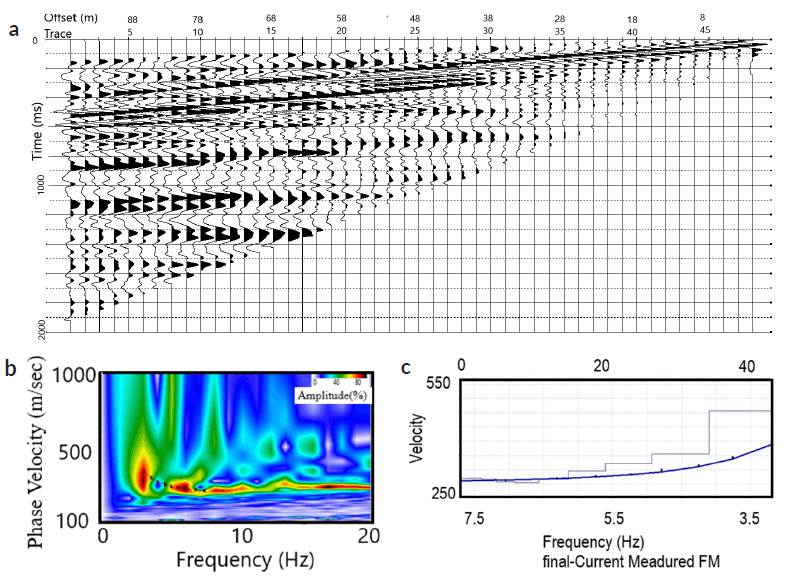
Figure 5 (a) The shot record separated from the refraction and reflected waves at the station coded 3112, (b) Phase velocity-frequency and picking dispersion curve , (c) Vs-depth profile and modeled dispersion curve. The S-wave-depth profile (blue) and the modeled dispersion curve (black).
A ReMi study was performed to check the velocity-depth profile obtained by the MASW method at a depth of up to 30 m as well as to find the velocity-depth profile at the lower half of 30m. The ReMi data were recorded for 32 sec with 2.0 msec sampling rate in the same field layout using ambient noise from wind and traffic as a seismic source. 24-25 records were stacked in each ReMi installation to remove the cultured noise from the microtremor data at each site. Rayleigh waves are distinguished from other waves by using two-dimensional slowness frequencies (p-f) transformations of noise records spreading in both directions. The Rayleigh wave dispersion is selected along the minimum velocity envelope of energy in the spectral image of the slowness frequency.
The spectrum is normalized as the ratio of the power spectrum at certain frequency slowness over the mean slowness values of that frequency. The best way to obtain accurate phase velocities is to choose the fundamental mode phase rate of the Rayleigh wave dispersion along the minimum edge of the vertical steep slopes of the dispersion curves (Louie, 2001). These Rayleigh wave dispersion picks are modeled using the experiment and error settings of the velocity-depth model to determine the shear wave velocity-depth profile. The time-distance data are shown in Fig. 6a. The dispersive curve for the fundamental mode of surface waves are transformed to frequency- phase velocity domain to pick fundamental dispersion curve (Fig 6b) and is inverted to obtain the S-wave velocity depth profile (Fig. 6c).
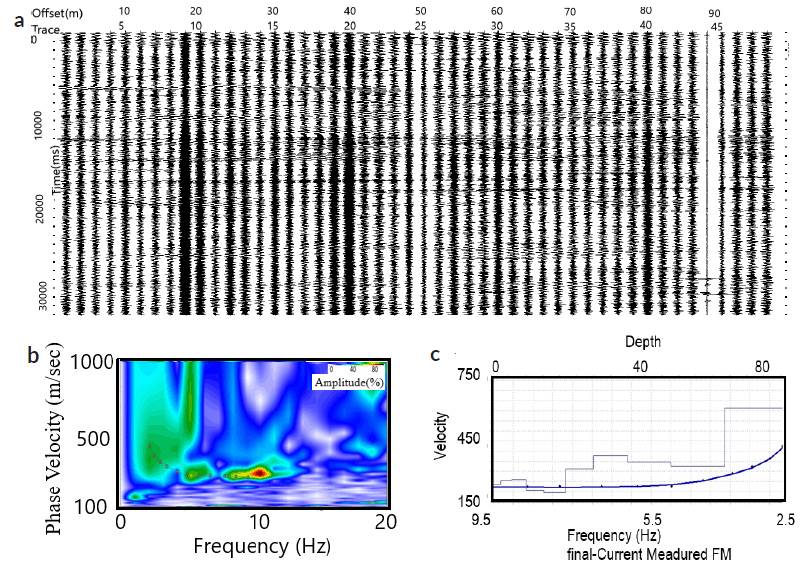
Figure 6 (a) ReMi data, x-t domain at the station coded 3112, (b) the dispersion spectrum calculated by separating the plane-wave components of the surface waves present in the seismic record, (c) ReMi S-wave velocity-depth profile (blue) and modeled dispersion curve (black). The vertical axis indicates the S-wave velocity and the horizontal axis shows the frequency of dispersion curve.
A velocity based broad-band sensor (flat response between 0.03-50 Hz) was used for ambient noise recording. Whole data were acquired with the same sensor. (Figs. 7a and 7b). The estimated spectra of the three components microtremor data are given in Fig. 8c. The H/V amplitude spectrum of dominant frequency and amplification of the 3112 coded station are given in Fig. 7c. As seen from Fig.7c, the dominant frequency of the ground is 5 Hz (period is 0.2 sec.) and H/V ratio or peak amplitude at this frequency is 6.6.
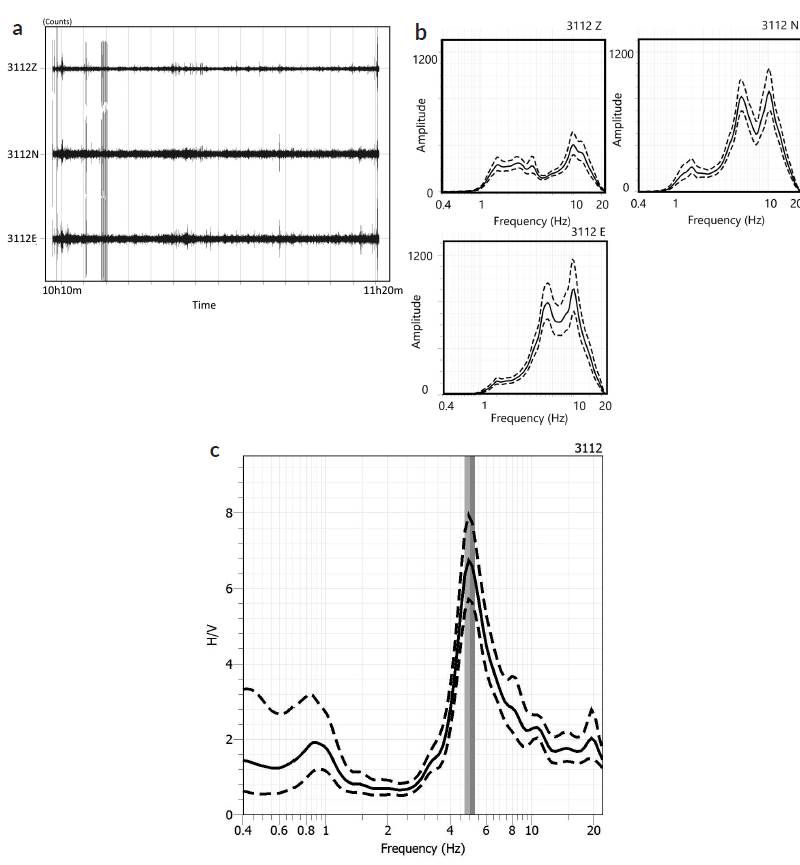
Figure 7 (a) Filtered time signal series, (b) The amplitude spectra of the three components microtremor data, the peak curves (average curve, black line), illustrate the corresponding resonant frequencies and (c) the H/V amplitude spectra. The dashed lines show the standard deviation of amplitude, and the two vertical gray areas show the peak frequency standard deviation domains.
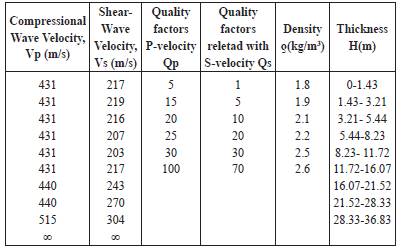
The theoretical H/V amplitude spectra of the stations were also calculated to check the validity of the observed values. The theoretical amplification functions of stratified soil layers (Table 1) were calculated according to the recursive algorithm proposed by Tsai (1970) and modified for calculations (see also Tsai and Housner, 1970, Herak, 2008). The theoretical amplification functions of stratified soil layers (Table 1) were calculated according to the recursive algorithm proposed by Tsai (1970) and modified for code (see also Tsai & Housner, 1970, Herak, 2008). The H/V transfer functions were synthetically derived for the station 3112 as shown in Fig. 8. Observed H/V curve were also estimated from the microtremor measurements for the 3112 coded station.
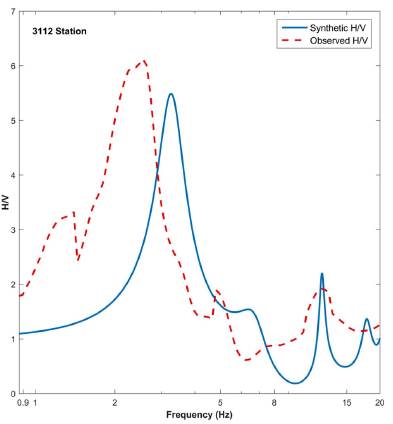
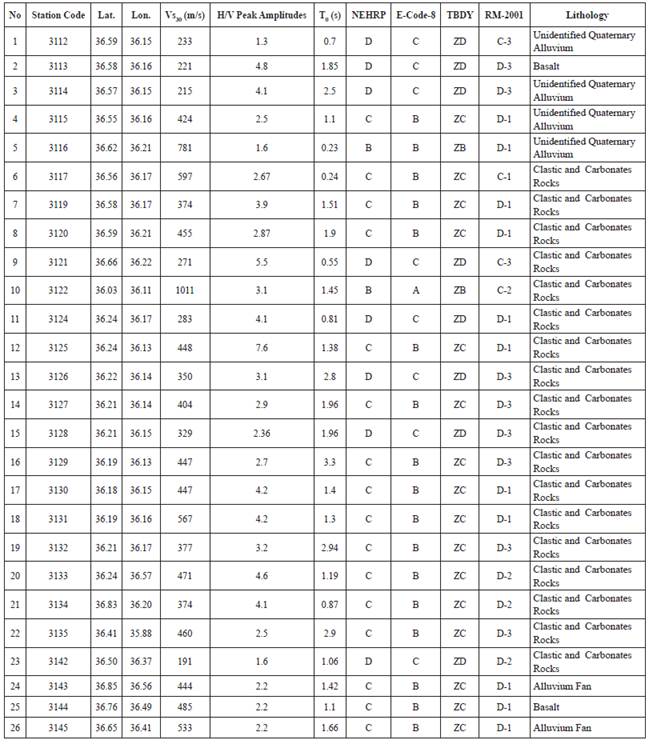
The values from the table 1 are in-situ measurements and results from the field near the stations. It can be clearly seen from the figure that the fundamental peak frequency corresponding to the H/V amplitudes are in step with each other which indicate 2.55 and 3.17 Hz respectively which are in the similar site class for predominant based site classifications. The significant difference between the fundamental frequencies and H/V amplitudes of the site could be originated from lateral irregularities. Besides, the fundamental peak frequency corresponding to the H/V amplitudes are compatible. The shear wave velocities, Vs30, soil classes, H/V peak amplitudes, and dominant soil periods are given in Table 2.
Where Vp and Vs are respectively the P and S- wave velocities, Qp and Qs are the quality factors related with P-and S-velocities, g is density, and h indicates the layer thickness.
Sites utilizing the information obtained from shallow field tests are classified according to BSSC (2003), CEN (2003), TBDY (2018), and Rodriguez-Marek et al. (2001), all of which recommend criteria based on the average shear wave velocity Vs30 of the top 30 m soil/rock profile. The mean shear wave velocity of the uppermost 30 m at a site is calculated by where di and Vs are respctively the thickness, shear wave velocity of the ith layer , and n is the number of layers in the top 30 m. The Vs profile obtained from the MASW measurements is used to compute the Vs30 for each strong motion station. Velocity-depth values obtained by MASW up to 30m depth are in good agreement with the values found by the ReMi method.
Site classification according to NEHRP provisions
The NEHRP recommends six field classes (A, B, C, D, E, and F) for identifying site-specific design spectra, shown in Table 3.
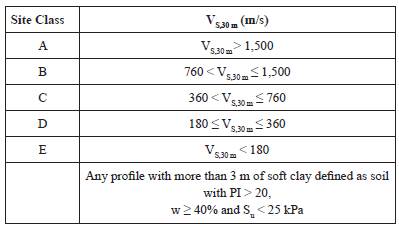
Based on Vs30 eight of the 26 sites are classified as Class D, 16 as Class C and two as Class B. In other words, 30.7% of the total places correspond to Class D, 61.5% to Class C, and 7.69% to Class B.
Site classification according to Eurocode-8
The field classification scheme proposed by Eurocode-8 is quite similar to the NEHRP provisions (Table 4). The difference between the two is that the A and B classes of the NEHRP provisions are included in Eurocode-8 as Class A. In addition, the limit of 760 m/s between the A and B classes in the NEHRP provisions is set to 800 m/s in Eurocode-8.
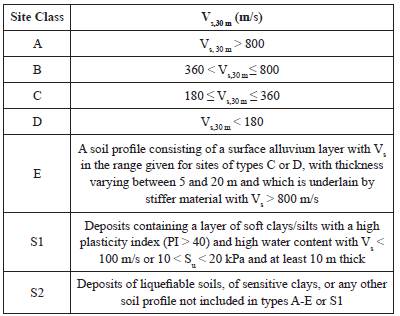
According to Eurocode-8, eight sites correspond to Class C (30.77%), 17 to Class B (65.38%), and one to Class A (3.84%). As can be seen, Classes D, C, and B in in the NEHRP provisions correspond to Classes C, B, and A in Eurocode-8.
Site classification according to TBDY (2018)
The TBDY (2018) involves six site classes (ZA, Z B, Z C, ZD, ZE, and ZF) to identify the site-specific design spectra shown in Table 5.
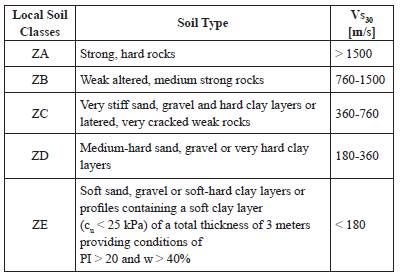
As can be seen in Table 2, eight sites are classified as class ZD (30.77%), 16 as ZC (61.54%), and two as classified as ZB (7.69%), according to the Vs30 criterion.
Site classification according to Rodriguez-Marek et al. (2001)
Rodriguez-Marek et al. (2001) proposed a geotechnical classification scheme based on results from the ground motion data analysis shown in Tables 5 and 6.
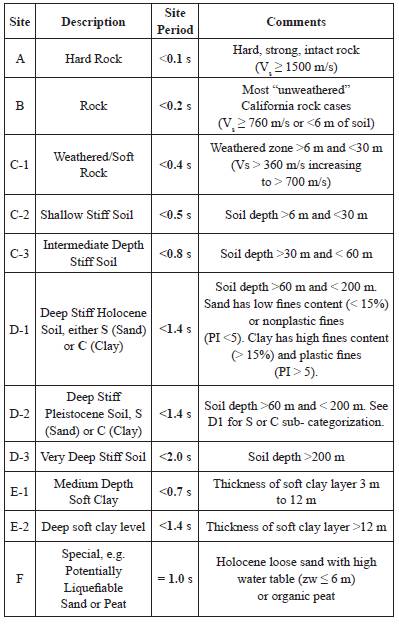
As seen in Table 2, 11 sites are classified as class D1 (42.3%), three as D-2 (11.54%), eight as D-3 (30.77%), one as C-1(3.85), one as C-2 (3.85), and two as C-3 (7.69%), according to the site period.
Site amplification of Hatay Province
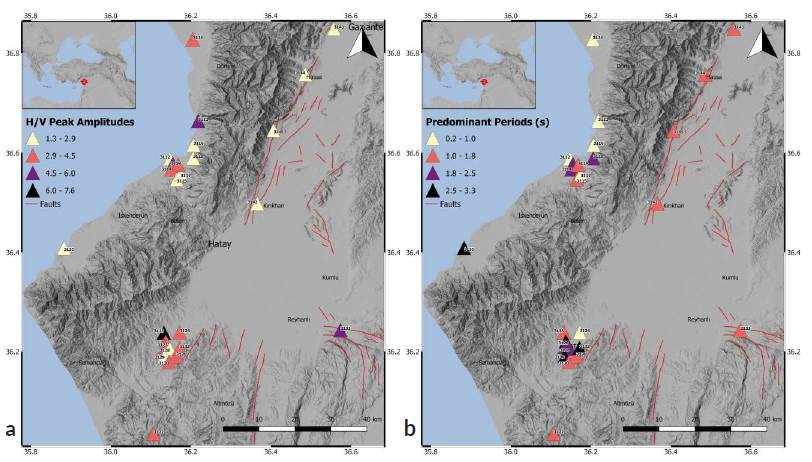
Experimental amplification ratios (H/V) and predominant periods were obtained at 26 locations using the GURALP CMG 6TD with a three-component broadband velocity meter and a 12-volt power supply. The sensitivity of the seismometer sensor to ground motion varied in a wide frequency band from 0.033 to 50 Hz. Microtremor data were obtained in GCF (Guralp Compressed File) format. The three recorded components were viewed and edited with noise data SCREAM (Figure 9). The records were evaluated according to the single station method (H/V) by using Geopsy (SESAME Europe Project, 2004) software. Firstly, a trend analysis was applied to data for removing base-line trend and then a 5% rounded Cosine window was applied on the edges of the raw data to simulate sudden changes at both ends of the timeline. The amplitude of the side-oscillations that can be seen on the resultant spectra was reduced, and the data was filtered with a band-pass Butterworth filter between 1-20 Hz. Thus, the noises of very low and high frequencies are removed from the signals, and the frequency content of the microtremors is left behind. In evaluation of microtremor data, the number of windows is taken into consideration such that the number of distinct cycles in the entire record is greater than 200, the case where the fo (dominant frequency) value is greater than or less than 0.5 Hz, (Table 2)._In the evaluation of microtremor data; criteria such as number of windows, and the standard deviation values of the H / V curves were considered according to SESAME Project (Site. Effects Assessment Using Ambient Excitations, Contract No. EVG1-CT-2000-00026) The H/V peak amplitudes and predominant periods were interpreted according to SESAME (2004) criteria. The top 30 m site conditions were characterized in accordance with the NEHRP Provisions (BSSC 2003), Eurocode-8 (CEN2003), TBDY (2018) and Rodriguez-Marek et al. (2001), as shown in Table 2. The peak amplitudes of the stations (H/V) vary between 1.3-7.6 (Fig. 9a) and their dominant periods range from 0.23 to 3.3 s (Fig.9b).
Discussion
This article uses site responses, site amplification variations using microtremor data of 26 strong motion stations of AFAD in Hatay region. The shear wave velocities, Vs30, up to 30 m of depth vary between 221 and 597m/s at the 3112, 3113, 3114, 3115, 3116, 3117, 3119, 3120, and 3121coded stations. These velocity values are almost the same as those determined by Ozmen et al. (2017) at the same stations. The difference between these two sets of velocity ranges between 0.07% and 2.95%. Büyüksarac et al. (2014) have determined the velocity model of the underground in four stations. They determined the seismic velocities ranging between 380 and 470 m/s at a depth of 0-5m, between 320-480 m/s at a depth of 5-15 m, and between 470-750 m at a depth of 15-25 m. This data are in good agreement with the velocity data obtained in this study (Figs. 5c and 6c). In addition, the soil amplification was calculated as 1.5 in periods of 0.4sec and 0.5sec and 2.0 in the other two stations in 0.25sec and 0.4sec periods, which approximately correspond to the values that we determined. Over et al. (2001) found the average Vs velocities from the REMI studies 413m/s at 0-13m of depth, 420m/s at 13-33m, 560m/s at 33-62m, and 537m/s at about 100 m. These values are very close to the values that we determined by applying the MASW and REMI methods. They also calculated the dominant soil periods between 0.2sec and 0.8sec and site amplification values between 1.1 and 1.8, which correspond to what we found. The sites were classified in accordance with NEHRP Provisions (BSSC, 2003), Eurocode 8 (CEN. 2003), TBDY (Turkish Building Earthquake Regulations, 2018), and Rodriguez-Marek et al. (2001), and tabulated in Table 2. The site classes were found at the stations located to the west of the Amanos Mountains as C and D according to NEHRP and B and C according to Eurocade-8. In both systems, the ground class was calculated as B at Station 3116. Soil classes were the same in the NEHRP and TBDY-2018 systems. Soil classifications obtained in NEHRP and TBDY systems were similar. H/V peak amplitude values were calculated as 2.2 at Stations 3143, 3144, and 3145. The H/V values ofthe stations coded 3123 and 3125 are 3.9 and 4.6, respectively. The H/V value was calculated between 3.9 and 4.6 for Stations 3113, 3114, 3119, 3124, 3130, 3131, 3133, and 3134 and between 1.3 and 3.3 for other stations. The dominant periods (T0) of the stations were between 0.23sec (at Station 3112) and 3.3sec (at Station 3129).
Conclusion
In this study, the subsurface soil condition and experimental site amplification ratios at the strong motion stations of AFAD in the province of Hatay were investigated through geophysical methods including seismic refraction, MASW, REMI, and microtremor surveying. The studies were carried out at 26 strong motion stations to evaluate the site effects and seismic hazard of the Hatay region. The shear-wave velocity profiles of the upper 30m of the sites were determined with MASW and ReMi techniques. Transfer functions (maximum H/V amplitude ratios) and predominant periods were obtained at the same locations by applying microtremor studies. The shear-wave velocities determined with the MASW technique were compared with those obtained employing the ReMi technique. The site class and soil amplification ratio as well as the dominant period of each site are tabulated in Table 2.
The peak frequency of the H / V ratio in a field can be used to create a standard H / V response spectrum, which is a good diagnosis of the field condition. The peak amplitude of the H/V function varies between 1.3 and 5.5. The shape of the standard H / V ratio curve is very similar across regions. Vs30 values (191-1011m/s) corresponding to these peaks show scattering because the studied environments are in a very complex structure.
Two types of regions are recognized based on their dominant period, To, characteristics: (1) To value, respectively, in Hatay region is generally higher than 0.87sec and (2) in Iskenderun region generally lower than 2.5sec.
The database supported by the precise descriptions of site conditions presented here will provide valuable information and will contribute to further development of methods to assess the relationship between site conditions and strong motion parameters.

